Abstract
This study centers on the impact of water level fluctuations in water transfer tunnels regarding the mechanical response characteristics of railroad tunnels. Via a meticulously designed model test, the variation pattern of tunnel lining strain under diverse water level circumstances is thoroughly examined, furnishing a crucial foundation for the design, construction, and safe operation of tunnel engineering. The outcomes denote that water level alterations remarkably influence the tunnel's mechanical response. Each parameter exhibits disparate trends with the ascending water level, and discrepancies exist in the response features of different cross-sectional locations. The test results are as follows: (1) When the water level in the water transfer tunnel is 1 cm, the compressive strain at the outer elevated arch of section I reaches the maximum, and the compressive strain at the inner left arch foot is also the largest. (2) The tensile strain at the outer right arch waist of section II is the greatest, and the compression at the inner right arch waist is severe; the tensile strain at the outer right arch foot of section II exceeds the compressive strain at the arch top, and the compressive strain at the inner right arch foot is the largest. These findings offer a scientific underpinning for exploring the effect of water level loading on the mechanical response of the tunnel structure within the tunnel section beneath the water transfer tunnel, which is highly significant for enhancing project quality and ensuring operational safety.
1. Introduction
As the railway construction advances rapidly, the number of tunnel projects increases annually, often necessitating passage through or near existing structures [1-4]. This poses significant engineering challenges, as tunneling can disrupt surrounding soil, redistributing stress in the rock and affecting the stability of nearby structures [5]. In turn, changes in these structures can impact the newly constructed tunnel, creating a complex interaction that requires careful management to ensure safety and functionality [6]. For instance, in Lanzhou’s Anning District, the new North Ring Tunnel crosses under an existing tunnel with a minimal soil cover of just 1.36 meters, significantly less than half the tunnel's diameter. Another case is the Guandao Ling Tunnel, which crosses under a water tunnel with a clearance of about 16.7 meters. These examples highlight the need for predicting and mitigating the interactions between new and existing structures during tunnel construction [7-9]. Addressing these challenges involves systematic research into the mechanical responses and deformation mechanisms of new tunnels affected by existing ones [10]. The goal is to develop effective preventive and control measures to keep impacts within acceptable limits, which is crucial for theoretical understanding and practical tunnel construction [11].
This study aims to quantitatively reveal the dynamic influence of water level changes in water transfer tunnels on the mechanical response of railroad tunnel structures underneath by means of scaled-down modeling tests, to clarify the strain characteristics of key sensitive areas (such as the arch foot and arch waist), and to provide a theoretical basis for the seepage-resistant design, construction reinforcement, and long-term safety monitoring of tunnels under complex hydrogeological conditions.
2. Materials and methods
Model tests are often conducted using scaled-down designs due to constraints in laboratory space, model size, and applied loads. In this study, geometric, density, and elastic modulus similarity ratios were selected as control parameters. Based on the actual tunnel depth (58.7 m) and the model box height (2 m), the geometric similarity ratio was determined as 1:50. Material comparisons led to a density similarity ratio of 1:1 and an elastic modulus similarity ratio of 1:50. Other parameters were derived through dimensional analysis and similarity theorems, while secondary parameters were ignored to prioritize maintaining similarity relationships for key parameters, ensuring alignment with the research objectives.
Experimental design of the effect of water level on the mechanical response characteristics of tunnels in water transfer tunnels. As the new tunnels need to pass through the water tunnel, which is an unlined tunnel without water pipes, the infiltration of water into the surrounding rock is serious when the water flows through the tunnel, thus affecting the mechanical response characteristics of the tunnel, which is a serious threat to the safe construction and operation of the tunnel. Therefore, it is important to study the mechanical response characteristics of tunnels passing through water tunnels, which can provide guidance for the reinforcement and waterproofing of the surrounding rock in tunnel projects. In this chapter, a modeling method is chosen to study the effect of water level changes on the mechanical response characteristics of tunnels passing through water tunnels.
Test Equipment Preparation. The test equipment consists of three main parts: a water level control device, a tunnel model box, and signal acquisition equipment, as shown in Fig. 1.
Fig. 1Water level control device diagram
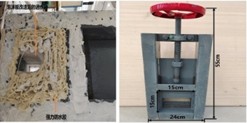
a) Manual plug valve

b) Join

c) Water storage
d) Water level control device
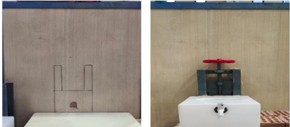
The experimental setup includes a water level control device, comprising a water tank and a manual plug valve, designed to simulate the effects of water level fluctuations on tunnel structures. The water tank, measuring 55 cm×35 cm×24 cm, features a model tunnel cross-section with holes to maintain consistent water level and prevent overflow. A faucet is installed on the top edge of the hole to regulate water levels and mitigate testing instability. The manual plug valve, 24 cm by 55 cm, has a 15 cm square gate hole that controls the water flow into the model box. The valve’s gate hole is adapted from the actual tunnel’s vault and straight wall structure, using a 15 cm×15 cm plastic foam board to match the model’s cross-section. The tank and valve are securely bonded with waterproof glue, ensuring a seamless connection. The tunnel model is shown in Fig. 2.
For model construction, a prototype tunnel with a height of 9.447 m was scaled down based on geometric similarity to a model height of 19 cm, length of 90 cm, and a clear distance of 33.4 cm between the model tunnel and the water transfer tunnel. A 1:1 ratio of gypsum to water was mixed and poured into a mold lined with steel wire mesh to simulate tunnel reinforcement. The model was then painted with varnish and maintained under controlled conditions to ensure the gypsum's physical and mechanical properties were consistent. The model was cast in sections and bonded with strong glue and adhesive tape to simulate the prototype’s overall stress state.
Fig. 2Schematic diagram of the tunnel model
The tunnel model schematic reveals a straight-walled water transfer tunnel with dimensions of 2 m wide, 3 m high, and an arch depth of 39 m. Based on geometric similarity, the model’s scaled-down dimensions are 4 cm wide and 6 cm high. Constructed from a 4 cm×4 cm rectangular aluminum alloy pipe for the lower half and a 4 cm diameter semicircular PVC pipe for the upper half, these parts are tightly joined to form a cohesive structure. The entire assembly is securely bonded with strong adhesive to ensure stability. The 155 cm-long model has plastic fillers in its cavity to increase its rigidity and resistance to bending and compression.
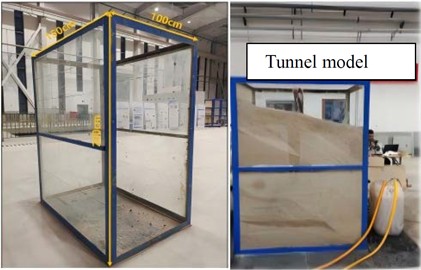
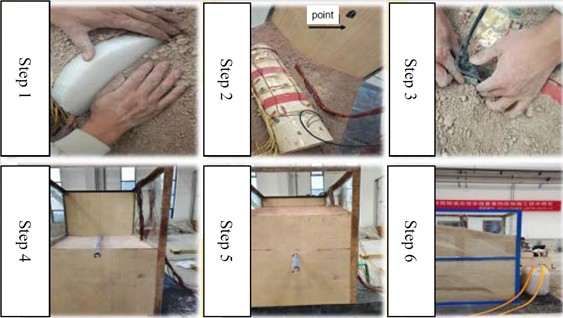
The tunnel surrounding rock materials were prepared based on a similarity ratio, mixing soil, sand, barite powder, gypsum, and water in proportion. The mixture was stirred in a mixer, then sieved to remove large particle inconsistencies. Foam boards were used to seal the tunnel model’s opening to prevent rock intrusion. The model was filled in layers, compacted every 10 cm to ensure uniform densification, and scraped to avoid layering before adding the next layer. Once the arch section was reached, sensors were placed at measurement points and the model was positioned. The model, connected to a plank inlet and outlet, was filled and compacted to the design height. After filling, the embedded model was carefully removed, leaving an unlined, straight-walled arch structure, as illustrated in Fig. 3.
Fig. 3Schematic diagram of the filling process
3. Results and analysis
To analyze the water level’s impact on tunnel strain in water transfer tunnels, we conducted a test to characterize the strain response. We plotted strain-time curves based on measured data to analyze the strain change characteristics at each cross-section, focusing on maximum strain values and points of tension and compression. Positive strain indicates tension, leading to elongation, while negative strain signifies compression, causing shortening. The relationship between strain and time was curve-fitted to reveal the change regularity of strain over time. We specifically analyzed the strain response law for a water level of 1cm over a 60-minute period.
Tunnel lining strain as a function of time:
where denotes the initial strain, denotes the amount of strain change, and denotes the time as a function of strain change.
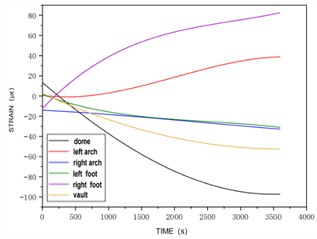
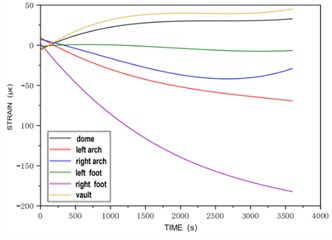
Fig. 4Strain vs. time at section 1 for Case 2
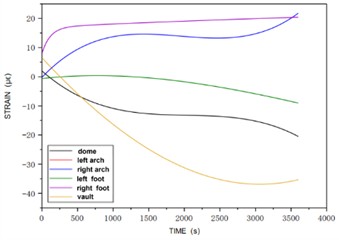
a) Strain vs. time at the outer portion of section 1
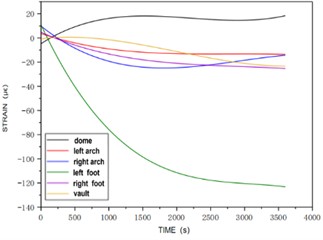
b) Strain vs. time at each point inside section 1
In Fig. 4, as the tunnel water level reaches 1 cm, strain patterns emerge at various points on Section 1’s outer side. The left arch foot shows a consistently linear increase in strain, while other points exhibit an initial rapid increase followed by a gradual stabilization. Tensile strains are notable at the right arch foot, waist, and left arch waist, decreasing in that order. Compressive strains are observed at the left arch foot, arch top, and back arch, with the back arch strain increasing most rapidly to become the dominant strain in the mid-to-late stages. The superelevation arch strain increases linearly, and the left arch foot strain is significantly larger than other areas.
Fig. 5Strain versus time at section 2 for Case 2
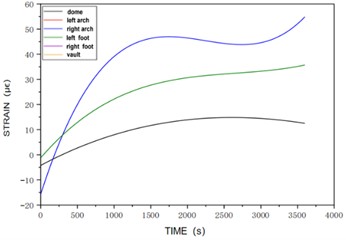
a) Strain vs. time at the outer portion of section 2
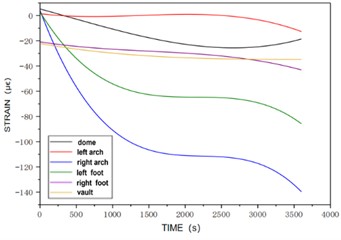
b) Strain vs. time at each point inside section 2
In Fig. 5, at a water level of 1 cm in the tunnel, Section 2 experiences varying strain patterns. Externally, the left arch foot strain rises from a non-zero value, followed by increases at the right arch foot, left and right arch waists, and arch top, while the superelevation arch strain remains at zero. The left arch waist and right arch foot strains peak and then stabilize, with the left arch waist transitioning from tension to compression. Internally, all measurement points show compressive strain. The arch top and left arch waist strains initiate later, with the left arch foot and right arch waist strains increasing more synchronously. Initially, these strains grow slowly, then rapidly in response to water load, and finally slow down, with the right arch waist strain being the most significant in the mid-to-late stages. The superelevation arch strain remains stable until the water load engages, causing a slight increase. The right arch foot strain increases, levels off, and then shows a small overall increase.
In Fig. 6, at a 1 cm water level rise in the tunnel, Section 3’s outer side shows minor fluctuations and relative stability in strain at the initial elevation arch, which gradually increases and then levels off after the water load is applied. The right arch waist strain remains stable initially, then slowly increases. The left arch foot, right arch foot, arch top, and left arch waist all produce strain, with the left arch waist showing a near-linear increase; the other points' strain rates decelerate until they stabilize. Tensile strains occur at the right arch foot and left arch waist, while compressive strains are observed elsewhere, with the arch top and right arch foot showing the largest strains.
Internally at Section 3, the right arch foot experiences compressive strain that is stable initially, then increases at a decreasing rate as the water load is applied. The arch top, supination arch, left and right arch waists, and left arch foot all generate strain, growing rapidly at first, then stabilizing. Except for the superelevation arch and vault which show tensile strains, all other points are under compression, with the right arch foot strain being notably larger.
Fig. 6Strain vs. time at section 3 for Case 2
a) Strain vs. time at the outer portion of section 3
b) Strain vs. time at each point inside section 3
4. Conclusions
In order to study the mechanical response characteristics of new tunnels under different water levels in existing water transfer tunnels, model tests were designed to monitor the strains at each measurement point of the tunnel lining section, and time-course curve analyses and function curve fitting were carried out to analyze the mechanical response characteristics of the measurement points at each section under different water levels. The following conclusions were obtained.
1) The research results provide a scientific basis for the reasonable consideration of the water level influence in the design stage of the tunnel project, the adoption of targeted reinforcement and waterproofing measures during the construction process, and the safety monitoring during the operation period, which is of great significance to guarantee the safety and stability of the railroad tunnel under the influence of the water transfer tunnel. In the future, we can further optimize the test scheme, expand the working conditions, and investigate the mechanical response mechanism of tunnels under the joint action of water level and other factors (e.g., train load, etc.).
2) When the water level in the water tunnel is 1 cm, the compressive strain at the outer elevated arch of section 1 is the largest, and the compressive strain at the inner left arch foot is the largest; the tensile strain at the outer right arch waist of section 2 is the largest, and the pressure at the inner right arch waist is serious; the tensile strain at the outer right arch foot of section 1 is larger than the compressive strain at the top of the arch, and the compressive strain at the inner right arch foot is the largest.
The main innovations of this study are:
1) A multi-scale dynamic model test system of water transfer tunnel-railway tunnel interaction is constructed, and the nonlinear strain distribution law of the tunnel cross-section under the 1 cm water level threshold is quantified for the first time.
2) Proposed a method for identifying sensitive areas in tunnels based on strain time-course curve fitting, which provides a new tool for quickly locating high-risk areas (e.g., right arch foot and left arch waist) in engineering practice.
3) Validated the effectiveness of the gypsum-wire mesh composite model in simulating non-uniform deformation of tunnel lining, which provides a reliable paradigm for the selection of materials for subsequent scaling down tests.
References
-
X. H. Fang, “Analysis of the impact of shield tunnel proximity construction on existing tunnels,” Central South University, 2014.
-
M. Jiang, “Study on the stability analysis of surrounding rock in the cross section of proximity tunnel,” Liaoning University of Engineering and Technology, 2015.
-
Shan and S. B., “Research on construction impact and control of Hefei subway shield tunnel near connecting viaduct,” Hefei University of Technology, 2017.
-
X. Hu, “Research on the influence law of large span tunnel construction on the upper and lower proximity sensitive structures,” Chongqing Jiaotong University, 2020.
-
X. Y. Mao, B. G. Chen, C. X. Jiang, and M. K. She, “Research on the influence law of shield tunnel underneath near-connected highway tunnel,” Highway, Vol. 63, No. 4, pp. 258–263, 2018.
-
J. J. Li, “Research on the impact of deformation and control measures of construction deformation of dark excavation interval tunnel near the existing subway tunnel,” Modern Tunneling Technology, Vol. 56, No. 4, pp. 168–174, 2019.
-
Y. Y. He, K. Wei, and H. Guo, “Comparative analysis of reinforcement of existing shallow buried diversion tunnels below highway embankment,” Highway, Vol. 64, No. 2, pp. 276–280, 2019.
-
X. Y. Yang, “Mechanical response study of the construction of proximity power tunnel going up through the existing station structure,” Hebei University of Geology, 2019.
-
R. Bao, “Research on the impact of double-line shield tunnel construction on proximity pile foundation,” Southwest Jiaotong University, 2019.
-
X. D. Gao, “Mechanical response analysis and settlement simulation study of a new subway tunnel near-connection underneath an existing line station,” Lanzhou Jiaotong University, 2015.
-
J. G. Chen, “Research on the impact of up-and-down crossing tunnel proximity construction on existing tunnels,” South China University of Technology, 2017.
About this article

Gansu Province Key Research and Development Plan – Industrial Category Project (23YFGA00280). Science and Technology Development Program of China Railway Nine Bureau Group Limited (ZTJJ-THWQ-JSFW-2022-14).
The datasets generated during and/or analyzed during the current study are available from the corresponding author on reasonable request.
The authors declare that they have no conflict of interest.
