Abstract
This study focuses on the mechanical response characteristics of railway tunnels under train loading, which is investigated in depth through model tests. The design of the test covers the similarity ratio, model box, structural model, transducer and loading condition, etc. The model test process includes shaker fixing and model box filling. The test results show that: (1) under different loading frequencies, the acceleration at each measurement point of the tunnel lining cross-section is sinusoidal, which is positively correlated with the frequency, and there is a good third-order polynomial fitting relationship between the loading frequency and the peak acceleration. (2) The peak acceleration of the vault and the left arch foot varies significantly under specific frequency conditions, and the peak acceleration of the superelevation arch grows rapidly; (3) The pattern of change of peak acceleration in the time domain analysis is highly consistent with the pattern of change of amplitude in the corresponding frequency domain analysis. This study provides important data support and theoretical basis for the design, construction and maintenance of railway tunnels, which helps to ensure the safe operation of railway tunnels, and at the same time provides a reference for further in-depth research on the evolution of the performance of the tunnel structure under the action of complex train loads.
1. Introduction
As an important channel for transport, railway tunnels have a crucial position in railway construction. With the rapid development of railway transport, the impact of train loads on tunnel structures has received increasing attention. During the design and construction of railway tunnels, it is crucial to accurately predict the mechanical response of tunnel structures under train loads. Unreasonable design and construction may lead to damage and failure of the tunnel structure, thus affecting the normal operation of the railway. Chen et al. [1] analysed the dynamic response law of the structure affected by the train load when the shield tunnel is in different strata by establishing three finite element models of the roadbed, lining and soil. Wang et al. [2] calculate the tip stress field of cracks and the strength factor of stresses for cracks in tunnel lining under the influence of train loads. Liu et al. [3] analysed the dynamic stress response law of shield tunnel lining pipe sheet and connecting bolts under the vibration load of train by establishing a three-dimensional finite element model. Du et al. [4] analyse and calculate the dynamic response of tunnel lining under single-vehicle and double-vehicle traffic by establishing a 3D finite element model of a rectangular tunnel. Sheng [5] analysed the dynamic response characteristics of the crossover section and the normal section for the trains in the crossover tunnels under the three passing conditions of up, down and up and down, and derived the hazardous passing modes and hazardous cross-sections. Liu [6] investigated the variation rule of vertical and horizontal pore water pressure in the surrounding rock strata with the train vibration load by establishing an underground shield curve tunnel model. Zhang et al. [7] quantitatively analysed the change mechanism and performance of tunnel lining cracks under heavy train loading by using extended finite element and model test method.
At present, the research on the mechanical response characteristics of railway tunnels under train loads has achieved certain results. However, most of these studies focus on theoretical analyses and numerical simulations, and lack verification and in-depth research on actual engineering. In addition, there are differences in the response of different geological conditions and tunnel structure forms to train loads, so further field tests and model tests are needed to study the mechanical response characteristics of railway tunnels under train loads in depth. The aim of this study is to reveal the basic laws of the mechanical response of railway tunnels under train loads through the analysis and discussion of the test results by means of model tests, so as to provide a scientific basis for the design, construction and maintenance of railway tunnels. The specific objectives include: (1) Analyzing the time-domain and frequency-domain response characteristics of acceleration and dynamic strain: Investigating the variation patterns of acceleration and dynamic strain of the tunnel lining under different loading frequencies, as well as the relationships between these responses and loading frequencies. (2) Identifying the critical affected areas: Clarifying which parts of the tunnel lining exhibit the most significant responses in acceleration and strain under train load, and the patterns of these responses with changes in loading frequency.
2. Experimental design of the model of mechanical response characteristics of tunnel under train loading
2.1. Similarity ratio design and material proportioning
Based on the actual tunnel depth and model box size, the geometric similarity ratio is determined to be 1:50. By comparing the material parameters of the test site with those of the actual project, the density similarity ratio is determined to be 1:1, and the modulus of elasticity similarity ratio is determined to be 1:50. Using the method of magnitude analysis and the similarity theorem, the similarity ratios of the other physical parameters are deduced. The tunnel perimeter rock material adopts the IV perimeter rock ratio consistent with the actual project, including soil, sand, barite powder, gypsum and water, with the ratio of soil to sand being 2:4, and the proportions of barite powder, gypsum, and water being 40 %, 7 %, and 10 %, respectively, with 0.5 % borax added to the water as a retarder. The tunnel model was cast using a 1:1 mixture of gypsum and water, and 1 cm×1 cm wire mesh was placed in the mould to simulate rebar.
2.2. Model box and structural model
The size of the model box was selected as 1.5 m×1 m×2 m (length×width×height), and a hole suitable for the tunnel model was cut out at the designated location, with a height of 19cm, a superelevation arch of 40cm from the bottom of the box, and a roof of 141 cm from the top surface of the box to satisfy the test requirements. The model box used for the test is shown in Fig. 1. The tunnel model was poured by mixing gypsum and water at a ratio of 1:1, and 1 cm×1 cm of steel wire mesh was put into the tunnel membrane tool in advance to simulate the longitudinal and circumferential reinforcement in the tunnel lining, and then the configured gypsum slurry was poured into the mould. The tunnel model is 19 cm high and 90 cm long, buried in the model box at a depth of 117.4 cm, and the elevated arch is 40 cm from the bottom of the box.
2.3. Sensor selection and measurement point arrangement
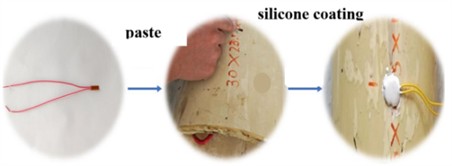
A three-way capacitive acceleration sensor (Model 1C302) was selected to monitor acceleration (Fig. 2) and a patch-type resistive strain gauge (Model BFH120-10AA-D150) to monitor strain, as shown in Fig. 3, in order to accurately obtain data on the mechanical response of the tunnel lining under train loading.
Fig. 1Test model box
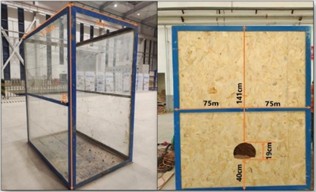
Fig. 2Acceleration sensor

Fig. 3Strain gauge attachment
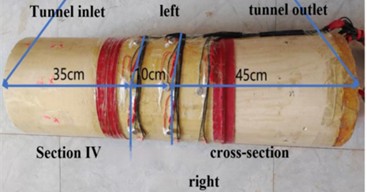
In the 90 cm-long tunnel model, section IV (35 cm from the inlet end and 55 cm from the outlet end) was selected as the study surface, and acceleration sensors and dynamic strain gauges were deployed at its vault, left and right arch waist, left and right arch foot, and elevation arch, with a total of 6 acceleration sensors and 6 dynamic strain gauges, to comprehensively monitor the mechanical response of each key part of the tunnel, and the study surface of the modelled tunnel is shown in Fig. 4.
Fig. 4Model tunnel study surface
2.4. Load condition design
Referring to the existing studies, the sinusoidal cyclic load is used to simulate the train load, and the load expression is:
The magnitude of the load frequency loaded in the test can be calculated by the following equation:
The loading frequency was calculated based on the train speed and wheelset axle spacing, and seven speed conditions were selected in the 40-160 km/h speed range.
2.5. Model test procedure
(1) Shaker fixing. The shaker is fixed to a special wooden plate to ensure that it is mounted securely and provides a stable vibration source for subsequent tests. The fixed steps are shown in Fig. 5.
(2) Model box filling. Prepare the material according to the proportion, fill and tamp the model box in layers, place the tunnel model and the shaker at the appropriate height, connect and comb the sensor lines, and continue to fill to the design height to ensure the accuracy and reliability of the test model.
Fig. 5Fixed shaker

3. Analysis of the acceleration response of the train load on the tunnel
3.1. Acceleration response time domain analysis
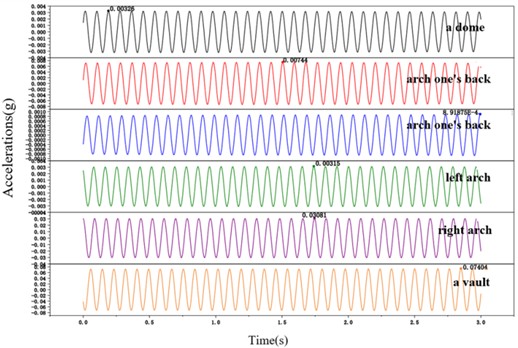
In this section, the axle weight of the train is 35 t, the normal running speed of the train is 80 km/h, and the loading frequency of this condition is 11.4 Hz. The acceleration data at 6 measurement points of the tunnel lining cross-section are filtered to get the acceleration curve at each measurement point under this loading condition, as shown in Fig. 6.
Fig. 6Acceleration time curve at each measurement point with loading frequency of 11.4 Hz
In order to investigate the effect of loading frequency on the acceleration response law of the tunnel lining, the acceleration time course curves of the tunnel monitoring surface at the top of the arch, the left and right arch waist, the left and right arch foot, and the superelevation arch at the different loading frequencies were plotted respectively (not shown in the text), and the acceleration peak value of each measurement point was obtained.
The relationship between the peak acceleration and the loading frequency for each measurement point at each condition was curve fitted using Origin, and the fitted curve function was a third order polynomial function. Curve fitting shows that the peak acceleration at each measurement point is well fitted to the loading frequency, and the correlation coefficients are all greater than 0.98.
3.2. Frequency domain analysis of acceleration response
The Fourier transform of the acceleration time curve at each measurement point of the tunnel lining cross-section gives the acceleration spectrum at a loading frequency of 11.4 Hz as shown in Fig. 7.
Fig. 7Acceleration spectra at various measurement points under a loading frequency of 11.4 Hz
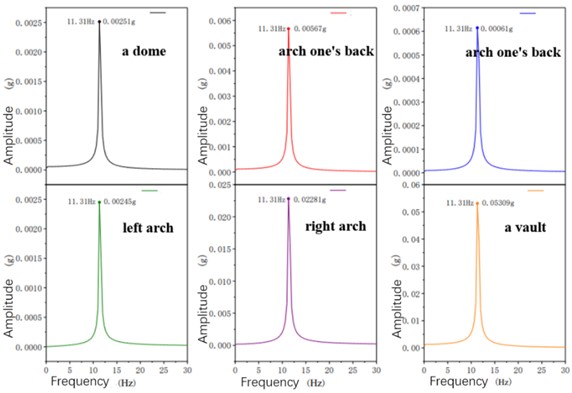
The maximum amplitude of acceleration at each measurement point of the tunnel lining cross-section under each working condition is increased with the increase of the loading frequency, and decreased only at some points, which is consistent with the time-course curve of acceleration of the points. This is basically consistent with the pattern presented by the acceleration time curve at each point. This shows that the change rule of the peak value in the acceleration time course curve is basically the same as the change rule of the acceleration amplitude corresponding to the optimal frequency.
The ratio of the maximum amplitude in the spectrogram of each measurement point of the tunnel section for each condition to the peak acceleration at each measurement point for the corresponding condition is taken, and the results of the calculation are shown in Table 1.
Table 1Ratio of acceleration amplitude to peak value (%)
Measurement point | 5.7 Hz | 8.6 Hz | 11.4 Hz | 14.3 Hz | 17.2 Hz | 20.0 Hz | 22.9 Hz |
A dome | 98.21 | 91.52 | 76.99 | 99.86 | 92.41 | 98.85 | 75.78 |
Arch one’s back | 95.89 | 92.83 | 76.21 | 99.36 | 90.34 | 99.16 | 75.88 |
Arch one’s back | 93.33 | 87.04 | 68.54 | 99.24 | 81.68 | 100.83 | 76.05 |
Left arch | 97.41 | 88.69 | 77.78 | 99.90 | 90.52 | 98.63 | 77.16 |
Right arch | 92.97 | 91.33 | 74.03 | 100.05 | 90.98 | 99.47 | 73.96 |
A vault | 97.84 | 91.36 | 71.70 | 100.25 | 93.47 | 98.93 | 76.32 |
Taking the ratio of the maximum amplitude in the spectrogram of each measurement point of the tunnel section for each condition to the peak acceleration at each measurement point for the corresponding condition, it was found that the difference between the time domain analysis and the frequency domain analysis was larger when the loading frequencies were 11.4 Hz and 22.9 Hz, while the difference for other conditions was smaller.
4. Conclusions
1) When loading different frequencies, the acceleration at each measurement point of the tunnel lining cross-section varies in the form of sinusoidal wave, and there is a positive correlation between the acceleration and frequency as the frequency increases. There is a good third-order polynomial function fit between the loading frequency and the peak acceleration for each condition, and the correlation coefficients between acceleration and frequency are all greater than 0.98.
2) Under different loading frequency conditions, the peak acceleration at the superelevation arch is obviously higher than that at other parts, and the acceleration increases most rapidly with the increase of frequency, followed by the peak acceleration at the left and right foot of the arch and the rate of increase is also larger, and the peak acceleration at the arch and the left and right arch girdles are not much different, and there is no obvious trend of increase with the increase of frequency.
3) The pattern of change of peak acceleration in the time domain analysis is highly consistent with the pattern of change of amplitude in the corresponding frequency domain analysis.
In summary, this study reveals the basic laws of the mechanical response of railway tunnels under train loads through systematic model tests and detailed analyses, which provides valuable data support and theoretical basis for the design, construction and maintenance of railway tunnels, and is of great significance to ensure the safe operation of railway tunnels. The main aspects are as follows: (1) Providing scientific guidance for the seismic and vibration-resistant design of tunnel structures, which can effectively reduce structural damage caused by train operations and extend the service life of tunnels. (2) In monitoring and assessing the health status of tunnel structures, potential problems can be detected in a timely manner based on the response characteristics of acceleration and dynamic strain. After identifying the critical affected areas, targeted maintenance and reinforcement can be carried out to reduce maintenance costs. Future research can further optimise the test method and expand the working conditions to explore the long-term performance evolution of tunnel structures under complex train loads.
References
-
Y. X. Chen, Z. Fu, and X. Z. Liu, “Study on the vibration response of large-diameter shield tunnel train under different strata,” Journal of Underground Space and Engineering, Vol. 19, No. S1, pp. 458–464, 2023.
-
D. P. Wang, J. C. Wang, and X. M. Zhang, “Reliability analysis of fatigue extension of tunnel lining cracks considering train load,” China Railway Science, Vol. 44, No. 6, pp. 95–102, 2023.
-
J. H. Liu, Z. Q. Yi, and L. G. Tian, “Study on dynamic response of shield tunnel structure under train vibration load,” Journal of Underground Space and Engineering, Vol. 19, No. S2, pp. 901–907, 2023.
-
M. F. Du, X. C. Yang, and Q. Wang, “Dynamic response analysis of rectangular tunnel structure under metro train loading,” Journal of Henan Urban Construction Institute, Vol. 32, No. 6, pp. 53–58, 2023.
-
J. B. Sheng, “Numerical simulation analysis of dynamic response of cross tunnels under train loading,” Hebei University of Architecture and Engineering, 2023.
-
X. Liu, “Research on the response law of train vibration to pore water pressure in curved tunnel soil layer,” North China University of Water Resources and Hydropower, 2023.
-
Z. G. Zhang, B. Wu, and J. Chen, “Study on the effect of heavy trains on the bearing performance of cracked tunnel lining,” (in Chinese), Tunnel Construction, Vol. 42, No. S1, pp. 56–65, 2022.
About this article

This study was funded by the Science and Technology Development Program of China Railway Ninth Engineering Group Co., Ltd. (ZTJJ-THWQ-JSFW-2022-14) and the Key R&D Program-Industrial Projects of Gansu Province (23YFGA0028).
The datasets generated during and/or analyzed during the current study are available from the corresponding author on reasonable request.
The authors declare that they have no conflict of interest.
