Abstract
Transmission towers serve as critical components of power-transmission lines. Their structural integrity, inclination and other conditions are closely related to the safe operation of power-transmission lines. In engineering practice for loose-bolt detection on transmission towers, merely achieving qualitative judgment of “loose or not” cannot satisfy operation-and-maintenance requirements. It is essential to further locate the exact positions of loose bolts so that maintenance personnel can accurately identify hidden hazards. This paper proposes a two-level technical route of “feature extraction-sound source localization”. First, continuous knocking and steady-state excitation are adopted to trigger structural acoustic-vibration responses, and time-frequency features specific to bolt looseness are extracted. Then, beamforming-based sound-source localization technology using a microphone array is employed to precisely locate fault characteristic frequencies, so as to realize accurate positioning of loose bolts.
1. Introduction
Traditional loose-bolt detection relies mainly on manual inspection via wrench-tightening tests and visual observation, suffering from heavy labor, low efficiency, high missing-detection rates and strong subjectivity. With advances in sensor, signal-processing and AI technologies, novel techniques based on guided waves, acoustic-vibration responses, piezoelectric impedance and image recognition are emerging.
Audible-sound detection excites acoustic waves via excitation devices and records them with microphones, similar to track workers judging rail looseness by knocking. It enables full-area detection but is vulnerable to interference and struggles to identify slight loosening. Chen et al. proposed a deep-convolutional-neural-network voiceprint-recognition algorithm that extracts loosening features by wavelet transform. He et al. used MFCC feature vectors for voiceprint recognition, with a critical MFCC value of 4.0 separating looseness from tight fastening. Qin et al. combined variational mode decomposition and adversarial multi-layer perceptron (VMD-AT-MLP), reaching 88 % and 80 % accuracy for 110 kV and 220 kV towers, and also built an MFCC-based machine-learning framework with adversarial-training noise suppression and an SVM, achieving 89.93 % accuracy.
These studies confirm the effectiveness of acoustic-vibration detection for loose bolts. Nevertheless, audible-sound detection still faces interference susceptibility, difficulty in detecting slight loosening and insufficient real-tower datasets. Miniaturized low-power MEMS sensors can enable long-term online monitoring with real-time data upload for early warning.
This paper presents a two-level technical route of “feature extraction-sound source localization”. Continuous knocking and exciter-driven excitation stimulate structural acoustic-vibration responses, from which unique time-frequency features of bolt looseness are extracted; beamforming sound-source localization with a microphone array then pinpoints fault characteristic frequencies. The paper reveals the 10 kHz high-frequency acoustic-radiation feature induced by bolt looseness and establishes a robust STFT-based feature-extraction method.
2. Field-simulated tests
Continuous-knocking excitation features simple equipment, convenient operation and favorable field adaptability. When a rubber hammer knocks on the tower foot, impact energy propagates through the structure as elastic waves. Looseness at bolt-connection interfaces causes micro-sliding, friction and collision that generate abundant nonlinear high-frequency “noise components” with obvious time-variant characteristics. Traditional average power spectra cannot capture such features, whereas spectrograms display time, frequency and energy simultaneously and reveal transient frequency variations caused by looseness.
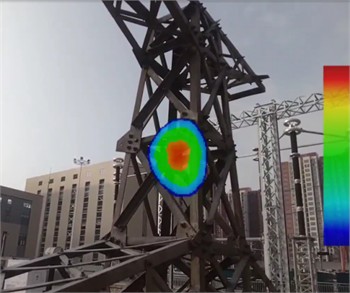
A scaled-down transmission-tower model serves as the test object, on which simulated bolt-loosening and continuous-knocking acoustic-detection tests are carried out. A hammer strikes the lower support leg at intervals of about 2-3 s, and signals are compared under fully-fastened and loose-bolt conditions, with faint clattering noise perceptible when bolts are loose. A handheld acoustic array performs sound-source localization; the result (Fig. 1) matches the actual loose-bolt position, verifying the feasibility of locating loose bolts acoustically.
Fig. 1Schematic diagram of sound-source localization effect for loose bolts
3. Acoustic-signal preprocessing and automatic detection of knocking-events
3.1. Acoustic-signal preprocessing method
Raw acoustic signals from continuous knocking inevitably contain sensor DC offset, low-frequency drift and random electronic noise, which degrade subsequent knocking-event detection and feature extraction. Standard preprocessing is therefore required: mono-channel conversion, mean removal and linear-trend elimination.
For stereo-collected signals, conversion to mono-channel is first performed to simplify analysis. Mean removal eliminates sensor DC offset and restores the signal baseline to zero, and linear-trend elimination removes slow linear drift induced by ambient-temperature variation and sensor-mounting-stress release.
3.2. Automatic detection of knocking moments
After preprocessing, time intervals of all knocking events need to be automatically detected to separately analyze signal features of knocking segments and silent segments. This study adopts a robust threshold method based on signal envelopes, which is insensitive to noise and effectively distinguishes knocking signals from background noise. First, the absolute-value envelope of the signal is computed and smoothed with a second-order Butterworth low-pass filter (cutoff 50 Hz) to suppress high-frequency glitches.
Threshold selection directly influences detection accuracy, and conventional mean-and-standard-deviation methods are susceptible to outliers. The threshold is therefore computed using the more robust median-absolute-deviation (MAD) approach. The definition of MAD is:
where represents the median function. The detection threshold is set as:
where is the threshold coefficient, optimized from experimental data as 5. This value guarantees high detection rates while minimizing false detections.
Samples where the envelope exceeds the threshold are marked as knocking intervals, and the rising and falling edges of each knocking event are located from the filtered envelope.
A single knock may produce multiple consecutive peaks and several adjacent short intervals, so closely-spaced intervals are merged when the gap between them is below 0.1 s. A total of 37 valid knocking events are detected after merging, consistent with the actual count and validating the detection accuracy.
4. Bolt-loosening Feature extraction based on short-time fourier transform
4.1. Principle of spectrogram
Conventional frequency-domain analysis reflects only average frequency characteristics and cannot describe time-dependent variations, whereas bolt-looseness-induced friction and collision noise is distinctly transient, requiring time-frequency analysis. Continuous-knocking and exciter excitation are applied to the lower part of the first tower foot of the 2.2-m tower model, with sound data collected by a sound-source locator at 44 100 Hz.
The short-time Fourier transform (STFT) is a widely adopted time-frequency-analysis approach. Treating non-stationary signals as superpositions of short-time stationary segments, a finite-length window slides across the signal, and a Fourier transform is applied to each windowed segment to obtain the time-frequency distribution.
The definition of STFT is:
where is the raw signal, is the window function, is the time variable and is the frequency variable.
Window-function selection strongly affects STFT time- and frequency-resolution: shorter windows give higher time but lower frequency resolution, and vice versa. The Hamming window, with moderate main-lobe width and large sidelobe attenuation, is selected to suppress spectral leakage. For silent-segment signals, a window length of 8 820 points (0.2 s) with 75 % overlap gives 5 Hz and 50 ms resolution; for strongly transient knocking segments, a 1 024-point window (about 23.2 ms) with 50 % overlap achieves 43 Hz and 11.6 ms, balancing the two.
4.2. Analysis of knocking acoustic signals
Spectrograms are generated using the above parameters, with time on the horizontal axis, frequency on the vertical axis and color indicating power magnitude (brighter = higher power). Fig. 2(a) shows the silent segment between two adjacent knocks, Fig. 2(b) a single-knock segment and Fig. 2(c) the complete signal.
Fig. 2Spectrograms of three different situations
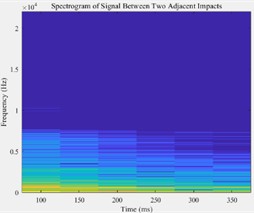
a) Spectrogram of signal between two adjacent impacts
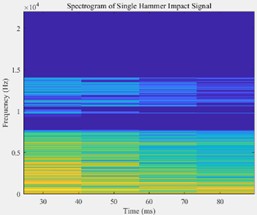
b) Spectrogram of single hammer-impact signal
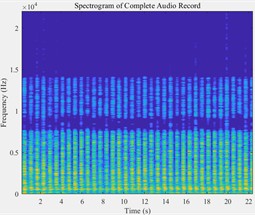
c) Spectrogram of complete audio record
The silent-segment spectrogram shows that, without external excitation, tower background noise concentrates in the 0-5 kHz band as low-intensity baseline features, decaying exponentially above 5 kHz. The band above 10 kHz contains no valid signals, with acoustic-power density below –100 dB/Hz. The tower thus emits no spontaneous acoustic radiation, and environmental noise causes no interference in the mid-high-frequency band, providing excellent signal-to-noise conditions for high-frequency-feature extraction.
The single-knock spectrogram illustrates the response of loose bolts under transient impact: knocking events occur within 30-80 ms, and responses cover a broadband 0-15 kHz range with clear pulse-decay behavior. The 0-5 kHz band is low-order global modal vibration with the highest power density, consistent with natural-vibration attenuation; the 5-10 kHz band relates to high-order local modes and elastic-wave scattering; and discrete striped signals emerge within 10-15 kHz. Such signals cannot be explained by linear-modal theory and originate from nonlinear acoustic radiation from micro-collision, tangential sliding and rough-surface friction at loose interfaces.
4.3. Analysis of steady-state-excitation acoustic signals
The spectrogram under 500 Hz steady-state excitation reveals unique features of loose bolts under continuous excitation. Besides bright lines at the 500 Hz fundamental and its 2nd-3rd harmonics, a continuous broadband-noise band spanning the full excitation duration appears in the 10-15 kHz band, radiated by persistent micro-sliding and friction at interfaces. This proves the 10 kHz component is a specific feature of bolt looseness, not of natural structural vibration or the excitation source.
5. Conclusions
Simulated bolt-loosening experiments and acoustic-detection analyses are carried out on a scaled-down transmission-tower model using time-frequency spectrogram analysis for both exciter-driven and knocking-based excitation, providing references for acoustic detection and sound-source localization of loose bolts.
Under both transient-knocking and steady-state excitation, bolt looseness generates remarkable high-frequency acoustic radiation near 10 kHz at connection interfaces, originating from nonlinear collision and friction at loosened interfaces. This feature offers high sensitivity, robustness and strong spatial directivity, supplying core technical support for sound-source localization and addressing the challenges of low localization accuracy and multi-bolt-coupling interference.
References
-
T. Gong et al., “Review on experimental research of bolt loosening fault monitoring,” (in Chinese), Machine Design and Manufacturing, No. 2, pp. 354–363, 2024, https://doi.org/10.19356/j.cnki.1001-3997.20230824.019
-
C. C. Chen et al., “Voiceprint recognition algorithm for loose bolts on transmission towers based on deep convolutional neural network,” (in Chinese), Electronic Design Engineering, Vol. 33, No. 24, pp. 168–173, 2025, https://doi.org/10.14022/j.issn1674-6236.2025.24.032
-
P. He, Z. Lu, H. Liu, J. Li, and Z. Lu, “Research on voice print recognition of loose state of transmission tower bolts based on MFCC feature vector,” Noise and Vibration Worldwide, Vol. 56, No. 3, pp. 129–136, 2025, https://doi.org/10.1177/09574565251319272
-
Y. Qin et al., “Analysis on local bolt looseness of transmission towers combining variational mode decomposition and adversarial multi layer perceptron,” (in Chinese), Shandong Electric Power Technology, Vol. 52, No. 11, pp. 1–10, 2025, https://doi.org/10.20097/j.cnki.issn1007-9904.250193
-
Y. Qin and L. Yuan, “Intelligent bolt loosening detection in transmission towers using acoustic signature analysis and machine learning,” Processes, Vol. 13, No. 4, p. 1111, Apr. 2025, https://doi.org/10.3390/pr13041111
-
Y. Zhao, Y. Xiao, H. Wang, T. Wang, C. Wu, and B. Zhang, “Effect of bolt tightening force on the transmission tower modal parameters and a method for looseness identification,” Energy Reports, Vol. 7, pp. 842–849, Dec. 2021, https://doi.org/10.1016/j.egyr.2021.09.190
-
Dongmei Tan, Weilian Qu, Jianwei Tu, and Wenke Qin, “Identification of loosen bolt of transmission tower based on wavelet packet analysis and neural net,” in 2011 International Conference on Electric Technology and Civil Engineering (ICETCE), pp. 6646–6649, May 2011, https://doi.org/10.1109/icetce.2011.5775756
About this article

This research was supported by the Science and Technology Project of State Grid Shaanxi Electric Power Co., Ltd. [Grant Number: 5226KY25001N].
The datasets generated during and/or analyzed during the current study are available from the corresponding author on reasonable request.
The authors declare that they have no conflict of interest.

