Abstract
Routine road traffic noise assessment describes the source by traffic volume, speed and vehicle-category shares, whereas monitoring usually reports a measured source-side level with a total vehicle count only, so that the operating conditions behind that level remain unidentified. This paper addresses that gap with a multi-city field study of 25 urban road sections in Guangzhou, China, covering four road classes and three operating periods. Each section-period was measured three times for 20 min with Class 1 instrumentation and counted by vehicle class, giving 75 observations analyzed with an explicit metrological and statistical treatment. Levels ranged from 58.5 to 79.8 dB(A); arterial sections alone spanned 15.0 dB(A) and night-time measurements 21.3 dB(A). Vehicle-class flow was more strongly associated with than average speed, medium-vehicle flow showing the strongest association ( 0.867, 95 % CI 0.797-0.914). The expanded uncertainty of a single level was about 0.8 dB ( 2). The results support recording vehicle-class counts alongside , so that a measured level can be attributed to traffic volume, fleet composition or both.
Highlights
- Field monitoring was undertaken on selected sections of urban roads.
- Three repeated measurements of 20 min were made.
- Vehicle-class flow described the measured level better than average speed.
1. Introduction
Road traffic noise is one of the most widespread environmental exposures in urban areas, and its assessment underpins public-health protection and transport policy [1-4]. Practice relies on strategic noise mapping, required in the European Union by Directive 2002/49/EC [5] and implemented with harmonised methods such as CNOSSOS-EU [6-7], and on national prediction models, whose Nordic, German, Japanese, British and United States variants describe the source by traffic volume, speed, vehicle-category shares and road characteristics [8-9]. In China, road traffic noise is predicted with HJ 2.4-2021 [10] and compared with the limits of GB 3096-2008 [11]; three-dimensional mapping and traffic-dynamics descriptions have extended these tools towards more realistic conditions [12-13].
These frameworks answer how much noise reaches a receiver under assumed traffic conditions. They are less suited to a question faced daily by monitoring agencies: for a measured source-side level at a particular road section, which operating condition produced it? Field records usually combine the equivalent A-weighted level with a total vehicle count, so a high level cannot be attributed to a large traffic volume, to a larger share of medium and heavy vehicles, or to a congestion-related speed reduction. Because fleet composition changes between road classes and periods [13-14] and is known to affect measured roadside levels [15], these alternatives imply different mitigation decisions.
The measures deployed in different countries – noise barriers, low-noise pavements, speed management, traffic restraint and land-use planning – are selected from mapped or predicted exposure [16-18], and their effectiveness depends on identifying the dominant contribution to the measured level, because a barrier cannot compensate for an increase caused by a larger share of heavy vehicles. This study therefore separates traffic volume from fleet composition in a multi-city field evidence base (25 sections, four road classes, three periods, three repeated 20 min records per section-period with vehicle counts by class), analyzed with a metrological and statistical treatment and translated into a monitoring recommendation.
2. Materials and methods
2.1. Field monitoring campaign
Field monitoring was undertaken on selected sections of 25 urban roads in Guangzhou, China, as shown in Table 1. The sample covered four road classes – expressway, arterial, secondary and branch road – and measurement positions were located between intersections, more than 50 m from the nearest one, and kept fixed for all visits.
At each section and operating period, three repeated measurements of 20 min were made. Levels and audio recordings were acquired with a Class 1 precision integrating sound level meter conforming to IEC 61672-1:2013 [19]; the microphone faced the carriageway at 0.2 m from its edge and 1.4 m above ground, following the roadside arrangement required by HJ 640-2012 [20]. A Class 1 acoustic calibrator conforming to IEC 60942:2017 [21] was applied at its 1 kHz, 94 dB reference setting before and after every session, and the result recorded. Field procedures followed the Chinese routine monitoring specification [20] and ISO 1996-2:2017 [22].
Traffic was counted continuously during each acoustic record, and vehicles were classified as small, medium or heavy following the Chinese road traffic noise assessment method [10]; average speed was estimated where a stable value could be obtained.
The operating periods were daytime off-peak (14:30-16:30), daytime peak (17:30-19:00) and night-time (22:00-24:00), the latter consistent with the definition of night in Chinese legislation [23]. Each section-period therefore yields one source-side level, obtained by averaging the repeated records, and one set of traffic values, as summarized in Table 1.
Table 1Field monitoring design and analysed variables
Item | Description |
Study area | 25 road sections in Guangzhou |
Road classes | Expressway, arterial road, secondary road and branch road |
Acoustic sampling | Three 20 min source-side records for each operating period |
Operating periods | Daytime off-peak; daytime peak; night-time |
Instrumentation | Class 1 integrating sound level meter (IEC 61672-1:2013) and Class 1 calibrator (IEC 60942:2017) |
Traffic variables | Total, small-, medium- and heavy-vehicle flow; average speed where available |
2.2. Acoustic and traffic indicators
The primary response variable was the equivalent continuous A-weighted sound level, , calculated from a discrete record of A-weighted levels as:
where is the number of discrete A-weighted samples in the 20 min record and is the th A-weighted level. Traffic intensity for class was expressed as a flow rate , where is the number of vehicles of class counted during 20 min; flows are therefore reported per 20 min record and speeds in km/h. Associations between and the traffic variables were described with the Pearson correlation coefficient:
where is the number of paired observations, and are the paired values of the two variables, and the barred symbols denote the sample means. The coefficient is used only as a descriptive measure of association, and no causal relation is implied. Within-section contrasts are expressed as , a positive value denoting a higher level under condition 2.
2.3. Metrological and statistical treatment
Class 1 instrumentation was used because the applicable standard requires a meter of class 1 or better [11]. The maximum permitted expanded uncertainty of a Class 1 sound level meter at reference conditions is 0.7 dB [19] and the permitted deviation of a Class 1 acoustic calibrator is 0.3 dB [21]; as the dominant Type B contributions these give an expanded uncertainty of about 0.8 dB for a single reported level [24]. Differences smaller than this are not interpreted, although part of the systematic contribution cancels when two levels from the same instrument are subtracted.
The three repeated records of a section-period were averaged, after rejection of outliers, to a single source-side level, so repeated records were not treated as independent observations and pseudo-replication was avoided; the statistics below therefore refer to 75 section-period observations. Minimum-maximum intervals describe the observed spread of the sampled sections and are not confidence intervals. Correlations were tested two-tailed and are reported with 95 % confidence intervals obtained by Fisher z-transformation; because eight traffic variables were examined, a Bonferroni-adjusted threshold (alpha = 0.00625) is also indicated.
3. Results
3.1. Source strength across road classes and periods
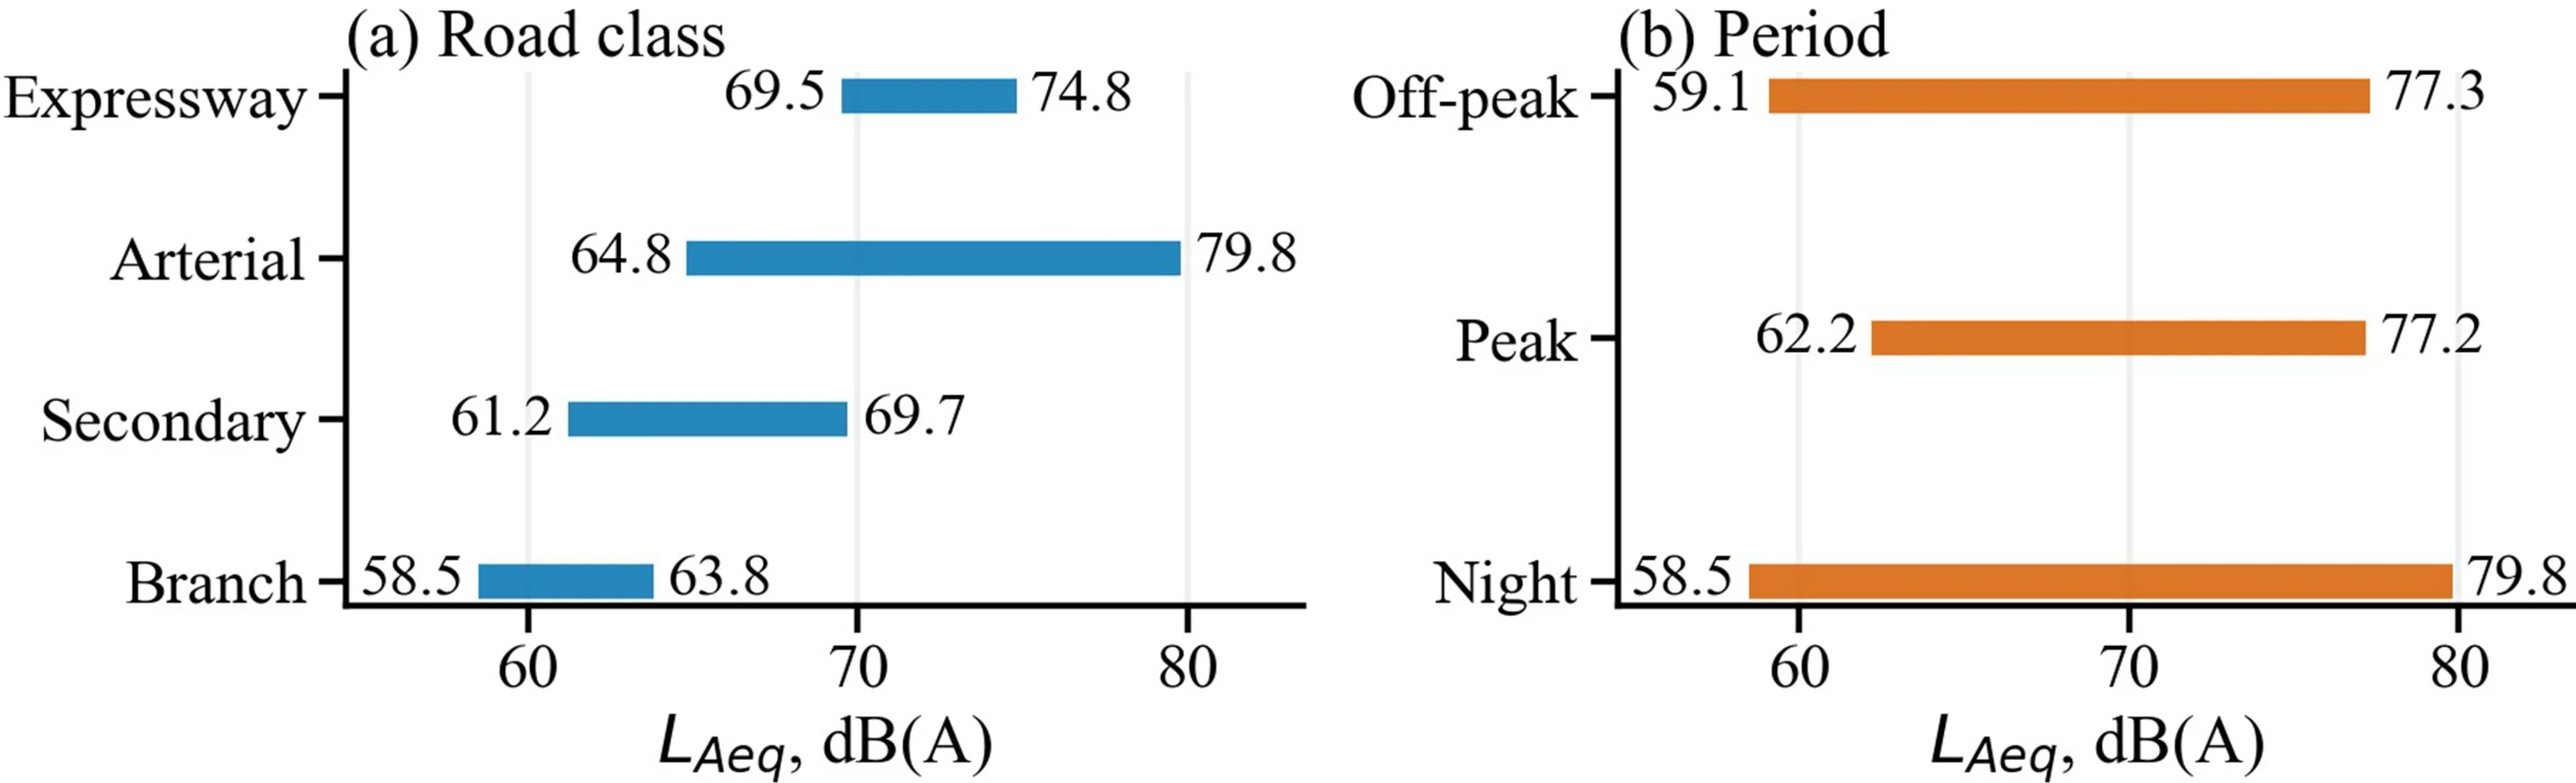
Levels across the 25 sections ranged from 58.5 to 79.8 dB(A), and their intervals differed by road class (Fig. 1(a)): expressways 69.5-74.8 dB(A), arterial roads 64.8-79.8 dB(A), secondary roads 61.2-69.7 dB(A) and branch roads 58.5-63.8 dB(A). The arterial interval (15.0 dB(A)) is an order of magnitude wider than the expanded uncertainty of a reported level (about 0.8 dB(A)), so the spread between sections is real rather than measurement scatter; intervals are observed ranges of the sampled sections, not confidence intervals.
The three periods overlapped substantially (Fig. 1(b)): 59.1-77.3 dB(A) in daytime off-peak, 62.2-77.2 dB(A) in daytime peak and 58.5-79.8 dB(A) at night. The greatest difference between periods at one section was 5.3 dB(A), and no uniform ranking by period was found: both increases and decreases occurred at individual sections, as the within-section comparisons below show.
Fig. 1Observed source-side LAeq intervals by a) road class and b) monitoring period
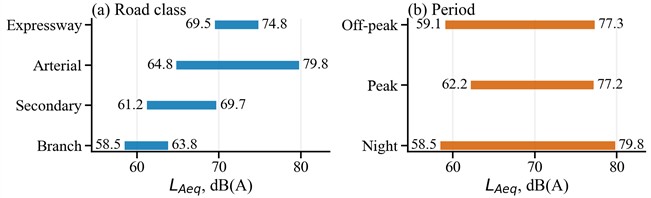
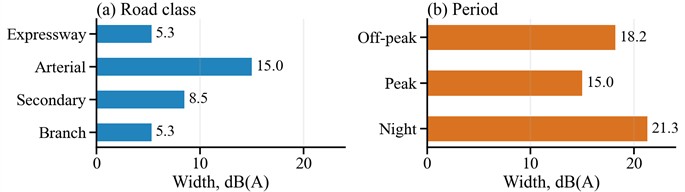
Fig. 2 separates level position from interval width: the width ranged from 5.3 dB(A) for expressways and branch roads to 15.0 dB(A) for arterial roads, and from 15.0 dB(A) at daytime peak to 21.3 dB(A) at night.
Fig. 2Observed minimum-maximum widths of the source-side LAeq intervals
3.2. Associations with traffic volume and vehicle composition
Flows correlated more strongly with the source-side level than the corresponding average speeds (Fig. 3). Correlations with total, small-, medium- and heavy-vehicle flow were 0.794 (95 % CI 0.692-0.865), 0.782 (0.675-0.857), 0.867 (0.797-0.914) and 0.694 (0.554-0.796), all significant at p < 0.001 before and after Bonferroni adjustment. Speed correlations were weaker: 0.335 ( 0.003), 0.306 ( 0.008), 0.455 ( 0.001) and 0.186 ( 0.110); after Bonferroni adjustment only the correlations with total-vehicle and medium-vehicle speed remained significant.
Fig. 3Correlations between the source-side LAeq and traffic-flow or average-speed variables. Whiskers are 95 % confidence intervals (N= 75)
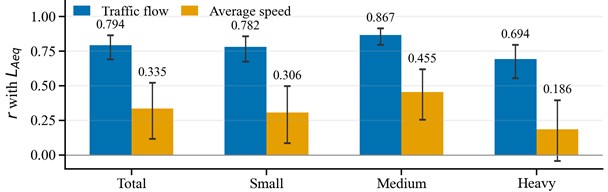
Medium-vehicle flow showed the strongest association and heavy-vehicle flow the weakest, but the confidence intervals of the medium-vehicle and total-flow coefficients overlap, so the two are treated as equivalent descriptors rather than as a ranking. Average speed varied over a much narrower range than flow, which may limit its descriptive value.
3.3. Illustrative operating-condition contrasts
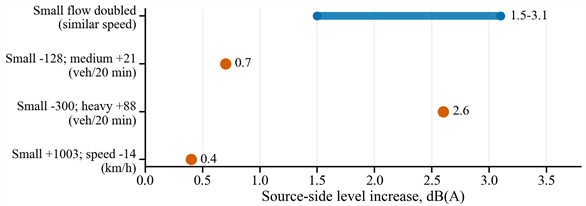
Four within-section comparisons examined whether these associations also appear at individual sections (Fig. 4). Where medium- and heavy-vehicle shares were similar at an arterial section, a doubling of small-vehicle flow accompanied a 1.5-3.1 dB(A) increase. At the same section the transition to night-time removed 128 small vehicles per 20 min but added 21 medium vehicles, and the level rose by 0.7 dB(A), which is comparable with the expanded measurement uncertainty and therefore treated as marginal. At an expressway section 88 additional heavy and 18 additional medium vehicles accompanied a 2.6 dB(A) increase, the largest of the four comparisons. At a secondary road section 1003 additional small vehicles with a 14 km/h speed reduction changed the level by only 0.4 dB(A), which is also within measurement uncertainty.
These are illustrative site-specific examples rather than per-vehicle estimates; they indicate that total flow alone may not describe source-side level changes when composition or speed differs.
Fig. 4Observed source-side level changes in the selected traffic contrasts
4. Discussion
4.1. Novelty relative to established assessment and control practice
Mapping and prediction remain the appropriate tools for assessing exposure over large areas, and the present field data address a different question. A mapping calculation starts from an assumed traffic state, applies emission coefficients and propagation terms and returns a level at a receiver, so its result depends on how well that assumed state represents reality. The measurements quantify part of the variation hidden inside that assumption: one road class spanned 15.0 dB(A) and one operating period 21.3 dB(A). Table 2 compares this description with the frameworks and control practices used in different countries.
Table 2Comparison with established assessment and control frameworks
Framework or practice | Source description used | What the present data add |
Strategic noise mapping (EU Directive; CNOSSOS-EU [5-7]) | Average traffic, fleet mix, speed, surface | Spread to resolve: 15.0 dB(A) within one road class |
National prediction models (Nordic, German, Japanese, British, US [8-9]) | Flow, speed, heavy-vehicle share, geometry | Measured descriptors: medium-vehicle flow 0.867, total flow 0.794, speed 0.186-0.455 |
Chinese assessment and monitoring practice (HJ 2.4-2021; HJ 640-2012; GB 3096-2008 [10-11, 20]) | Flow, speed, vehicle categories; records report total volume | Retain vehicle-class counts to attribute a measured level |
Mitigation selection (barriers, quiet pavements, traffic management [16-18]) | Mapped or predicted exposure | Identify fleet composition before choosing a measure |
For control, the cause of an elevated level must be identified before a measure is selected. Barriers, quiet pavements, speed management and traffic restraint act on different parts of the source-path system [16-18]: a barrier or a quiet pavement cannot compensate for an increase produced by a larger share of heavy vehicles, and volume-based management cannot compensate for a composition effect. The results indicate that fleet composition most often distinguished one section-period from another: medium-vehicle flow was the strongest correlate and the largest within-section increase occurred where heavy-vehicle flow rose at night while total flow fell. The novelty here lies in that combination - a multi-city evidence base, an explicit uncertainty statement and a monitoring recommendation - rather than in a new prediction formula.
4.2. Implications for monitoring practice
The results support a modest extension of routine practice: records should retain vehicle counts disaggregated by class rather than a total volume, so that a measured level can be attributed to traffic volume, fleet composition or both. This requires no additional instrumentation and determines which mitigation measure is appropriate.
The uncertainty statement of Section 2.3 should accompany the measurement, so that differences below about 0.8 dB(A) are not reported as findings; the intervals and within-section differences measured here give realistic bounds for a survey of this size. Road class remains useful for stratification but is insufficient for explaining a specific measured level.
4.3. Limitations
The study is limited to 20 min records at selected Guangzhou sections and to descriptive statistics; it did not estimate causal emission coefficients, model propagation or residential exposure, and road-surface type, gradient, meteorology and driver behavior were not resolved. A transferable source model would require synchronized vehicle trajectories, other seasons and more road classes.
5. Conclusions
This field study characterized source-side urban road traffic noise at 25 road sections in Guangzhou, covering four road classes and three periods with 75 section-period observations from repeated 20 min measurements using Class 1 instrumentation. Levels ranged from 58.5 to 79.8 dB(A); arterial sections spanned 15.0 dB(A) and night-time measurements 21.3 dB(A).
Vehicle-class flow described the measured level better than average speed, medium-vehicle flow showing the strongest association ( 0.867, 95 % CI 0.797-0.914) followed by total flow ( 0.794); the intervals overlap, so the two are treated as equivalent descriptors. The expanded uncertainty of a single level (about 0.8 dB, 2) bounds the interpretable differences: the 2.6 dB(A) change accompanied by additional heavy vehicles exceeds it, whereas the 0.4 dB(A) change does not.
Source-side records should therefore combine with vehicle counts disaggregated by class and with a statement of measurement uncertainty, which links the operational description of urban road traffic noise to the mitigation decisions that noise mapping and control programmes have to make.
References
-
“Environmental noise guidelines for the European Region,” World Health Organization, Copenhagen, 2018.
-
M. Basner et al., “Auditory and non-auditory effects of noise on health,” The Lancet, Vol. 383, No. 9925, pp. 1325–1332, Oct. 2013, https://doi.org/10.1016/s0140-6736(13)61613-x
-
T. Munzel, T. Gori, W. Babisch, and M. Basner, “Cardiovascular effects of environmental noise exposure,” European Heart Journal, Vol. 35, No. 13, pp. 829–836, Apr. 2014, https://doi.org/10.1093/eurheartj/ehu030
-
H. M. E. Miedema and C. G. M. Oudshoorn, “Annoyance from transportation noise: relationships with exposure metrics DNL and DENL and their confidence intervals,” Environmental Health Perspectives, Vol. 109, No. 4, pp. 409–416, 2001, https://doi.org/10.1289/ehp.01109409
-
“Directive 2002/49/EC of the European Parliament and of the Council of 25 June 2002 relating to the assessment and management of environmental noise,” European Union law, Jul. 2002.
-
S. Kephalopoulos, M. Paviotti, F. Anfosso-Lédée, D. van Maercke, S. Shilton, and N. Jones, “Advances in the development of common noise assessment methods in Europe: the CNOSSOS-EU framework for strategic environmental noise mapping,” Science of the Total Environment, Vol. 482-483, pp. 400–410, Feb. 2014, https://doi.org/10.1016/j.scitotenv.2014.02.031
-
D. W. Morley et al., “International scale implementation of the CNOSSOS-EU road traffic noise prediction model for epidemiological studies,” Environmental Pollution, Vol. 206, pp. 332–341, Jul. 2015, https://doi.org/10.1016/j.envpol.2015.07.031
-
C. Steele, “A critical review of some traffic noise prediction models,” Applied Acoustics, Vol. 62, No. 3, pp. 271–287, Jul. 2002, https://doi.org/10.1016/s0003-682x(00)00030-x
-
N. Garg and S. Maji, “A critical review of principal traffic noise models: strategies and implications,” Environmental Impact Assessment Review, Vol. 46, pp. 68–81, Mar. 2014, https://doi.org/10.1016/j.eiar.2014.02.001
-
Technical guidelines for noise impact assessment: acoustic environment,” Ministry of Ecology, Environment of China, Beijing, HJ 2.4-2021, 2021.
-
“Environmental quality standard for noise,” Ministry of Environmental Protection of China, General Administration of Quality Supervision, Inspection and Quarantine of China, Beijing, GB 3096-2008, 2008.
-
C.-W. Law, C.-K. Lee, A. S.-W. Lui, M. K.-L. Yeung, and K.-C. Lam, “Advancement of three-dimensional noise mapping in Hong Kong,” Applied Acoustics, Vol. 72, No. 8, pp. 534–543, Mar. 2011, https://doi.org/10.1016/j.apacoust.2011.02.003
-
A. Can, L. Leclercq, J. Lelong, and J. Defrance, “Accounting for traffic dynamics improves noise assessment: experimental evidence,” Applied Acoustics, Vol. 70, No. 6, pp. 821–829, Nov. 2008, https://doi.org/10.1016/j.apacoust.2008.09.020
-
X. Lu, J. Kang, P. Zhu, J. Cai, F. Guo, and Y. Zhang, “Influence of urban road characteristics on traffic noise,” Transportation Research Part D: Transport and Environment, Vol. 75, pp. 136–155, Aug. 2019, https://doi.org/10.1016/j.trd.2019.08.026
-
B. Bodsworth and A. Lawrence, “The contribution of heavy vehicles to urban traffic noise,” Applied Acoustics, Vol. 11, No. 1, pp. 57–65, Mar. 2003, https://doi.org/10.1016/0003-682x(78)90021-x
-
F. G. Praticò and F. Anfosso-Lédée, “Trends and issues in mitigating traffic noise through quiet pavements,” Procedia – Social and Behavioral Sciences, Vol. 53, pp. 203–212, Nov. 2012, https://doi.org/10.1016/j.sbspro.2012.09.873
-
I. Ekici and H. Bougdah, “A review of research on environmental noise barriers,” Building Acoustics, Vol. 10, No. 4, pp. 289–323, Dec. 2003, https://doi.org/10.1260/135101003772776712
-
R. B. Ranpise and B. N. Tandel, “Urban road traffic noise monitoring, mapping, modelling, and mitigation: a thematic review,” Noise Mapping, Vol. 9, No. 1, pp. 48–66, Jan. 2022, https://doi.org/10.1515/noise-2022-0004
-
“Electroacoustics: sound level meters, part 1: specifications,” International Electrotechnical Commission, London, IEC 61672-1:2013, 2013, https://doi.org/10.3403/02850815
-
“Technical specifications for environmental noise monitoring: routine monitoring for urban environmental noise,” Ministry of Ecology, Environment of China, Beijing, HJ 640-2012, 2012.
-
“Electroacoustics: sound calibrators,” International Electrotechnical Commission, London, IEC 60942:2017, 2017, https://doi.org/10.3403/30326445u
-
“Acoustics: description, measurement and assessment of environmental noise, part 2: determination of sound pressure levels,” International Organization for Standardization, Geneva, ISO 1996-2:2017, 2017.
-
“Noise pollution prevention and control law of the People’s Republic of China,” Standing Committee of The National People’s. Congress Of China, Beijing, Presidential Order No. 104, 2021.
-
“Uncertainty of measurement, part 3: guide to the expression of uncertainty in measurement (GUM:1995),” International Organization for Standardization, Geneva, ISO/IEC Guide 98-3:2008, 2008.
About this article

Thanks for the support of Academic Specialty Group for Urban Sensing in Chinese Society of Urban Planning.
The datasets generated during and/or analyzed during the current study are available from the corresponding author on reasonable request.
The authors declare that they have no conflict of interest.

