Abstract
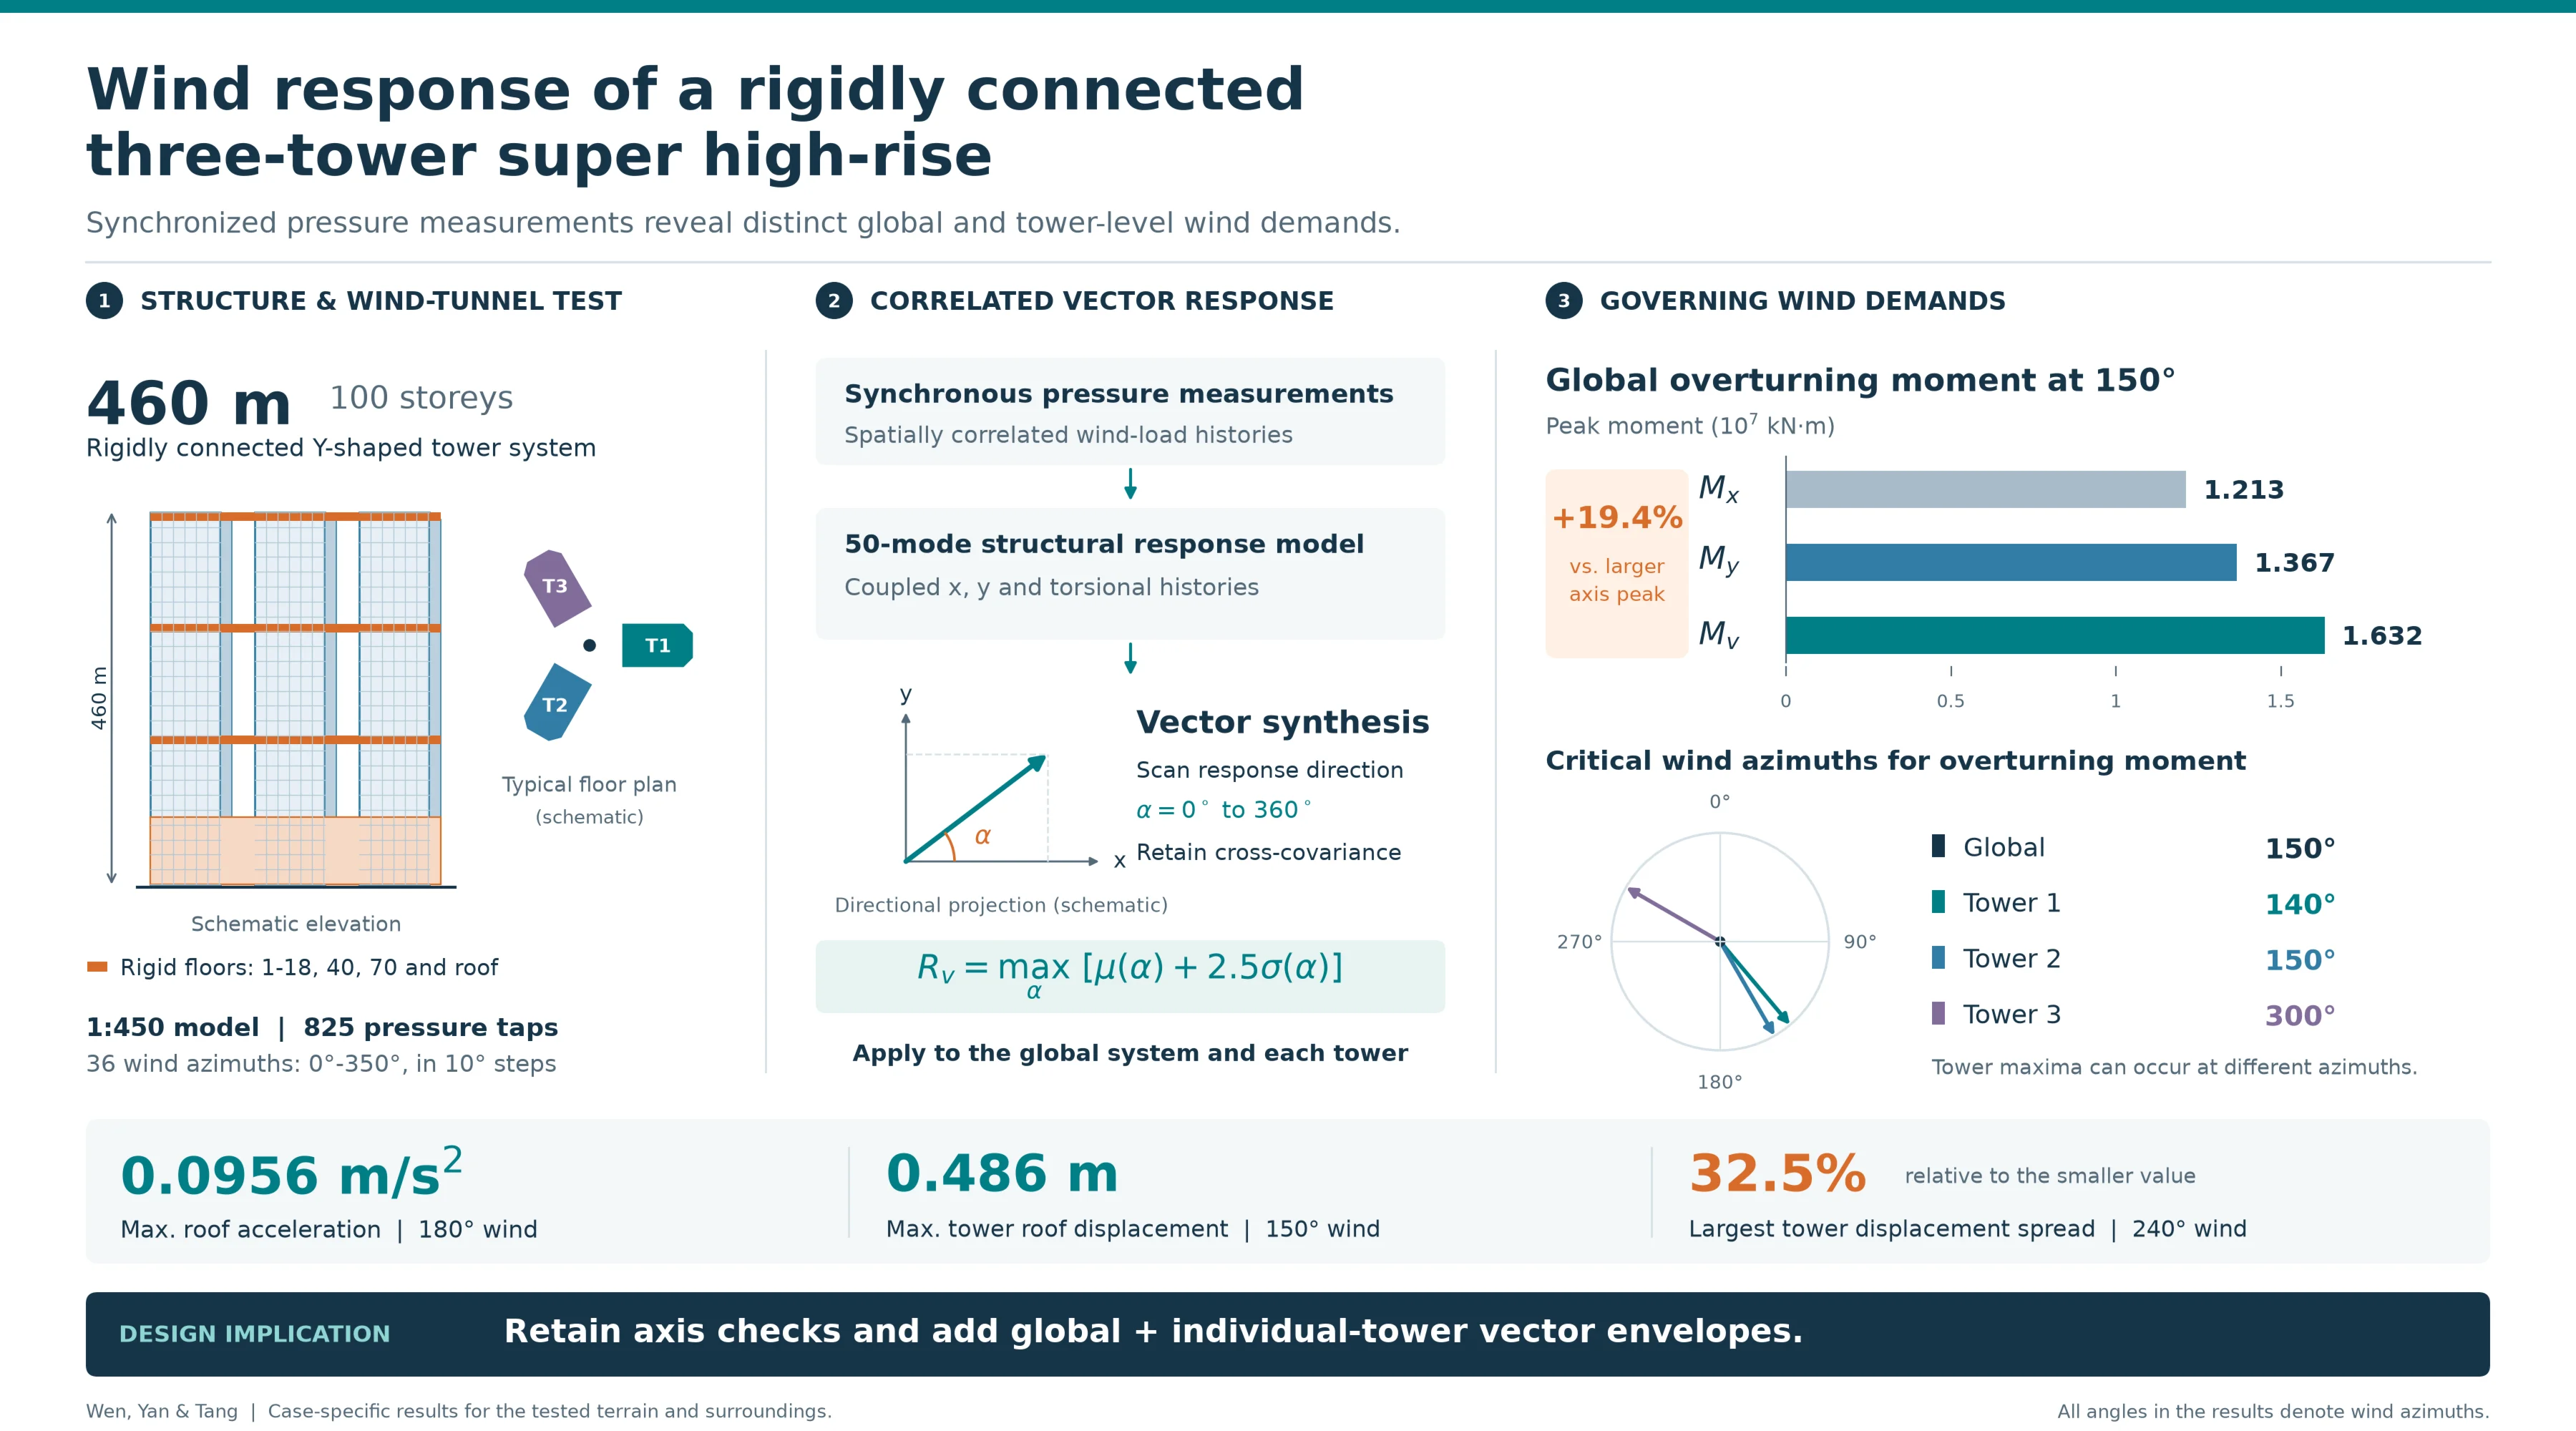
This study applies an established vector synthesis method (VSM) to a 460-m rigidly connected Y-shaped three-tower building. Synchronous-pressure measurement (SPM) data and a 50-mode model reconstruct correlated -, -, and torsional responses at the global and tower levels. The contribution is the matched tower-by-tower and global comparison, rather than a new peak-estimation theory. The maximum roof acceleration is 0.0956 m/s2 at 180°, the maximum tower displacement is 0.486 m, and the largest tower displacement spread is 32.5 %. The global peak overturning moment is 1.632×10⁷ kN·m at 150°, while the tower critical azimuths are 140°, 150°, and 300°. At the global critical azimuth, the vector moment exceeds the larger model-axis estimate by 19.4 %. The results support combined global and tower-level vector checks in design.
Highlights
- Synchronized pressure measurements and 50-mode analysis quantify global and tower-level vector responses of a 460-m rigidly connected Y-shaped three-tower building.
- The maximum roof acceleration is 0.0956 m/s² at a wind azimuth of 180°; tower-to-global acceleration response directions differ by up to 24.9° across the tested azimuths.
- The maximum tower roof displacement is 0.486 m; the largest tower-to-tower displacement spread is 32.5% at 240°, relative to the smaller response.
1. Introduction
Connected multi-tower high-rises offer flexible layouts but exhibit coupled wind response. Tests on linked twin towers and three-tower buildings show that connection stiffness, spacing, wake interaction, and load phase alter both system and tower responses [1, 2]. Recent studies quantify interference between twin towers, tapered skyscrapers, and neighboring tall buildings [3-5]. However, a matched tower-level and global vector-response comparison for a rigidly connected Y-shaped three-tower super high-rise remains limited.
Wind loads are commonly obtained by high-frequency force-balance (HFFB) or SPM tests. A single HFFB is best suited to a response dominated by a linear fundamental mode, whereas a connected multi-tower system may involve several lateral and torsional modes. SPM supplies simultaneous pressure histories that can be integrated into floor and generalized modal forces while retaining spatial correlation and higher-mode effects [6]. Modal coupling [7], wind-tunnel blockage [8], channeling, and wake interference [1, 3-5] are therefore relevant to this structure.
Code procedures generally check responses along prescribed structural axes [9, 10]. Here, the global axes and are the fixed horizontal axes of the complete structural model, with their origin at the global centroid; they are not wind directions. At any wind azimuth, the simultaneous - and -response components and torsion can rotate the critical resultant away from either axis. Resultant-response methods remove this coordinate dependence [11], and wind-tunnel studies confirm that resultant accelerations can exceed individual-axis estimates [12]. The VSM is therefore used consistently for the whole structure and each tower.
The novelty is a case-study-based methodological application supported by SPM testing: global and tower responses of a 460-m rigidly connected three-tower building are compared in magnitude, direction, critical azimuth, and correlation. Unlike earlier work centered on isolated buildings, linked twins, aerodynamic interference, or only global response, this study develops paired system- and tower-level design envelopes.
2. Building response in arbitrary direction as a vector
Let denote the response quantity under consideration (acceleration, displacement, shear, or moment). The analysis first gives simultaneous histories , , and along the fixed global and axes and about the vertical axis through the global centroid c, shown in Fig. 1. For a direction measured counterclockwise from +, the centroid projection is:
For a point l whose coordinates relative to are , the small-rotation kinematic relation gives:
Fig. 1Schematic of the point-response kinematics and directional projection
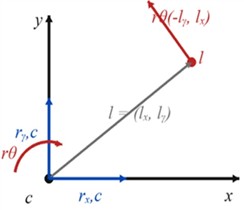
a) Plan kinematics
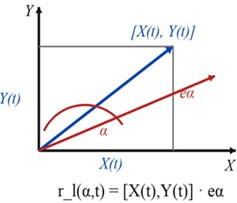
b) Directional projection
Define and . Their mean response projected onto is:
and the variance is:
were and are mean components; and are RMS fluctuating components; is covariance; and is the correlation coefficient. Because and include , Eq. (4) retains translation-torsion coupling.
The peak response in direction is estimated as:
The vector peak is the maximum of over 0°-360°, and is the direction at which that maximum occurs.
For acceleration, 0, so maximizing Eq. (6) is equivalent to maximizing Eq. (4). Setting 0 gives:
For every wind azimuth and every global or tower output location, the reconstructed histories provide , , , , and . Eq. (6) is then maximized over 0°-360°; Eq. (7) provides the corresponding closed-form check for zero-mean acceleration. The same algorithm is applied to acceleration, displacement, shear, and overturning moment.
A structural-response peak factor 2.5 is used in Eq. (6) [13]. The same factor is applied to projections from each synchronized record using the same duration and probability convention. Approximate stationarity and Gaussianity are engineering assumptions adopted for consistency with the design procedure. If directional bandwidth or non-Gaussianity differs markedly, direction-dependent factors or direct time-history extremes should be used.
3. Project description and wind-tunnel test
3.1. Project information
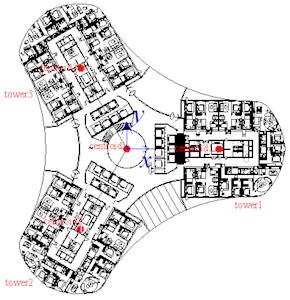
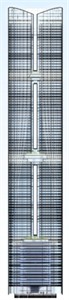
The prototype building has 100 storeys and a height of 460 m. It adopts a -shaped plan, with rigid connecting floors at storeys 1-18, 40, and 70 and at the roof. The maximum overall plan dimension is about 80 m, the minimum clear spacing between adjacent tower limbs is about 6 m, the overall aspect ratio is approximately 6, and the aspect ratio of each tower exceeds 10.
Fig. 2 defines the global coordinate system, global centroid, and tower centroids. Towers 1-3 are numbered clockwise. Fig. 2(a) shows a typical separated-tower floor, Fig. 2(b) a connecting floor, and Fig. 2(c) the elevation.
Fig. 2Floor layouts, elevation, coordinates, and wind azimuth
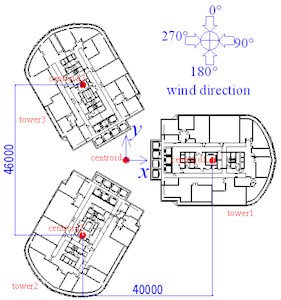
a) Typical separated-tower floor
b) Connecting floor
c) Elevation
3.2. SPM wind-tunnel test
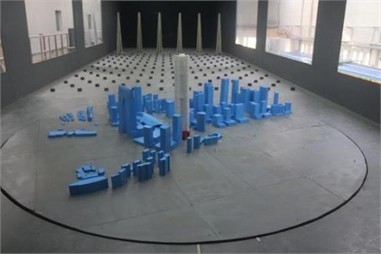
The SPM test used the 6.0 m×3.5 m×21 m low-speed section of the China Academy of Building Research boundary-layer wind tunnel. The 1:450 rigid model was mounted on a 6-m turntable and instrumented with 825 exterior pressure taps. A DSM4000 system sampled all taps simultaneously at 400.6 Hz for 30 s (approximately 12,018 samples per tap and azimuth). Wind profiles were measured independently by hot wire at 1 kHz for 15 s. Thirty-six azimuths from 0° to 350° at 10° intervals were tested.
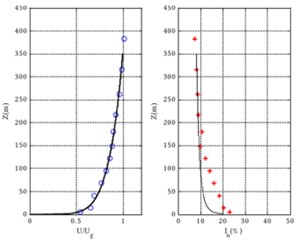
The tunnel reference speed at model roof height was 10 m/s. The 40°-140° sector used terrain B and the other sectors terrain C. Spires and floor roughness reproduced the target mean-speed and turbulence-intensity profiles. As shown in Fig. 3(b), measured points closely follow the target curves over the building height; the adopted mean-speed power-law exponents are 0.15 and 0.22 for terrains B and C, respectively, and the measured fluctuation spectrum followed the Davenport/Kármán target range. The 0.87 % target-building blockage ratio is sufficiently small. These checks demonstrate satisfactory incoming-flow simulation.
For tap , the measured record was stored as , where is the reference dynamic pressure at model roof height. The 10 m/s tunnel speed is distinct from the prototype basic wind speed: the design basic pressures of 0.45 and 0.35 kPa correspond to 26.8 and 23.7 m/s, respectively, using /1600. Exact Reynolds-number similarity was not satisfied; based on the 80-m prototype width, the model Reynolds number was approximately 1.2×10⁵. This is acceptable for the present sharp-edged polygonal model because separation points are fixed and the simulated approach flow is turbulent. Prototype pressure histories were obtained from , the design dynamic pressure and velocity profile, with time scale . Mean and zero-mean fluctuating components were processed separately.
Fig. 3Wind-tunnel model and validation of the simulated wind field: a) Pressure model and surroundings in the Wind Tunnel Laboratory of the China Academy of Building Research, Beijing, China; b), c) Measured mean-speed and turbulence-intensity profiles
a) Pressure model and surroundings
b) Terrain B. Measured mean-speed and turbulence-intensity profiles (symbols: measurements; curves: targets)
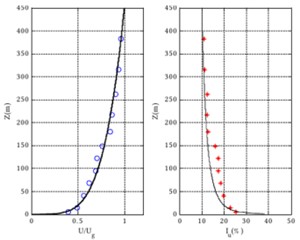
c) Terrain C. Measured mean-speed and turbulence-intensity profiles (symbols: measurements; curves: targets)
3.3. Structural dynamic model and pressure-to-response analysis
The structural model was reduced to a serial multi-mass system at the diaphragm levels. Each mass level retained two horizontal translations and rotation about the vertical reference axis. The supplied mode shapes were mass-normalized, and the first 50 modes were included; their frequencies ranged from 0.1147 to 2.6756 Hz. The first two modes are a coupled lateral pair, the third is predominantly torsional, and higher lateral and torsional modes are retained. At 50 modes, the cumulative participating-mass ratios are 94.66 % in X, 94.79 % in , and 95.66 % for rotation about . Damping ratios of 1 % and 3 % are used for acceleration and strength/deformation responses, respectively. The 50-year basic wind pressure is 0.45 kPa for strength and deformation checks, and the 10-year value used in this paper is 0.35 kPa for acceleration checks.
At each azimuth, the 825×12,018 measured matrix was converted to prototype tap forces using tributary areas and surface normals. Diaphragm forces , , and were mapped to , where is the th mass-normalized mode, is the synchronized tap-force vector, and maps forces to structural DOFs. Modal equations were solved by frequency-response functions and inverse FFT; synchronization preserves -–torsion cross-covariance. For all structural-response plots, including Fig. 4-6, the extreme is at each azimuth. The 3.5 factor in the test report applies only to local cladding-pressure extremes.
Table 1Principal modal parameters of the no-basement structural model
Mode | (Hz) | UX | UY | RZ | Mode type |
1 | 8.7197 / 0.1147 | 0.1516 | 0.4332 | 0.00005 | First lateral |
2 | 8.7086 / 0.1148 | 0.4312 | 0.1517 | 0.00008 | Orthogonal first lateral |
3 | 7.0630 / 0.1416 | 0.00001 | 0.00007 | 0.66475 | Dominant torsion |
4 | 2.8317 / 0.3531 | 0.00008 | 0.00026 | 0.13014 | Higher torsion |
5 | 2.6029 / 0.3842 | 0.0384 | 0.1369 | 0.00002 | Second lateral |
6 | 2.5897 / 0.3861 | 0.1359 | 0.0387 | 0.00022 | Orthogonal second lateral |
Σ1-50 | – | 0.9466 | 0.9479 | 0.9566 | Cumulative |
4. Results and discussion
4.1. Acceleration
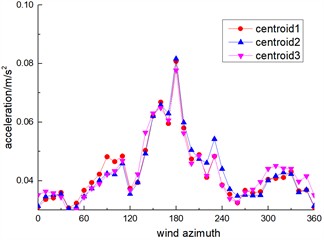
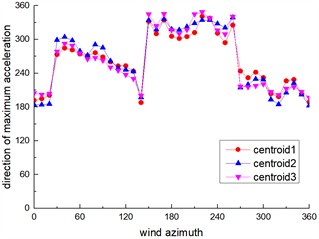
Figs. 4(a) and 5(a) show the acceleration magnitudes at the roof and at the 90th-floor separated tower segments. The critical azimuth is 180°. At the roof, the global centroid acceleration is 0.0889 m/s², and the Tower 1-3 values are 0.0937, 0.0956, and 0.0891 m/s2, respectively; thus the maximum value is 0.0956 m/s2. The magnitudes are close, confirming effective global coupling, but the response directions differ. At 180°, the global response angle is 314.34°, while the Tower 1-3 angles are 303.75°, 318.81°, and 317.47°. The Tower 1–global offset is therefore 10.59°, and the maximum angular spread among the three towers at this critical azimuth is 15.06°. Across all azimuths, the largest tower-to-global directional deviation is 24.90° (Tower 1 at 270°). The vector plots also show that cross-wind response can make a substantial contribution and dominates the resultant acceleration near the 90° wind azimuth.
Fig. 4Global and tower-centroid vector acceleration responses at the roof (T1-T3: Towers 1-3)
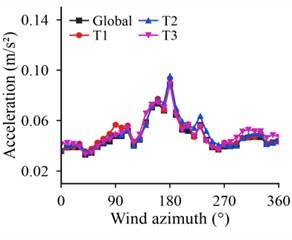
a) Vector peak magnitude
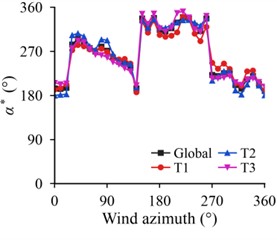
b) Response angle
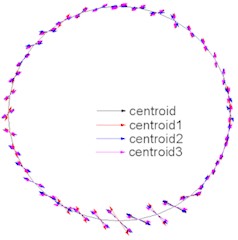
c) Response vectors
4.2. Displacement
Unlike acceleration, displacement contains a mean component, so its resultant direction spans 0°-360°. The maximum global roof displacement is 0.4643 m at 150°, and the maximum tower value is 0.4861 m for Tower 2 at the same azimuth. At 60°, Tower 1 and Tower 3 displacements are 0.4026 and 0.3143 m; their difference is 28.1 % relative to the smaller value, which explains the approximately 30 % difference noted in the original manuscript. Considering any tower pair over all tested azimuths, the largest spread is 32.5 % at 240° (Tower 2: 0.4236 m; Tower 3: 0.3198 m). These differences arise mainly from unequal mean wind-load distribution, while the response angles vary smoothly with azimuth.
Fig. 5Vector acceleration responses at the 90th-floor separated tower segments
a) Vector peak magnitude
b) Response angle
Fig. 6Global and tower-centroid vector displacement responses at the roof
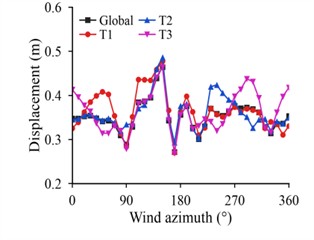
a) Vector peak magnitude
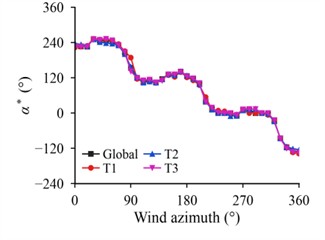
b) Response angle
4.3. Overturning moment
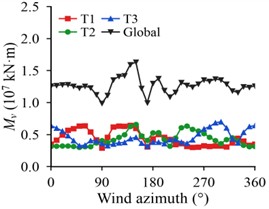
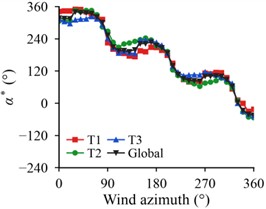
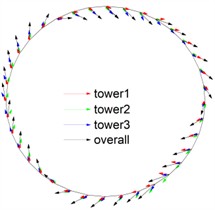
Fig. 7 presents the extreme overturning moments, their response angles, and the corresponding vectors. The maximum global vector moment is 1.632×10⁷ kN·m at 150°. The maximum tower-level moments are 6.450×10⁶ kN·m for Tower 1 at 140°, 6.608×10⁶ kN·m for Tower 2 at 150°, and 7.016×10⁶ kN·m for Tower 3 at 300°. Thus, the controlling azimuth of an individual tower need not coincide with the global controlling azimuth. The maximum tower-to-global moment-direction deviations are approximately 29.93°, 31.98°, and 29.96° for Towers 1-3, respectively. The vector distribution confirms that the controlling load is a correlated combination of the two horizontal components rather than a purely along-wind action.
Fig. 7Global and tower-level vector overturning moments Mv and their response directions
a) Vector peak magnitude
b) Response angle
c) Response vectors
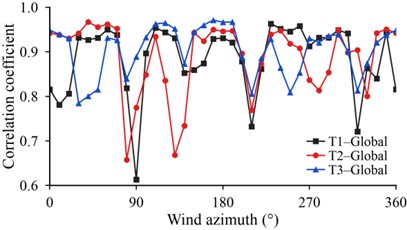
The global moment is the correlated superposition of the tower-level contributions, whose relative importance changes with azimuth. Fig. 8 shows tower-to-global correlation coefficients ranging from 0.613 to 0.963 for Tower 1, 0.658 to 0.967 for Tower 2, and 0.785 to 0.971 for Tower 3. The high but nonuniform correlations explain why the global maximum can occur at a different wind direction from a tower maximum. Therefore, the design envelope should include both the global vector moment and separate tower-level vector moments at their own critical azimuths.
Fig. 8Tower-to-global overturning-moment correlation coefficients versus wind azimuth
4.4. Comparison between vector and uniaxial responses
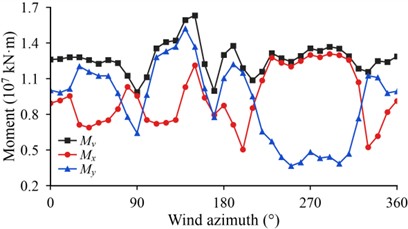
Fig. 9 compares the extreme resultant vector moment with the peak moments evaluated along the two global axes. Relative to the larger uniaxial component at each azimuth, is 2.60 %-29.36 % larger. At the global critical azimuth of 150°, 1.632×10⁷ kN·m, while = 1.213×10⁷ kN·m and 1.367×10⁷ kN·m; the vector estimate is therefore 19.39 % larger than the greater uniaxial value. The difference results from the correlation among the , , and torsional components and demonstrates that checks restricted to the model axes can be nonconservative.
Fig. 9Global vector peak moment Mv and uniaxial peak moments Mx and Mγ along the model axes
5. Conclusions
An established vector synthesis method has been applied to synchronized pressure measurements for a rigidly connected -shaped three-tower super high-rise. The contribution is the direct comparison of system-level and tower-level response magnitudes, directions, critical azimuths, and correlations. The following conclusions are drawn:
1) The connected system exhibits strong coupling among the towers. The maximum roof acceleration is 0.0956 m/s2 at 180°, but the tower response directions differ: the maximum tower-to-global deviation is 24.9°, and the deviation of Tower 1 at the acceleration-critical azimuth is 10.6°.
2) The maximum tower roof displacement is 0.486 m. The Tower 1-Tower 3 difference at 60° is 28.1 %, and the maximum spread between any two towers is 32.5 % at 240°, showing that mean wind-load imbalance remains important despite rigid connection.
3) The global peak overturning moment is 1.632×10⁷ kN·m at 150°, whereas the critical tower azimuths are 140°, 150°, and 300°. Tower-to-global correlations are high but azimuth-dependent, so a global check alone does not capture every tower’s governing response.
4) The vector moment exceeds the larger model-axis estimate by 2.6 %-29.4 % and by 19.4 % at the global critical azimuth. For design, conventional code-axis checks should be retained and supplemented by: (i) a global vector envelope over all wind azimuths; (ii) a separate vector envelope for each tower; and (iii) transfer of every governing tower case through the shared connecting floors and foundation system. The additional checks may be particularly relevant to asymmetric multi-tower plans, narrow gaps, rigid or irregular connectors, substantial torsional participation, or differing tower and global critical directions. The governing combined envelopes should be used for member strength, foundation actions, drift, and acceleration serviceability.
These findings are specific to one Y-shaped, rigidly connected three-tower project under the tested terrain and surrounding conditions; generalization requires case-specific assessment.
References
-
S. Ke, H. Wang, and Y. Ge, “Wind load effects and equivalent static wind loads of three-tower connected tall buildings based on wind tunnel tests,” (in Korean), Structural Engineering and Mechanics, Vol. 58, No. 6, pp. 967–988, 2016, https://doi.org/10.12989/sem.2016.58.6.967
-
J. Song and K. T. Tse, “Dynamic characteristics of wind-excited linked twin buildings based on a 3-dimensional analytical model,” Engineering Structures, Vol. 79, pp. 169–181, Aug. 2014, https://doi.org/10.1016/j.engstruct.2014.08.015
-
W.-F. Qin, J.-Y. Shi, X. Yang, J. Xie, and S. Zuo, “Characteristics of wind loads on twin-tower structure in comparison with single tower,” Engineering Structures, Vol. 251, p. 112780, Nov. 2021, https://doi.org/10.1016/j.engstruct.2021.112780
-
X. Li and Q. S. Li, “Wind-induced interference effects between twin tapered skyscrapers,” The Structural Design of Tall and Special Buildings, Vol. 28, No. 6, p. e1594, 2019, https://doi.org/10.1002/tal.1594
-
Y. Quan, J. Chen, and M. Gu, “Aerodynamic interference effects of a proposed taller high-rise building on wind pressures on existing tall buildings,” The Structural Design of Tall and Special Buildings, Vol. 29, No. 4, p. e1703, 2020, https://doi.org/10.1002/tal.1703
-
W. Kim, Y. Tamura, and A. Yoshida, “Interference effects on local peak pressures between two buildings,” Journal of Wind Engineering and Industrial Aerodynamics, Vol. 99, No. 5, pp. 584–600, Apr. 2011, https://doi.org/10.1016/j.jweia.2011.02.007
-
C. Liu, Z. Xie, L. Zhang, and X. Yu, “Investigation on modal coupling-aeroelastic effect of a super tall building by MDOF aeroelastic model test,” Journal of Wind Engineering and Industrial Aerodynamics, Vol. 231, p. 105248, Nov. 2022, https://doi.org/10.1016/j.jweia.2022.105248
-
L. Wang, F. Shi, Z. Wang, and S. Liang, “Blockage effects in wind tunnel tests for tall buildings with surrounding buildings,” Applied Sciences, Vol. 12, No. 14, p. 7087, Jul. 2022, https://doi.org/10.3390/app12147087
-
“Technical specification for concrete structures of tall building,” China Architecture Publishing & Media Co., Beijing, 2011.
-
J. D. Holmes, “Along – and cross-wind response of a generic tall building: comparison of wind-tunnel data with codes and standards,” Journal of Wind Engineering and Industrial Aerodynamics, Vol. 132, pp. 136–141, Jul. 2014, https://doi.org/10.1016/j.jweia.2014.06.022
-
X. Chen and G. Huang, “Evaluation of peak resultant response for wind-excited tall buildings,” Engineering Structures, Vol. 31, No. 4, pp. 858–868, Jan. 2009, https://doi.org/10.1016/j.engstruct.2008.11.021
-
J. S. Love, Z. J. Taylor, and W. N. Yakymyk, “Determining the peak spatial and resultant accelerations of tall buildings tested in the wind tunnel,” Journal of Wind Engineering and Industrial Aerodynamics, Vol. 202, p. 104225, May 2020, https://doi.org/10.1016/j.jweia.2020.104225
-
A. Kareem and Y. Zhou, “Gust loading factor-past, present and future,” Journal of Wind Engineering and Industrial Aerodynamics, Vol. 91, No. 12-15, pp. 1301–1328, Oct. 2003, https://doi.org/10.1016/j.jweia.2003.09.003
About this article

The work described in this paper is supported by the research fund of China State Construction Engineering Corporation Technology Research and Development Plan Project (CSCEC-2024-Z-57). The financial support is gratefully acknowledged.
The datasets generated during and/or analyzed during the current study are available from the corresponding author on reasonable request.
The authors declare that they have no conflict of interest.

