Abstract
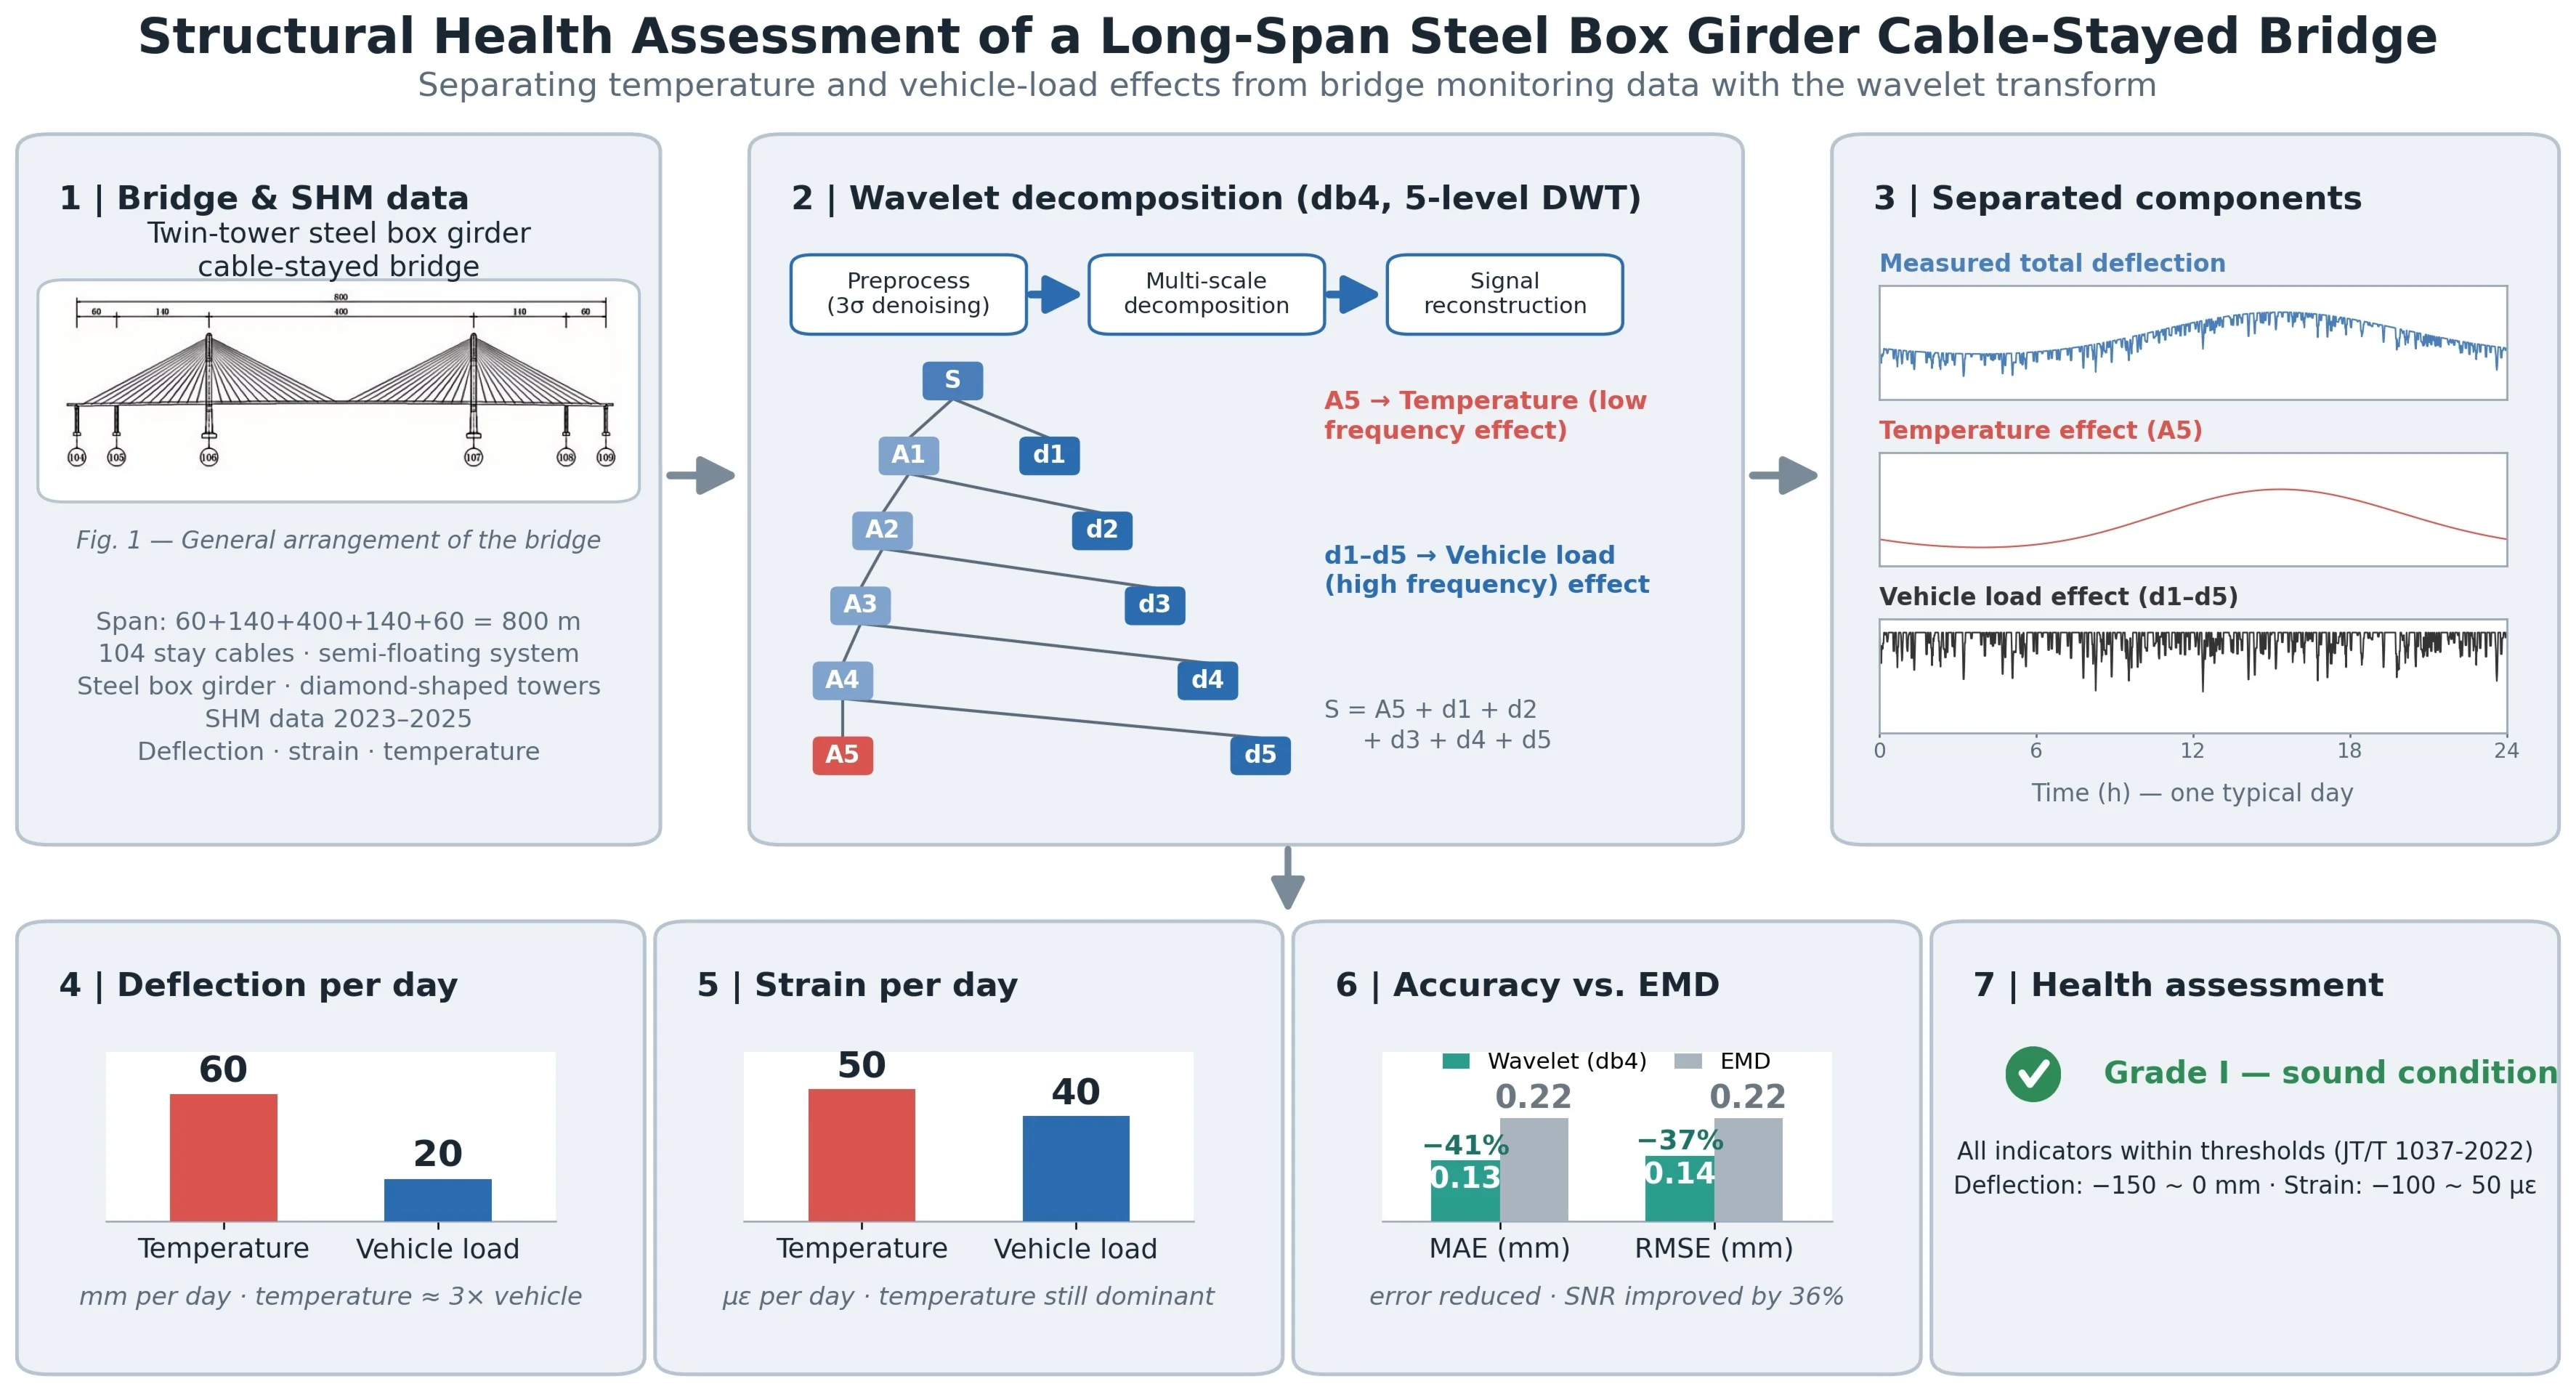
To evaluate the structural health condition of a long-span steel box girder cable-stayed bridge under complex environmental and traffic loading, this paper takes such a bridge as an engineering background. Based on the monitoring data from 2023 to 2025, the wavelet transform method is employed to separate the temperature effect and vehicle load effect from the deflection and strain monitoring data. The structural health condition of the bridge is systematically analyzed, thereby eliminating environmental interference from the structural health assessment. This study can provide both theoretical and practical references for the health monitoring of similar cable-stayed bridges.
Highlights
- The db4 wavelet with 5-level decomposition simultaneously separates temperature and vehicle load effects, breaking the limitation of traditional methods that address only a single effect or preprocessing.
- Based on long-term monitoring data from 2023 to 2025, integrating multi-source information of deflection, strain, and temperature, the bridge health grade is determined as Grade I, revealing that temperature effects dominate structural responses.
- For temperature effect separation, the MAE is 0.13 mm and the RMSE is 0.14 mm, which are 41% and 37% lower than those of EMD, respectively. Combined with code-specified threshold-based early warning, this provides a practical reference for health monitoring of similar bridges.
1. Introduction
Long-span cable-stayed bridges serve as critical hubs in transportation networks. During long-term service, their structural performance is subject to the coupled effects of multiple factors, such as temperature variations and vehicle loads [1]. Accurately identifying and separating the structural responses induced by different factors is a prerequisite for scientifically evaluating the service condition of bridges and formulating rational maintenance strategies. In recent years, structural health monitoring (SHM) systems have been widely deployed on cable-stayed bridges, generating massive amounts of field measurement data. How to effectively separate temperature effects from vehicle load effects in mixed signals that contain multiple physical phenomena, and how to carry out structural condition assessment based on multi-source information fusion, have become research hotspots in the bridge engineering community [2-5]. In the field of SHM signal processing, wavelet transform, owing to its time-frequency localization capability, has been extensively used for feature extraction and denoising of structural response signals. However, existing studies have mostly applied wavelet transform either to the separation of a single physical effect or to the preprocessing stage of monitoring data; research on the simultaneous separation and quantification of temperature effects and vehicle load effects remains relatively limited. In this context, taking a steel-box-girder cable-stayed bridge as the engineering background, this paper adopts the wavelet transform method to simultaneously separate and quantify the temperature and vehicle load effects, thereby providing methodological support for the interpretation of bridge health monitoring data after the exclusion of environmental disturbances, and offering a more scientific and rational decision-making reference for the operation, maintenance, and safety assessment of cable-stayed bridges.
2. Engineering background and monitoring parameters
2.1. Bridge background
This paper takes a twin-tower steel box girder cable-stayed bridge as the engineering background, with a span arrangement of 60 + 140 + 400 + 140 + 60 = 800 m. The entire bridge adopts a semi-floating structural system. The main girder consists of a flat streamlined steel box girder, and the bridge towers are of diamond-shaped concrete structures. The bridge is supported by a total of 104 stay cables. The general arrangement of the bridge is shown in Fig. 1.
Fig. 1Elevation view of the main bridge (unit: m)

2.2. Monitoring parameters
Intelligent monitoring of the bridge revealed that temperature effects are strongly correlated with deflection and strain responses. To accurately assess each response’s impact on bridge health and eliminate environmental interference, this study uses bridge deflection and strain data from 2023 to 2025 to investigate how the separated response data affect bridge health condition.
2.3. Threshold Setting
The early warning system, established per Technical Specification for Structural Monitoring of Highway Bridges (JT/T 1037-2022) [6], sets multi-level thresholds based on historical statistics, material allowable, simulation results, design values, and code limits. For girder deflection: Level 1 at 0.8×design; Level 2 at design value or >10 occurrences/month; Level 3 for continuous downward deflection (recommending full-bridge inspection). For girder strain: Level 2 when exceeding historical max or most unfavorable design value, with recommendations for crack inspection near sensors and special inspection of the sensor-attached component, respectively. For temperature (max/min, difference, gradient): Level 1 at design values; Level 2 at 1.2×design values (recommending serviceability inspection). Alerts are issued via computer graphics and SMS for timely response.
3. Monitoring data analysis methods
3.1. Wavelet transform method
Wavelet transform is a time-frequency analysis tool suitable for non-stationary signal processing. By decomposing a signal into components at different scales and frequencies, it can provide both time-domain and frequency-domain information simultaneously. In this study, the discrete wavelet transform (DWT) is employed to distinguish between the temperature effect and the live load effect. The structural response signal of the bridge can be regarded as the superposition of the temperature effect (low-frequency component) and the vehicle load effect (high-frequency component). By performing multi-scale decomposition using the discrete wavelet transform, the original signal can be reconstructed as:
where: denotes the approximation coefficients at level ; denotes the detail coefficients at position of level ; is the total number of wavelet decomposition levels; and is the length (i.e., the number of data points) of the detail coefficients at level j.
The db4 wavelet basis function is adopted for 5-level multi-scale decomposition of bridge response signals to match the singularity characteristics of traffic-load-induced responses. The approximation coefficients at level 5 (A5) correspond to the low-frequency temperature effect, while the superposition of detail coefficients d1-d5 corresponds to the high-frequency vehicle load effect. This decomposition scheme effectively differentiates diurnal temperature fluctuations from random vehicle-induced responses.
3.2. Data processing
First, data preprocessing is conducted, in which the raw data are denoised using the 3σ criterion to eliminate abnormal sensor jumps. Subsequently, an appropriate wavelet basis function is selected and a proper decomposition level is set; these are the two key factors for separating the temperature effect. Considering the distinct frequency characteristics of the information induced by temperature and live loads, wavelet analysis is employed to distinguish different frequency components, aiming to reveal the differential contributions of the two factors to the bridge structural response. The main separation procedure for the measured signals is illustrated in Fig. 2.
Fig. 2Wavelet-transform-based effect separation procedure

4. Monitoring data analysis and bridge health assessment
4.1. Deflection monitoring
The girder deflection is monitored by the connected pipe method, with an accuracy of 0.1 mm and a sampling frequency of 50 Hz. The deflection monitoring results at the midspan position of the main girder are shown in Fig. 3.
Fig. 3Variation curve of mid-span deflection of the main girder (unit: mm)

a) From 2023 to 2024
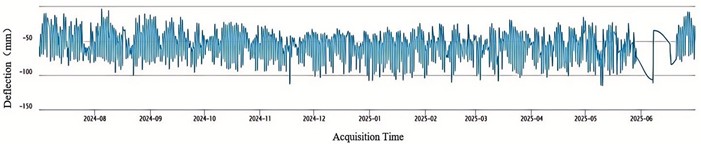
b) From 2024 to 2025
The above annual monitoring data indicate that the overall girder deflection fluctuates within the range of –150 mm to 0 mm, with relatively stable deflection variations at all measuring points and no continuous downward deflection observed. The deflections do not exceed the early warning thresholds of the monitoring system, the girder deformation remains within the allowable limits, and the bridge structure is in a healthy condition.
To further clarify the influence of the temperature effect on the deflection of the main girder, this paper adopts the wavelet transform method to extract and analyze the trend term from the above-mentioned daily monitoring data of deflection. The results are shown in Fig. 4.
Fig. 4Separated effect monitoring curves of main girder deflection (unit: mm)
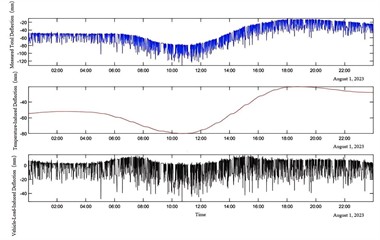
a) From 2023 to 2024
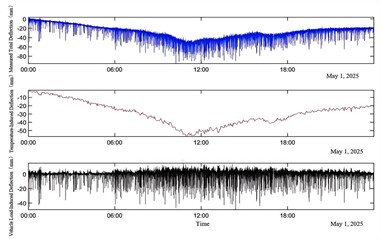
b) From 2024 to 2025
As shown in Fig. 4, the daily deflection variation induced by temperature effects is about 60 mm, while that caused by vehicle loads is about 20 mm, indicating that temperature effects dominate. Compared with empirical mode decomposition (EMD), the wavelet transform yields mean absolute error (MAE) of 0.13 mm and root mean square error (RMSE) of 0.14 mm for the temperature-effect component, versus 0.22 mm and 0.22 mm for EMD-reductions of 41 % and 37 %, respectively, and a signal noise ratio (SNR) improvement of 36 %. This demonstrates that the wavelet transform can effectively separate the two effects and eliminate disturbances in health monitoring data.
4.2. Strain monitoring
Structural strain can reflect the stress state of a bridge structure and serves as an important indicator for evaluating its structural safety performance. The mid-span strain monitoring data of the bridge girder are presented in Fig. 5, with a sampling frequency of 20 Hz.
Fig. 5Midspan strain curve of the main girder (unit: με)

a) From 2023 to 2024

b) From 2024 to 2025
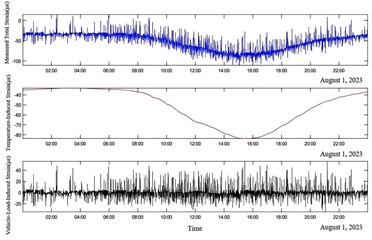
As shown in Fig. 5, the midspan strain of the main girder ranges from –100 με to 50 με, with a stable variation amplitude, indicating that the bridge itself has not suffered significant damage. To further clarify the influence of the temperature effect on the strain of the main girder, the above method is still adopted to extract and analyze the daily strain data.
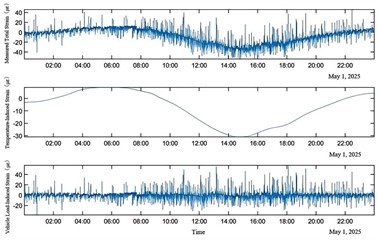
As shown in Fig. 6, the strain variation induced by the temperature effect within a single day is approximately 50 με, while the strain variation caused by vehicle loading is about 40 με. It can be seen that the influence of the temperature effect is still greater than that of the vehicle load effect. Similarly, the MAE and RMSE are used to evaluate the separation accuracy. The MAE and RMSE of the temperature component are 1.3 με and 1.7 με, respectively, indicating that the data are relatively stable with small deviations, further demonstrating the feasibility of the proposed method.
Fig. 6Separated effect monitoring curves of main girder strain (unit: με)
a) From 2023 to 2024
b) From 2024 to 2025
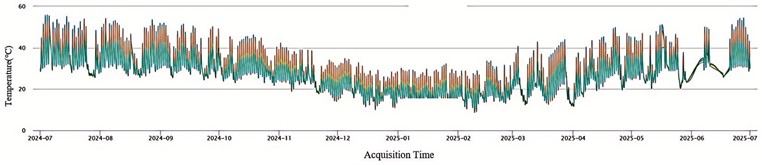
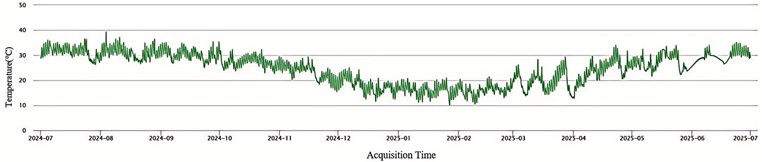
Fig. 7Girder cross-section temperature monitoring curve (unit: ℃)

a) Top plate (2023-2024)

b) Bottom plate (2023-2024)
c) Top plate (2024-2025)
d) Bottom plate (2024-2025)
4.3. Temperature monitoring
Temperature variations have a significant influence on the deformation and stress state of long-span bridge structures. Monitoring the temperature distribution of the bridge structure can provide a basis for calculating temperature effects in bridge design. The temperature monitoring results of the bridge in this study are shown in Fig. 7, with a sampling frequency of 0.02 Hz.
Fig. 7 shows transverse temperature variations in the top and bottom plates, lower at mid-width and higher at lane centers. During monitoring, the maximum/minimum temperatures were 54.6/2.9 °C in 2023-2024 and 55.8/8.6 °C in 2024-2025. In summer, monthly temperature fluctuations are pronounced, indicating a significant thermal gradient effect, whereas autumn and winter temperatures remain relatively stable.
In summary, according to the Technical Specification for “Structural Monitoring of Highway Bridges” (JT/T 1037-2022), the bridge structure is essentially in sound condition, with all monitored indicators not exceeding the design thresholds, and its health grade is classified as Grade I.
5. Conclusions
Based on 2023-2025 health monitoring data from a long-span steel-box-girder cable-stayed bridge, this paper analyzes deflection, strain, and temperature variations; separates temperature and vehicle load effects via wavelet transform; and establishes an effective intelligent bridge health monitoring system. The main conclusions are as follows:
1) Health assessment based on measured data indicates that the girder deflection fluctuates within the range of –150 mm to 0 mm, and the maximum compressive strain at the mid-span section ranges from –100 με to 50 με; both do not exceed the design thresholds. The comprehensive health grade is rated as Grade I, indicating that the bridge is in good health condition and can operate stably under current loading and environmental conditions.
2) The ambient temperature effect is significant. The wavelet-transformed results indicate that the deflection variation caused by daily temperature fluctuations can reach 60 mm (compared with about 20 mm induced by vehicle loads), and the strain variation can reach 50-60 με (compared with about 40 με induced by vehicle loads), suggesting that the temperature effect exerts a greater influence on structural responses than vehicle load effects.
3) The temperature monitoring results of the box girder indicate that in summer, the temperature data of the top and bottom plates exhibit pronounced fluctuations on a monthly cycle, with a significant thermal gradient effect, whereas the temperatures in autumn and winter remain relatively stable.
References
-
Y. C. Feng et al., “Research on dynamic performance and running safety of asymmetric multi-span extradosed cable-stayed bridges,” (in Chinese), China Railway, Vol. 2025, No. 12, pp. 49–59, 2025, https://doi.org/10.19549/j.issn.1001-683x.2024.12.07.002
-
X. M. Chen, “Data fusion analysis method for bridge structural health monitoring,” (in Chinese), China New Technologies and Products, Vol. 2026, No. 16, pp. 109–111, 2026, https://doi.org/10.13612/j.cnki.cntp.2026.16.008
-
M. M. Song et al., “Identification of natural frequencies of long-span bridges based on synchrosqueezed wavelet transform and smartphone sensors,” Journal of Southeast University (Natural Science Edition), Vol. 56, No. 4, pp. 523–529, 2026.
-
C. S. Hao et al., “Review on research and application of health monitoring technology for long-span railway bridges,” (in Chinese), Journal of Railway Science and Engineering, Vol. 22, No. 4, pp. 1662–1685, 2025, https://doi.org/10.19713/j.cnki.43-1423/u.t20241122
-
Z. L. Cai, “Research progress and development directions of data processing and analysis technologies for bridge health monitoring,” (in Chinese), World Bridges, Vol. 53, No. 3, pp. 102–110, 2025, https://doi.org/10.20052/j.issn.1671-7767.2025.03.015
-
“Technical specification for structural monitoring of highway bridges: JT/T 1037-2022,” China Communications Press Co., Ltd., Beijing, 2022.
About this article

The authors have not disclosed any funding.
The datasets generated during and/or analyzed during the current study are available from the corresponding author on reasonable request.
The authors declare that they have no conflict of interest.

