Abstract
A vibroacoustic coupling model of the 110 kV transformer tank is constructed by using the finite element method. The structural vibration response under 100 Hz and 200 Hz sound source excitation is analyzed. Radiated sound field characteristics and sound transmission loss performance across the 0-400 Hz frequency range are evaluated. Then, a test system is established to measure vibration response and sound transmission loss through experiments. Simulation analysis and experimental test results show that the average sound transmission loss of the 110 kV transformer tank ranges from 30 dB to 40 dB. The simulation calculation results show good agreements with experimental test results, which prove the correctness of the vibroacoustic coupling model of the 110 kV transformer tank.
Highlights
- A vibroacoustic coupling model of the 110 kV transformer tanks is constructed using the finite element method, addressing the challenge of quantifying vibration-acoustic radiation coupling mechanisms in complex transformer structures.
- Vibration responses under 100Hz and 200Hz excitations were analyzed to obtain vibration mode distributions on different walls and sound field radiation characteristics, clarifying radiation patterns and noise distribution features at these frequencies.
- Establishing an experimental system to measure vibration and STL, results matched simulations, validating the model. The study revealed STL variation patterns across 0–400 Hz, revealing low-frequency noise transmission mechanisms.
1. Introduction
Transformers are the primary noise sources in urban substations. The leading energy is distributed at the frequency points 100 Hz and its harmonics. The maximum values are usually at 100 Hz and 200 Hz, which are part of low-frequency noise. Due to the long propagation distance of low-frequency noise and the difficulty of engineering mitigation, the noise of transformers has become one of the primary noise pollution sources in cities [1].
When the transformer is in operation, the vibration of the iron core pushes the internal fluid, which acts on the transformer tank and radiates noise. In order to analyze the generation process of transformer noise, it is necessary to study the vibration characteristics of the transformer iron core, as well as the vibration and acoustic radiation characteristics of the transformer tank. The research on the characteristic vibration of transformers is relatively extensive [2]. Vibration and noise reduction of the transformer body is the shortest and most effective way to control transformer vibration and noise [3]. Analyzing transformer vibration and noise characteristics is a complex problem involving electromagnetic-mechanical-acoustics multi-physical field coupling [4, 5]. Regarding transformer vibration and noise forecasting methods, Bouayed et al. [6] established a sequentially-coupled multiphysics field analysis method and simulated the electromagnetic force under load conditions. Many scholars have also researched power transformer test methods [7, 8].
While there is relatively little research on transformer tank vibration and acoustic radiation. Large power transformers usually work in complex industrial environments. The acoustic signals are vulnerable to the interference of ambient noise and other equipment acoustic signals. The reflection and scattering of acoustic signals in the transmission process will also affect the accurate extraction of acoustic features. The above phenomena lead to the slow development of fault diagnosis technology based on voiceprint features [9]-[11]. A comprehensive study on the simulation of the acoustic-vibration coupling model of transformer tank and experimental testing is lacking.
Therefore, this paper takes the tank of a 110 kV transformer as the research object. Using the finite element method, an acoustic-vibration coupling model of the 110 kV transformer tank is established. The structural vibration response under the acoustic excitation of the transformer, the acoustic field radiation characteristics, and the sound transmission loss of the tank are analyzed. The vibration response and sound transmission loss of the 110 kV transformer tank under acoustic excitation are measured through experiments. By comparing the simulation results with the simulation results, the model's accuracy is verified, and the acoustic and vibration characteristics of the 110kV transformer are revealed.
2. Acoustic-vibration coupling model of 110 kV transformer tank
2.1. Model simplification
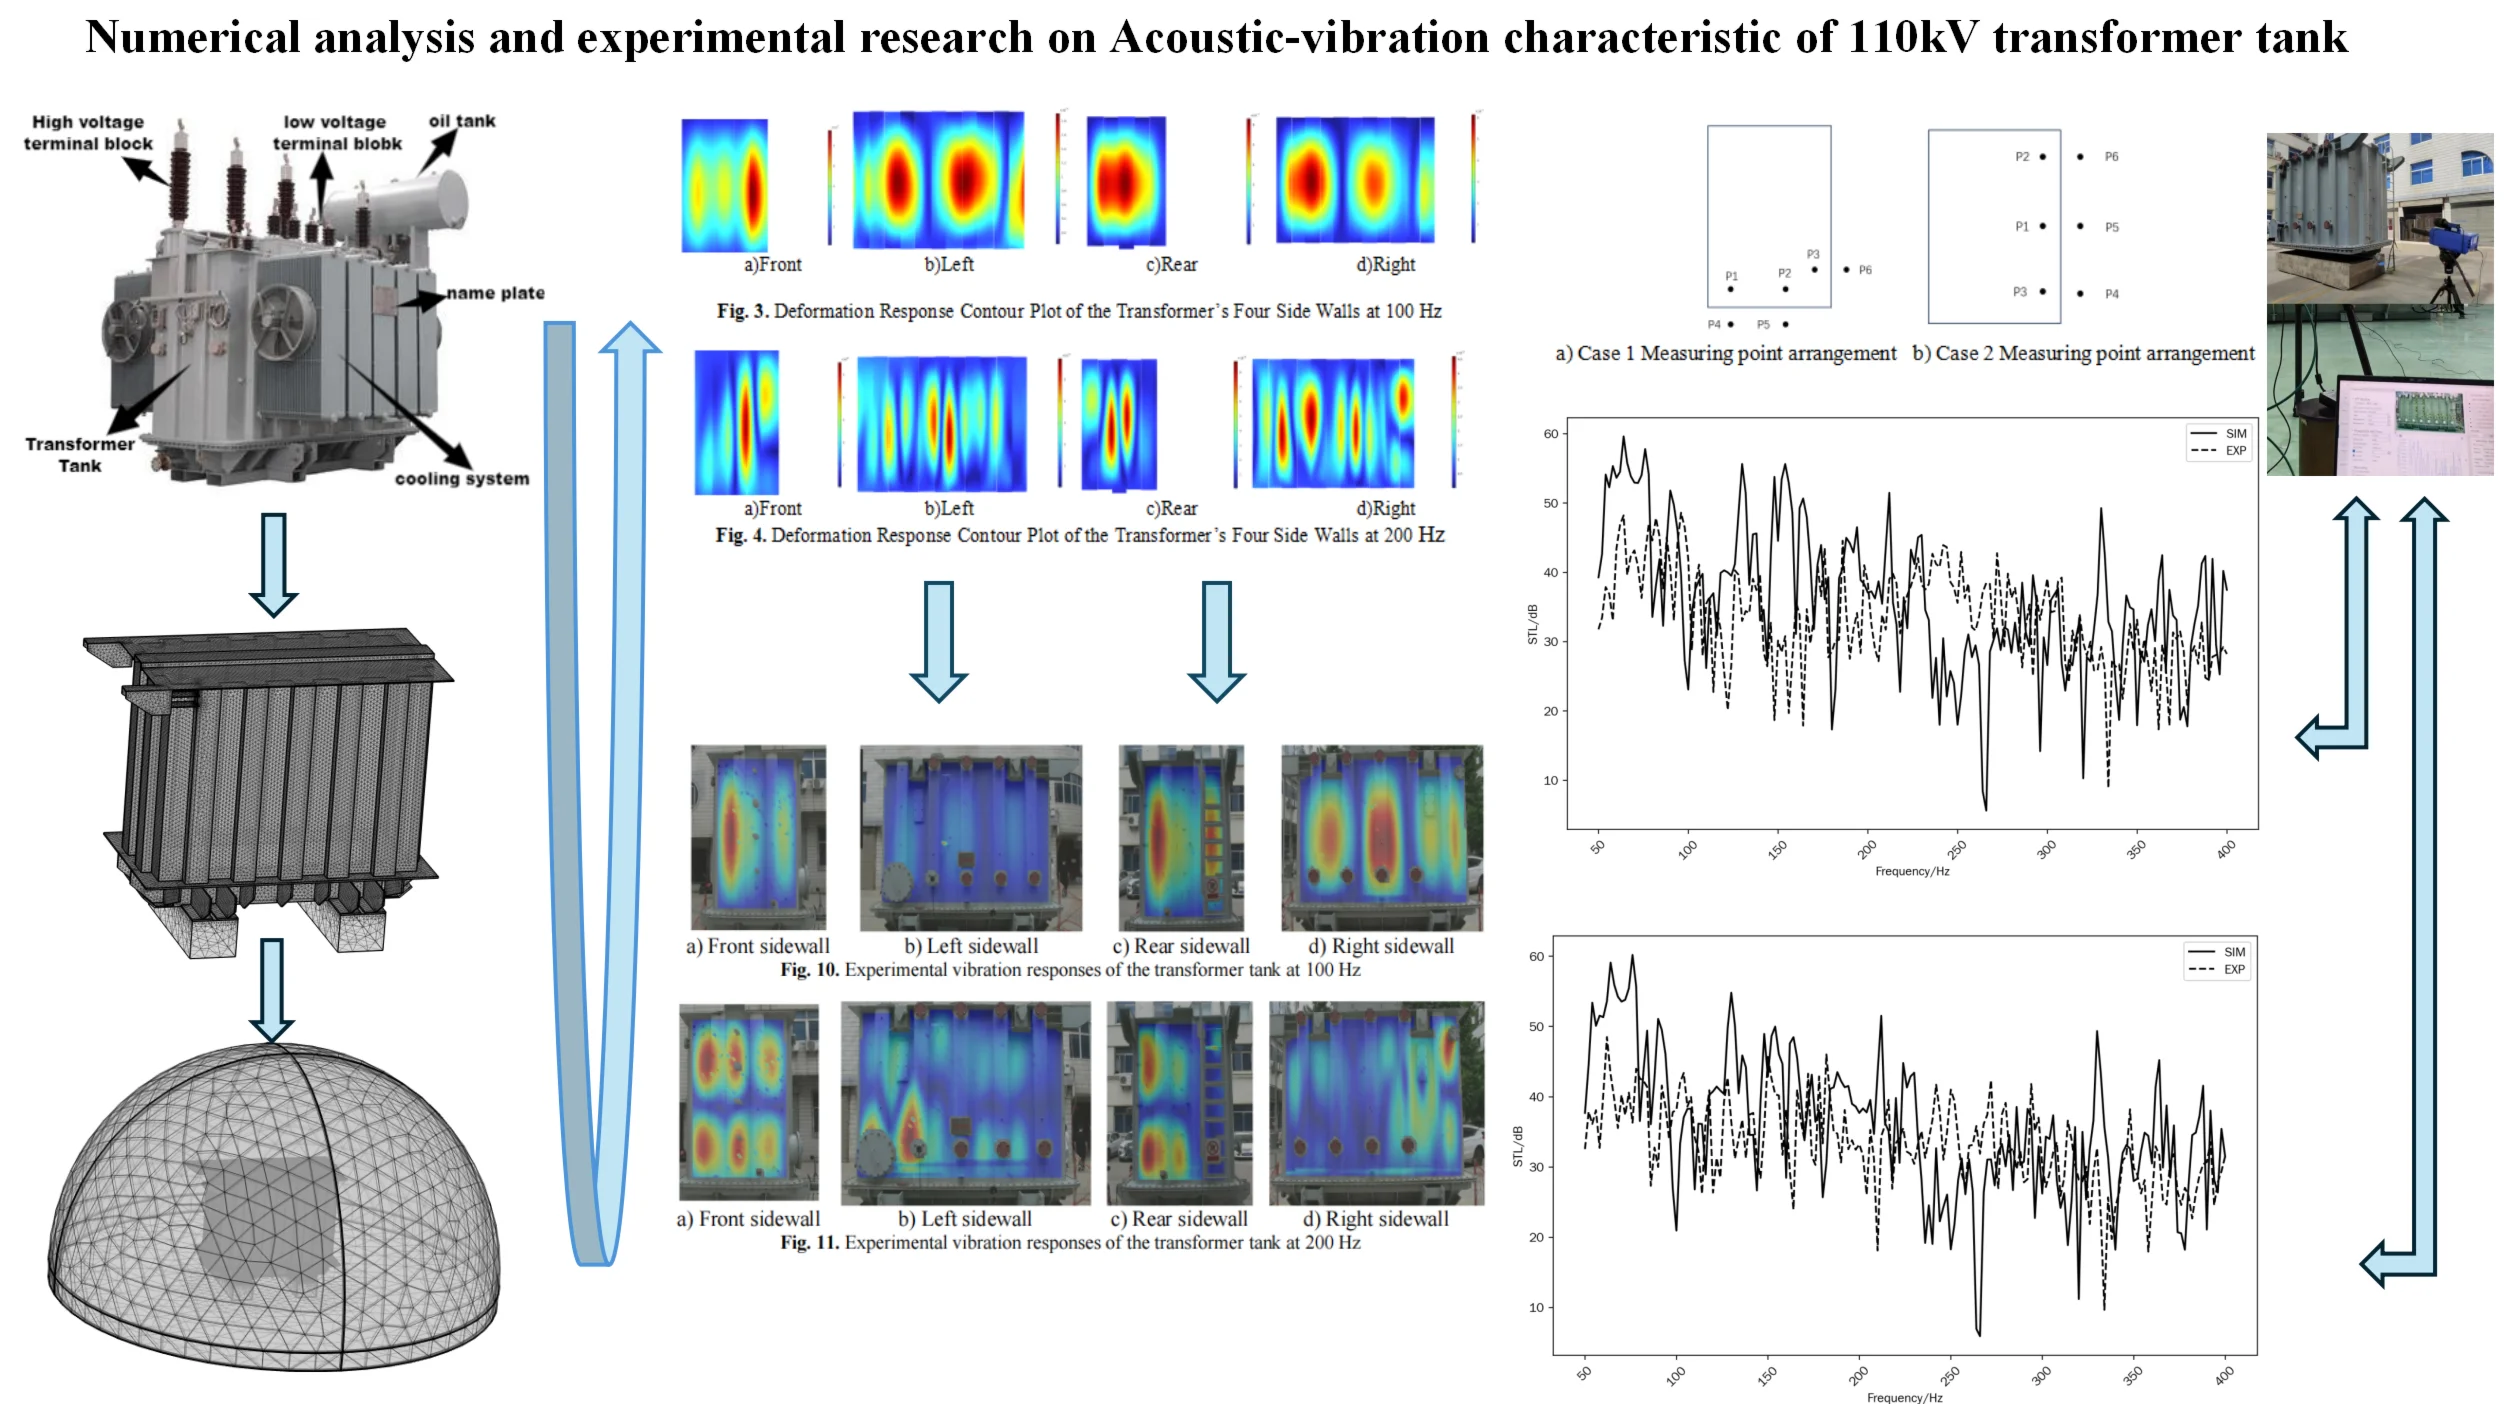
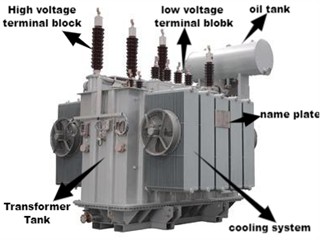
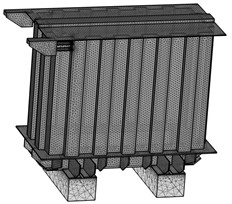
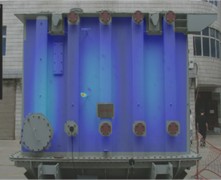
Fig. 1(a) shows a diagram of the transformer tank. Multiple high-voltage bushings are installed on its top. The main body box of the transformer is made of metal materials. The transformer in this study has a height of 2.4 m, a length of 3.5 m, and a width of 1.82 m. To ensure efficient and accurate simulation calculations, reasonable structural simplifications must be applied to the transformer model. As a complex electrical device, a transformer consists of numerous intricate components and complex geometries. If the simulation model were to replicate the actual transformer structure in full detail, the computational workload and resource demands would be immense, potentially exceeding the capabilities of current computing hardware. Therefore, to complete the simulation within an acceptable time while obtaining practically valuable results, careful structural simplification of the transformer model is required. First, minor structural details that have minimal impact on overall performance, such as small protrusions, holes, or decorative elements that do not affect key electrical and acoustic properties, can be omitted. Second, complex internal connection structures may also be simplified if their influence on critical performance parameters is negligible within the scope of the specific simulation objectives. Fig. 1(b) shows the simplified model. In practical applications, the transformer is placed on a concrete support structure. Therefore, the model should include the simplified transformer and the concrete support structure in the simulation.
Fig. 1The 110 Kv transformer tank
a) Real structure
b) The simplified model
2.2. Finite element model of 110kV transformer tank
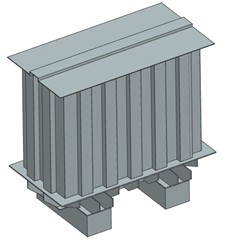
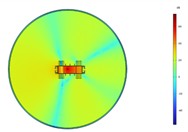
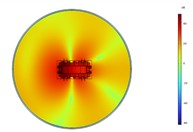
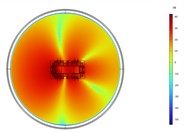
The simplified model is shown in Fig. 1(b), which is imported into finite element software. To simulate the acoustic response of the transformer in its actual environment, a hollow hemispherical acoustic domain is constructed with the geometric center of the transformer's base as the sphere center. The acoustic domain boundary is assigned a 0.1 m thick perfectly matched layer to minimize reflected waves in the simulation, thereby more accurately representing an infinitely distant acoustic field. A point sound source is placed at the center of the acoustic domain, with a sound pressure level of 1 Pa. The supporting base is modeled as cement, while the entire transformer structure is modeled as steel. The specific material parameters for both are provided in Table 1. The physical fields selected for the simulation include solid mechanics and pressure acoustics. A fixed constraint is applied to the bottom of the concrete support structure. The meshing strategy employs free tetrahedral elements, and the meshed models of the acoustic domain and transformer are shown in Fig. 2(a) and Fig. 2(b).
Table 1Material parameters
Material | Young’s modulus (Pa) | Density (kg/m3) | Poisson’s ratio |
Cement | 25E9 | 2300 | 0.2 |
Steel | 2.1E11 | 7890 | 0.3 |
Fig. 2Finite element model of the acoustic field
a) Finite element model of the acoustic field
b) Finite element model of the transformer
2.3. Simulated response of 110 kV transformer tank
2.3.1. Vibration response of 110kV transformer tank
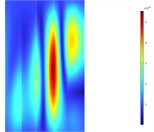
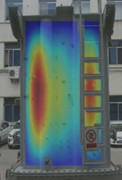
Since the main excitation frequencies of the transformer are harmonic excitations at 100 Hz and 200 Hz, the surface vibrations of the 110 kV transformer tank in the model are extracted at these two frequencies, as shown in Fig. 3 and Fig. 4. At the frequency of 100 Hz, the front wall panel structure of the transformer exhibits a response distribution of the (1, 3) vibration mode, the rear wall panel structure shows a response distribution of the (1, 1) vibration mode, and both the left and right wall panels have a response distribution of the (1, 2) vibration mode. Due to the corrugated structure of the wall panels, there is a local separation of responses, but it does not affect the overall distribution of the vibration characteristics. At the frequency of 200 Hz, the front wall panel of the transformer has a response distribution of the (1, 4) vibration mode, the rear wall panel has a response distribution of the (1, 2) vibration mode, and the left and right wall panels have a response distribution of the (1, 7) vibration mode. Considering the specific structural form of the transformer, it can be known that the corrugated structure of the transformer wall panels results in greater stiffness in the height direction and lower stiffness in the length and width directions. At 100 Hz and 200 Hz, the vibration response distributions of all four wall panels are in the form of (1, ).
2.3.2. Sound field distribution of 110kV transformer tank
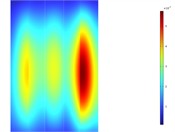
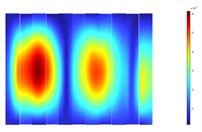
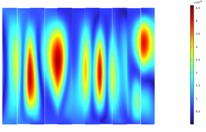
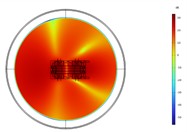
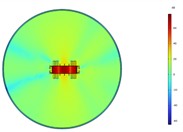
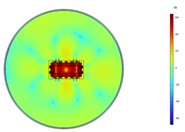
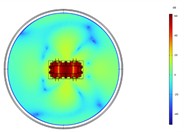
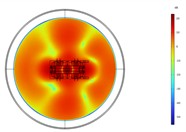
In order to analyze the spatial noise radiation of the transformer at the frequencies of 100 Hz and 200 Hz. By taking the ground of the transformer as the zero point of the height coordinate, the sound field distributions on the planes at 0 m, 1 m, 2 m, and 3 m are extracted, as shown in Fig. 5 and Fig. 6. At 100 Hz, the radiation characteristics of the entire transformer tank in the horizontal direction are approximately those of a quadrupole. The noise radiation capability of the rear end of the transformer is more potent than that of the front end. The highest noise level radiated at a height of 1 to 2 m. Combined with the vibration response distribution at 100 Hz, it is found that the acoustic radiation efficiency of the (1, 1) vibration mode of the rear tank of the transformer is higher than that of other modal vibration modes. Therefore, the noise at the transformer’s rear end is more potent than at the front.
Fig. 3Deformation response contour plot of the transformer’s four side walls at 100 Hz
a) Front
b) Left
c) Rear
d) Right
Fig. 4Deformation response contour plot of the transformer’s four side walls at 200 Hz
a) Front
b) Left
c) Rear
d) Right
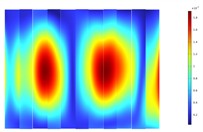
The structural response distribution is the largest in the middle, so the radiated noise reaches the highest level at a height of 1.2 m. At 200 Hz, the radiation characteristics of the entire transformer tank in the horizontal direction are approximately that of an octupole. The sound field is symmetrically distributed along the central axis. The entire sound field reaches its maximum value at a height of 1 m, while there is not much difference in the amplitude at different heights. Combined with the vibration response distribution at 200 Hz, it can be known that at the frequency of 200 Hz, the vibration response distributions of the front and rear wall panels of the transformer and those of the left and right wall panels are all similar. Therefore, its radiated sound field is symmetrically distributed. The vibration responses of the transformer's front, rear, left, and right wall panels reach the maximum at the center in the height direction, but the distribution is relatively uniform. As a result, the radiated noise of the transformer reaches the maximum at a height of 1 m, but there is not much difference in the noise level radiated at other heights.
Fig. 5Acoustic intensity field of the top-down cross section at different heights at 100 Hz
a) 0 m
b) 1 m
c) 2 m
d) 3 m
Fig. 6Acoustic intensity field of the top-down cross section at different heights at 200 Hz
a) 0 m
b) 1 m
c) 2 m
d) 3 m
2.3.3. Sound transmission loss of 110 kV transformer tank
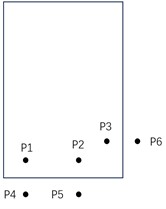
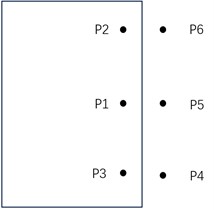
The sound transmission loss of the transformer model is obtained by comparing sound pressure inside the transformer with that outside the transformer. A point sound source with a sound pressure level of 1 Pa is placed at coordinates (1.5, 0.7, 0.4). The simulation data monitoring points are arranged on the front and left side of the transformer. At the front side of the transformer, the six monitoring points are selected at coordinates p1(3, 1, –0.5), p2(3, 0.3, –0.5), p3(2.7, 0.25, –0.5), p4(3.9, 1, –0.5), p5(3.9, 0.3, –0.5), and p6(2.7, –1.23, –0.5). They are marked as Case 1 of the simulation on the left side of the transformer; the other six monitoring points for Case 2 are selected at p3(2.7, 0.25, –0.5), p1(1.8, 0.25, –0.5), p2(0.8, 0.25, –0.5), p4(2.7, –1.23, –0.5), p5(1.8, –1.23, –0.5), and p6(0.8, –1.23, –0.5). Fig. 7(a) and Fig. 7(b) show the specific positions for both arrangements.
Fig. 7Test point arrangement of sound transmission loss measurement
a) Case 1 measuring point arrangement
b) Case 2 measuring point arrangement
The sound transmission loss (STL) can be calculated by the formula, which is shown below:
where is the sound pressure level at the location inside the transformer tank, and is the sound pressure level outside the transformer tank, both measured in decibels (dB). In the simulation, three symmetric measurement points were placed on the transformer walls' inner and outer sides. Therefore, the average sound pressure level measured at the outer points was subtracted by the average measured at the inner points, resulting in the transformer’s sound transmission loss.
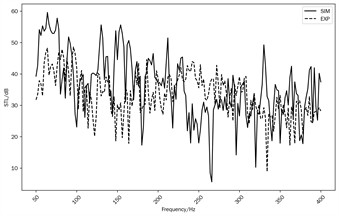
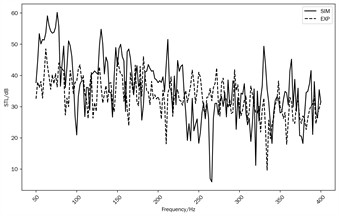
Fig. 8Simulate and Tested STL of the transformer front (case 1) and left (case 2) wall
a) Case 1
b) Case 2
Based on calculated sound pressure at selected points, the STL of the transformer front and left wall (Case 1 and Case 2) are obtained and plotted at the 50-400 Hz frequency range in Fig. 8(a) and Fig. 8(b). The average value of the STL curve in Cases 1 and 2 almost reaches 30-40 dB. The maximum value of the front wall STL nearly reaches 70 dB, and the maximum value of the left wall STL is close to 55 dB. STL of the front wall (Case 1) drops to the valley at a specific frequency range near 100 Hz and 200 Hz, and this is due to the high radiation efficiency of (1, 1) and (1, 2) mode shapes in the front wall of the transformer, which is plotted in Fig. 5 and Fig. 6. The acoustic pressure can make the front wall vibrate inside and radiate noise outside quickly at these frequencies. However, the valley value of the left wall STL is higher than that of the front wall STL, which is near 100 Hz and 200 Hz. It was found that the radiation efficiencies of (1, 4) and (1, 7) structural mode shapes are lower than those of (1, 1) and (1, 2) mode shapes. The acoustic energy quickly passes through the transformer wall by exciting the wall and reradiating.
3. Vibration response and sound transmission loss test of 110kV transformer tank
3.1. Vibration response measurement
3.1.1. Introduction of vibration test system
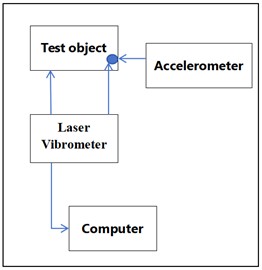
As shown in Fig. 9, this testing system is used for vibration measurement of oil-immersed power transformers. The specific process is as follows:
Taking the oil-immersed power transformer as the core testing object and the laser vibrometer as the key detection device, the laser is emitted towards the parts to be tested of the transformer, such as the iron core and winding tank, to collect vibration displacement data in real time. The system introduces a reference signal, which is used to calibrate the measurement reference and eliminate the influence of environmental interference and other factors on data accuracy. The laser vibrometer transmits the collected vibration signals to a computer. Relying on professional analysis software, parameters such as the amplitude, frequency, and phase of the transformer's vibration are analyzed. Through this system, the vibration characteristics of key components during the operation of oil-immersed power transformers can be accurately monitored, providing data support for equipment fault diagnosis, operation status assessment, and the formulation of vibration and noise control strategies, and ensuring the safety and stability of transformer operation.
Fig. 9Vibration test system
3.1.2. Vibration response test results
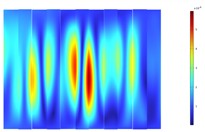
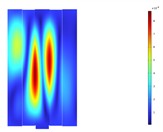
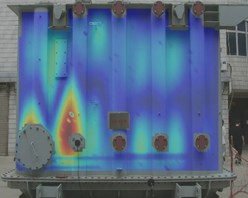
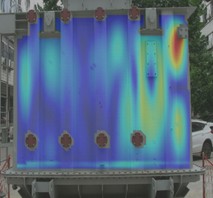
The experiment measured the deformation responses of the four sidewalls of the transformer under sound excitation at 100 Hz and 200 Hz. The measured deformation response cloud maps were compared with simulation results in Fig. 10 and Fig. 11. By comparing with the simulated results in Fig. 3 and Fig. 4, it can be seen that the experimental and simulation results align well. It indicates that our simulation model can accurately predict the deformation behavior of the transformer under low-frequency conditions. This agreement validates the simulation model's accuracy and provides strong support for the design and optimization of vibration reduction and noise control in the transformer. Although there is some discrepancy between the experimental data and simulation results, the error may stem from various factors, including but not limited to model simplifications, uncertainties in material parameters, boundary conditions and loading methods, measurement errors, and environmental factors.
Fig. 10Experimental vibration responses of the transformer tank at 100 Hz
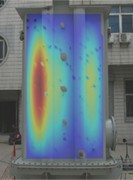
a) Front sidewall
b) Left sidewall
c) Rear sidewall
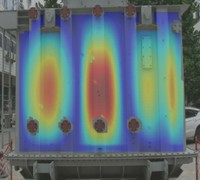
d) Right sidewall
Fig. 11Experimental vibration responses of the transformer tank at 200 Hz
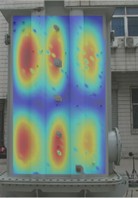
a) Front sidewall
b) Left sidewall
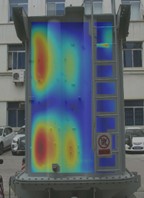
c) Rear sidewall
d) Right sidewall
3.2. Sound transmission loss measurement
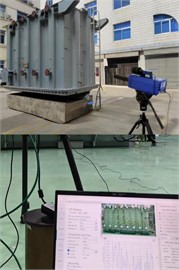
3.2.1. Introduction of sound transmission loss test system
Six measuring points were arranged inside and outside the transformer to test the sound transmission loss of the 110 kV transformer tank. Fig. 7(a) and Fig. 7(b) show the top-down schematic diagrams of two different layout configurations, Case 1 and Case 2, respectively. The rectangular box represents the top-down view of the transformer’s sidewalls, with P1 to P6 indicating the positions of the six test microphones. Case 1 measures the sound transmission loss of the transformer’s short side, and Case 2 measures the sound transmission loss of the transformer’s long side.
Fig. 12Actual photo of measuring point
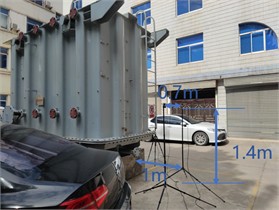
a) Case 1
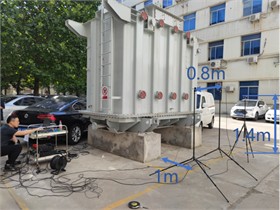
b) Case 2
The experimental test used a point sound source, During testing, the frequency was varied from 50 Hz to 400 Hz at a rate of 500 Hz/s.
3.2.2. Test results of sound transmission loss
Through the sound field test, the sound pressures at points P1-P6 inside and outside the front panel of the transformer under the Case 1 operating condition can be obtained. The Sound Transmission Loss (STL) of the front panel of the transformer can be calculated using Eq. (1). Under the case 2 operating condition, by measuring the sound pressures at points P1-P6 inside and outside the left panel of the transformer and combining them with Eq. (1), the STL of the left panel of the transformer can be obtained. The comparison between the measured STL curves in Case 1 and Case 2 and the simulation calculation results is shown in Fig. 8(a) and Fig. 8(b). The experimental and simulation results show good agreement with each other across most frequency ranges. The simulation model can predict the sound transmission loss of the transformer quite well. However, there are some differences between the simulated and tested results at unique frequencies, such as 0-50 Hz. It may be related to test error at low frequency and calculated error derived from model simplification. Moreover, the physical parameters used in simulations are typically theoretical values based on ideal conditions, which may differ from the actual material parameters. Furthermore, simulation software may not be able to fully and accurately simulate some complex physical phenomena, such as sound scattering, diffraction, and other effects at material interfaces.
4. Conclusions
In this paper, a finite element model of the acoustic vibration coupling of the 110 kV transformer tank is established. The vibration response, acoustic radiation characteristics, and sound transmission loss of the tank under the excitation of the sound source of the 110 kV transformer are analyzed. The vibration response and sound transmission loss of the 110 kV transformer are measured through experiments. The comparison between the experimental and simulation results verifies the correctness of the simulation model. The main conclusions are as follows:
1) At the frequency range of 0-400 Hz, the average sound transmission loss of the 110 kV transformer is 30-40 dB, and the maximum sound transmission loss is 55 dB.
2) At the frequencies of 100 Hz and 200 Hz, the sound transmission loss of the 110 kV transformer is relatively low, mainly due to its sizeable structural response and the secondary radiation noise.
3) At the frequency of 100 Hz, the radiated noise of the 110 kV transformer tank in the horizontal direction presents a quadrupole distribution; at the frequency of 200 Hz, the radiated noise of the 110 kV transformer tank in the horizontal direction presents an octupole distribution.
References
-
G.-Q. Di, X.-X. Zhou, and X.-W. Chen, “Annoyance response to low frequency noise with tonal components: A case study on transformer noise,” Applied Acoustics, Vol. 91, pp. 40–46, Apr. 2015, https://doi.org/10.1016/j.apacoust.2014.12.003
-
S. C. Ji, J. Cheng, and Y. M. Li, “Research on vibration characteristics of windings and core of oil-filled transformer,” Journal of Xi’an Jiaotong University, Vol. 39, No. 6, pp. 616–619, 2005.
-
X. A. Gu, R. Y. Shen, and J. Xu, “Trend of transformer noise research abroad,” (in Chinese), Transformer, Vol. 39, No. 6, pp. 33–38, 2002.
-
M. Ai, W. Liu, and Y. Shan, “Research on power transformer vibration and noise under DC bias condition,” International Journal of Applied Electromagnetics and Mechanics, Vol. 68, No. 3, pp. 371–385, Aug. 2022, https://doi.org/10.3233/jae-210159
-
C.-H. Hsu, J.-J. Liu, C.-M. Fu, Y.-M. Huang, C.-W. Chang, and S.-J. Cheng, “Suppressing magneto-mechanical vibrations and noise in magnetostriction variation for three-phase power transformers,” Journal of Applied Physics, Vol. 117, No. 17, p. 17D524, May 2015, https://doi.org/10.1063/1.4919040
-
K. Bouayed, L. Mebarek, V. Lanfranchi, J.-D. Chazot, R. Marechal, and M.-A. Hamdi, “Noise and vibration of a power transformer under an electrical excitation,” Applied Acoustics, Vol. 128, pp. 64–70, Dec. 2017, https://doi.org/10.1016/j.apacoust.2017.05.020
-
H. Qiang, N. Jingkai, Z. Songyang, X. Weimin, J. Shengchang, and C. Xin, “Study of transformer core vibration and noise generation mechanism induced by magnetostriction of grain‐oriented silicon steel sheet,” Shock and Vibration, Vol. 2021, No. 1, May 2021, https://doi.org/10.1155/2021/8850780
-
B. Zhang, N. Yan, J. Du, F. Han, and H. Wang, “A novel approach to investigate the core vibration in power transformers,” IEEE Transactions on Magnetics, Vol. 54, No. 11, pp. 1–4, Nov. 2018, https://doi.org/10.1109/tmag.2018.2839722
-
Z. Jianping and P. Xing, “Cause analysis of abnormal noise and vibration of 500 kV transformer,” Zhejiang Electric Power, Vol. 3, pp. 6–10, 2006.
-
S. Yuwei, L. Lingen, and C. Jingde, “Mechanical fault diagnosis of circuit breaker based on sound characteristics and improved sparse representation classification,” Power System Technology, Vol. 46, No. 3, pp. 1214–1222, 2022.
-
L. Wenbo, J. Weikang, and P. Siwei, “Mechanical fault diagnosis method based on texture features of near-field acoustic holography,” Journal of Vibration Engineering, Vol. 26, No. 4, pp. 617–623, 2013.
About this article

This work was financially supported by Science and Technology Project of State Grid Corporation of China (5500-202358515A-3-2-ZN).
The datasets generated during and/or analyzed during the current study are available from the corresponding author on reasonable request.
The authors declare that they have no conflict of interest.
