Abstract
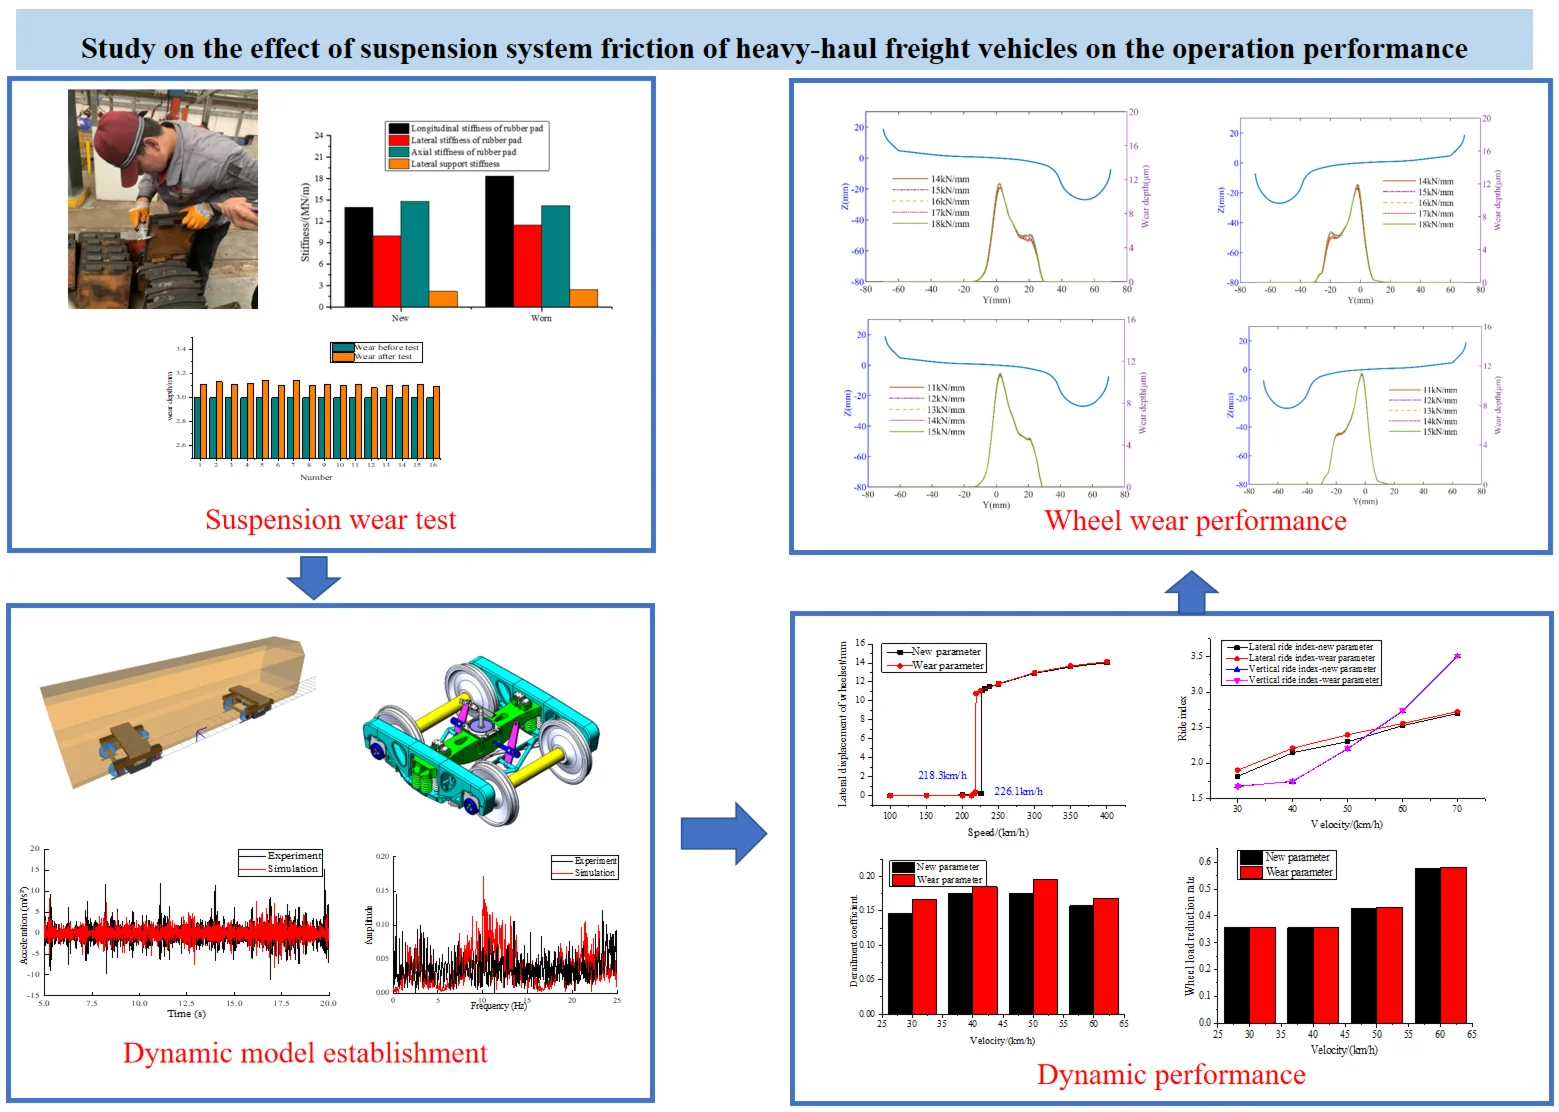
During the operational life of heavy-haul freight vehicles, the long-term wear between components can affect the suspension parameters. Suspension system wear has a significant effect on the dynamic performance and wheel wear. Experimental tests are performed to measure the changes in suspension system parameters after wear. A dynamic model and wheel wear model of the heavy-haul freight vehicles were established to analyze their dynamics and wheel wear performance. The results showed that with the wear of the suspension system, the stiffness parameters further increase. The dynamic performance of the vehicle system deteriorates after suspension system wear, with a decrease in the critical speed and an increase in safety and ride indexes. The analysis also reveals that the wheel wear increases as the stiffness parameters increase after the suspension system wear. This paper provides a basis for maintaining heavy-haul freight vehicle suspension systems.
Highlights
- Experimental tests are performed to measure the changes in suspension system parameters after wear.
- The influence of the wear suspension parameters on the dynamic performance was analyzed by the dynamic model.
- The wheel wear performance of the wear suspension parameters on was analyzed by the Jendel wear model.
1. Introduction
Heavy loading has become a common trend in freight transportation on railways. Heavy loading improves railway capacity. It also intensifies the interaction between wheels and rails, which leads to increased wear on the rail, damage and failure of bogies and track structures. This poses a severe challenge to the safe operational performance and operational life of heavy-haul freight vehicles and track structures. On the Daqin Line in China, where a 25-ton axle load is used for dedicated coal transportation, more than 95 % of the wagon wheels require re-profiling within 2 years. Wheel-rail wear severely limits the development of heavy haul transportation and even poses a risk to operational safety. Thus, it has become one of the core issues in heavy-haul freight vehicle technology research [1-3].
The issue of vehicle dynamics and wheel wear in railway freight cars has long been a concern, and scholars have been devoted to investigating vehicle dynamic performance in heavy-haul transportation systems. Sui et al. [4] analyzed wheel diameter difference based on experimental data and investigated its influence patterns on wheel wear. Wang et al. [5] developed a dynamic model of heavy-haul freight vehicles to study the effects of track parameters (rail cant, track gauge, and superelevation) on wheel wear. Hu et al. [6] established a heavy-haul freight vehicle dynamic model, primarily examining the influence of anti-warp stiffness on vehicle dynamics. Shvets et al. [7] constructed a heavy-haul freight vehicle dynamic model to analyze the impact of axle load increases on dynamic performance. Panchenko et al. [8] explored the wear patterns of brake shoes in heavy-haul freight vehicle and developed a predictive model to characterize their evolution mechanisms. Iwnick et al. [9] system elucidated the dynamic performance and current problems of heavy-haul freight vehicles and guided future development. Bruni et al. [10] established the suspension system models and analyzed the vehicle's dynamic performance. Millan et al. [11] used the multibody dynamics theory to finely model clearances and friction components in heavy-haul freight vehicles, which further enhanced the accuracy of the dynamic model. Kovalev et al. [12] conducted relevant research on dynamic modeling and computer-aided modeling for heavy-haul freight vehicles. Corrêa et al. [13] developed a dynamic model of heavy-haul freight vehicle, focused on analyzing dynamic performance under braking conditions, particularly investigating the dynamic evolution in curved track sections. Bernal et al. [14] established a dynamic model of heavy-haul freight vehicle and a wheel flat model, proposing a method to identify wheel flats using vibration acceleration signals. Sun et al. [15] constructed a heavy-haul freight vehicle container coupled dynamic model to study the dynamic response during braking scenarios. Corrêa et al. [16] developed a dynamic model of heavy-haul freight vehicle, primarily analyzed the effects of the primary suspension and wedge dampers on dynamic performance and wheel wear. Zhang et al. [17] established a coupled dynamic model and wear prediction model for heavy-duty trucks, investigating the evolution patterns of wheel wear through bench tests and track experiments. Zhang et al. [18] focused on studying the influence of braking conditions on wheel wear under the long steep gradients in heavy-haul freight vehicles. Fang et al. [19] analyzed the evolution mechanisms of flange wear on sharp-radius curves and evaluated the mitigation effects of wheel-rail lubrication on flange wear. Fröling et al. [20] investigated the effect of concave wheel wear profiles on dynamic performance, as well as conducted experimental validation.
Previous studies have predominantly focused on the effects of wheel wear evolution on vehicle dynamic performance, while investigations into suspension system wear remain relatively scarce. The degradation of suspension systems in heavy-haul freight vehicles can compromise stiffness and damping characteristics, leading to cascading impacts on both dynamic behavior and wheel wear patterns. Therefore, this paper systematically investigates the influence of suspension wear-induced degradation on vehicle dynamic performance and wheel wear mechanisms, specifically examining stiffness/damping deterioration thresholds and their coupled effects. This paper first analyzed the influence of measured suspension system wear on suspension parameters, then established a dynamic model for heavy-haul freight vehicles, and analyzed the effect of suspension system wear on dynamics. Finally, the wear model was used to explore the influence of suspension system wear on wheel wear in heavy-haul freight vehicles.
2. Measurement of the suspension system wear
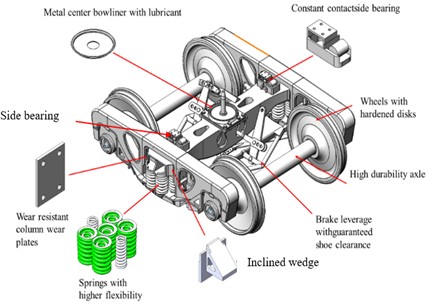
In the suspension system of heavy-haul freight vehicles, there are a large number of rubber components and wear parts. During operation, due to wear and nonlinear interactions, the suspension parameters may also change, such as the primary suspension stiffness along // axis, the vertical stiffness and the lateral stiffness of the center plate. To conduct a statistical analysis, the wear depth of different suspension systems is first measured. The wear limits of suspension components are of vital importance for maintenance during the maintenance process of heavy-haul freight vehicles. The main friction plates, wear plates, inclined plane wear plates, inclined wedges, are the main suspensions, which are shown in Fig. 1(a). Axlebox rubber pad is typically composed of multiple layers of rubber and metal steel plates alternately bonded to form a “sandwich” structure. It is located between the axlebox and the bogie side frame, secured by bolts. Through the elastic deformation of the rubber, it absorbs wheel-rail impacts and high-frequency vibrations, reducing the transmission of vibrations and noise to the carbody. It also restrains lateral and longitudinal displacement of the axlebox, maintaining the relative position between the wheelset and the bogie. Wedge block is primarily made of cast iron or cast steel, with surfaces often coated with wear-resistant materials. It features single or double inclined angles and is installed between the bogie side frame and the bolster. It is commonly paired with spring sets to form a friction-damping system. The center plate is fixed at the center of the vehicle body underframe, with a central hole designed for inserting the center pin. It bears the vertical load of the carbody and transfers it to the bogie via the lower center plate.
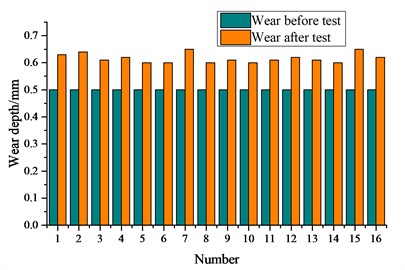
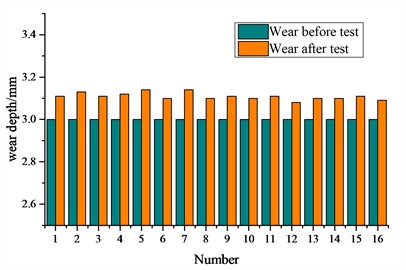
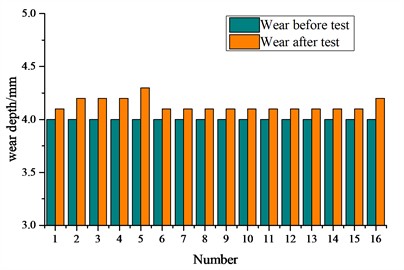
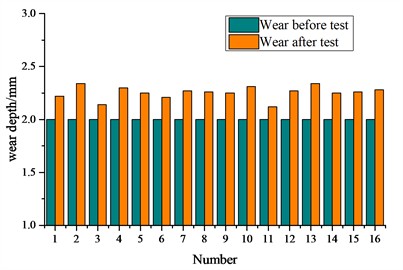
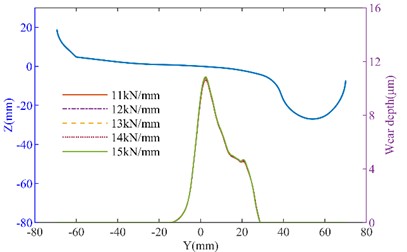
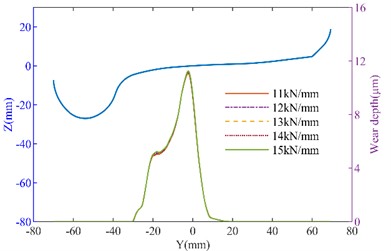
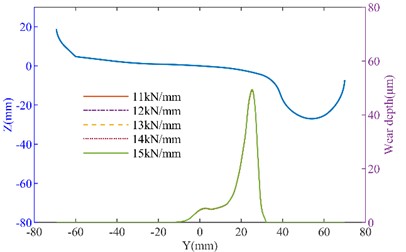
The suspension wear during the operation of 200,000 kilometers is shown in Fig. 1(b-e). The wear of the bearing saddle is stable and minimal, with an average value of wear depth of 0.12 mm. The average wear of the inclined wedge friction surface is 0.10 mm. The wear of the main friction plate with an average wear of 0.16 mm. The wear on the central plate remained stable. The average wear on the heart disk was 0.26 mm.
Fig. 1Suspension wear test and the result: a) measurement of wear on axle box rubber pad, wedge block, and center plate; b) the wear of the bearing saddle surface; c) the wear of inclined wedge friction surface; d) the wear amount of the main friction plate; e) the wear of the central plate

a)
b)
c)
d)
e)
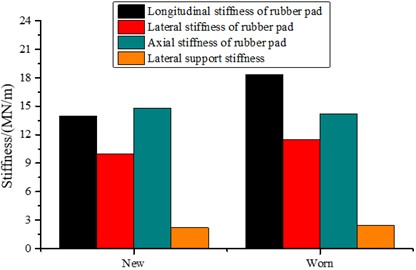
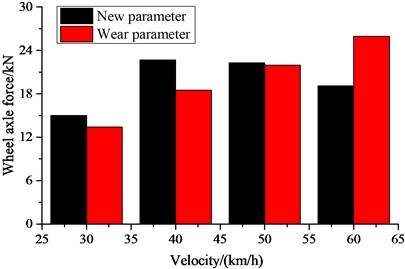
After 200,000 kilometers of operation on the test train, the parameters of the replaced rubber parts were statistically analyzed. Dimensional measurements and stiffness tests were conducted on the rubber parts after operation. Within the 200,000 kilometers of operation on the test vehicle, the average longitudinal stiffness of the axle box rubber pads f was 18.3 kN/mm, with an increase of 13.7 % in the upper limit of longitudinal stiffness compared to the new product, which is shown in Fig. 2. The average lateral stiffness of the new rubber pad was 11.5 kN/mm. The average lateral stiffness of the worn rubber pad was 12.5 kN/mm, with an 8 % increase in the upper limit of lateral stiffness compared to the new product. The test results indicated no significant expansion of rubber cracks, and no carbonization was found internally after dissecting the rubber pads.
Within the 200,000 kilometers of operation on the test vehicle, the actual working load of elastic side bearings still met the requirements for new product stiffness. The maximum increase in stiffness was 1.25 % compared to the upper limit. The test results showed a slight increase in side bearing stiffness and permanent deformation. The working load variations were not significant, and no carbonization was found internally after dissecting the side bearing bodies.
Fig. 2Stiffness of the suspension system
3. Establishing the dynamic model of the C80 heavy-haul freight vehicles
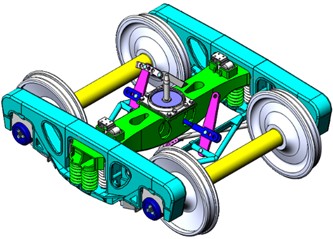
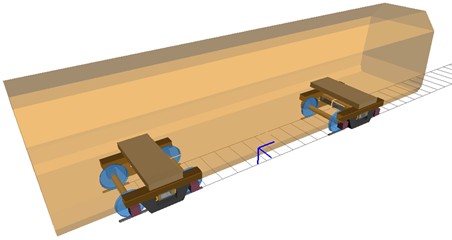
The primary suspension adopts elastic shear pads, while the secondary suspension adopts a central spring suspension system with a variable friction damping device and a secondary stiffness spring. A side frame elastic lower cross support device is installed between the two side frames. The 3D of the bogie model is shown in Fig. 3(a), which comprises two wheelsets, two side frames, and a bolster element, incorporating 6-DOFs. Elastic suspension elements are modeled using linear constitutive relationships, whereas critical interface clearances – particularly at frame/bolster and frame/shear pads – are represented via nonlinear hysteretic operators. The vehicle dynamic model of a heavy-haul freight vehicle is shown in Fig. 3(b). Wheel-rail normal contact forces were calculated by the Hertz contact theory, with tangential stresses solved through the Fastsim algorithm. Contact patch discretization employed a 14×14 mesh, while the wheel and rail used the LM wheel profile and CHN60 rail profile. The parameters of the dynamic model are shown in Table 1.
Fig. 3Heavy-haul freight vehicles dynamic model: a) three-dimensional freight bogie model; b) vehicle dynamic model of heavy-haul freight vehicle
a)
b)
Table 1Parameters of MBS vehicle dynamic model
Notation | Parameter | Value |
Empty/Load carbody mass (kg) | 10640/90640 | |
Bogie side frame mass (kg) | 497 | |
Wheelset mass (kg) | 1526 | |
Mass moment of inertia of empty/load carbody about axis (kg·m2) | 15352/133990 | |
Mass moment of inertia of empty/load carbody about axis (kg·m2) | 150153/861528 | |
Mass moment of inertia of empty/load carbody about axis (kg·m2) | 155420/865493 | |
Mass moment of inertia of bogie side frame about axis (kg·m2) | 20.7 | |
Mass moment of inertia of bogie side frame about axis (kg·m2) | 188.2 | |
Mass moment of inertia of bogie side frame about axis (kg·m2) | 172.5 | |
Mass moment of inertia of wheelset about axis (kg·m2) | 656 | |
Mass moment of inertia of wheelset about axis (kg·m2) | 111.7 | |
Mass moment of inertia of wheelset about axis (kg·m2) | 656 | |
Primary suspension stiffness along axis (MN/m) | 13 | |
Primary suspension stiffness along axis (MN/m) | 160 | |
Primary suspension stiffness along axis (MN/m) | 11 | |
Secondary suspension stiffness along axis (MN/m) | 3.1 | |
Secondary suspension stiffness along axis (MN/m) | 4.2 | |
Secondary suspension stiffness along axis (MN/m) | 3.1 |
Additionally, there is a clearance between the side bearing roller and the upper side bearing surface. The rotational friction torque of the center plate is as follows:
The governing equation parameters are defined as follows: is the axial force acting on the central disc element, represents its cross-sectional area, corresponds to the geometric radius of the planar surface, and is the interfacial friction property between contact surfaces.
For the calculation of the rotational friction torque of the side bearings, the influence of the roller clearance needs to be considered:
where, is the load of the side bearing, is vertical stiffness of the side bearing, is the side bearing roller gap, is the friction coefficient of the side bearing surface, and is the distance from the center of the side bearing.
To validate the accuracy of the model, the simulation results are compared with actual measurement data from the heavy-haul freight vehicle. The vertical acceleration of the side frame is compared to verify the accuracy of the model. Fig. 4 shows the time domain and frequency domain of the measured and simulated vertical acceleration of the side frame.
As shown in Fig. 4(c), it can be seen that both the experimental and simulated vertical accelerations are mainly distributed between –5 m/s2 and 5 m/s2. From Fig. 4(d), the amplitudes of the vertical acceleration within the range of 0-25 Hz are mostly distributed within 0.1 m/s2, with dominant frequencies around 3 Hz and 10 Hz. Considering the influence of other factors on the actual track, the measured data show larger fluctuations. By comparing the vertical acceleration of the side frame, the simulation model closely matches the measured data in both the time and frequency domains. Discrepancies exist between field measurements and simulations in the frequency domain, primarily due to the following reasons. The complexity of actual track conditions, field measurements involve real-world track irregularities and environmental factors not fully captured in simulations. The simulation uses the AAR6 track spectrum, which idealizes track irregularities and may not represent localized variations. Model rigidity limitations, the rigid-body model adopted in the simulation fails to account for elastic modal frequencies (e.g., wheel-rail contact dynamics or structural flexibility), leading to deviations from real-world behavior. Therefore, the vehicle dynamic model established using the above method can effectively simulate the vehicle's operational state.
Fig. 4Model verification: a) installation of data acquisition equipment and power supply batteries; b) placement of acceleration measurement point; c) lateral acceleration of the side frame (time-domain); d) lateral acceleration of the side frame (frequency-domain)
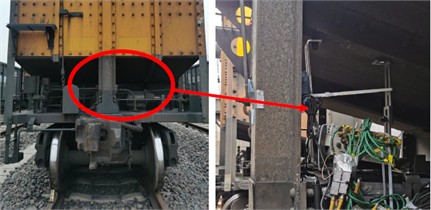
a)
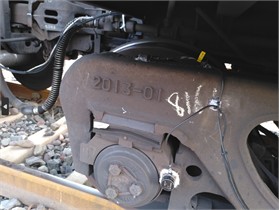
b)
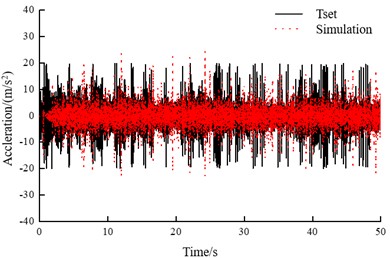
c)
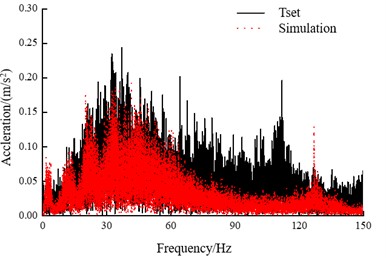
d)
4. Influence of suspension system on dynamic performance
During the dynamic calculations, both the new parameters and the worn suspension parameters are separately utilized. The critical speed is an intuitive way of reflecting hunting stability. The determination of critical velocity employs a steady-state evaluation protocol where controlled perturbations are introduced during consistent motion. Subsequent monitoring focuses on vibrational amplitude decay following stimulus termination to assess dynamic stability. By analyzing the influence of new suspension parameters and the worn suspension parameters on vehicle dynamics, the critical speeds of the vehicle were calculated for two different parameters. The critical speed for the new parameters is 226.1 km/h, while the critical speed for the worn parameters is 218.3 km/h, as shown in Fig. 5(a).
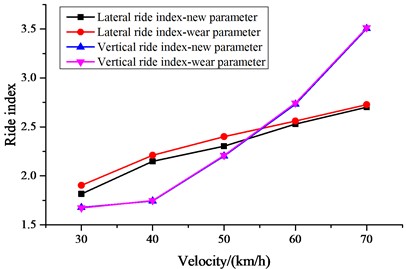
According to the Chinese standard GB/T5599-2019 [21], the ride index (to ensure the integrity of transported goods) is evaluated based on the ride index and maximum vibration acceleration.
The vehicle ride index evaluation predominantly utilizes the Sperling computational model, which establishes the relationship:
where is ride quality metric quantifies passenger discomfort levels, and are the root-mean-square oscillatory acceleration (m/s2) and the dominant spectral frequency component (Hz), and are frequency-dependent weighting factors derived from human vibration sensitivity studies referred to the standard GB5599-2019 [21]. Ride index: 3.5 (excellent), 3.5 4.0 (good).
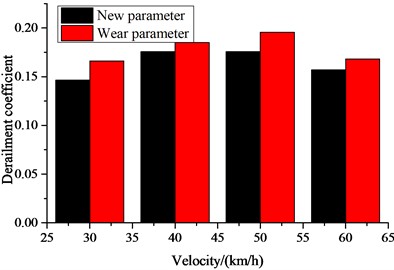
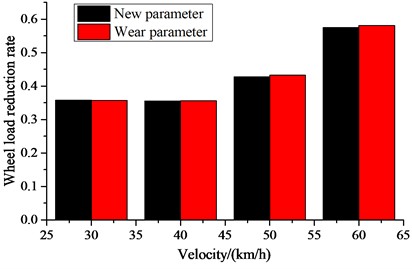
Fig. 5Dynamic indexes: a) critical speed; b) ride index; c) derailment coefficient; d) wheel load reduction rate; e) wheel lateral axle force
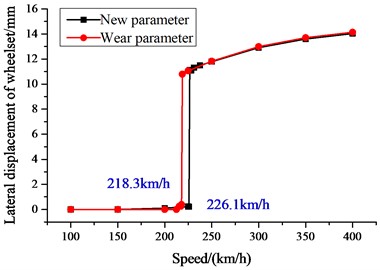
a)
b)
c)
d)
e)
Dynamic indicators related to operational safety mainly include derailment coefficient, wheel load reduction rate, and the lateral axle force, with specific limits as follows:
(1) Derailment coefficient .
First limit: , Second limit: .
Where: is the lateral force between the wheel and rail, and is the vertical force between the wheel and rail.
(2) Wheel load reduction rate .
First limit: , Second limit: .
Where is the reduction in wheel load, and is the average wheel load on the loaded and unloaded wheels.
(3) Lateral force.
The allowable limits for rail lateral force are as follows:
The limit value of the wheel axle lateral force during straight line and curved track operation can be calculated based on the formula above:
where: , and represent the static load (wheel load) of the left and right wheels, and represents the lateral wheelset axle force.
The worn suspension parameters have reduced the critical speed of the vehicle. The ride index and the safety index are shown in Fig. 5(b-e). It can be seen that the worn suspension parameters have a relatively small effect on the vertical ride index and lateral ride index, but the corresponding ride indexes for the worn suspension parameters have increased. The parameters of the curved track are configured as follows: straight line is 200 m, the transition curve is 150 m, the circular curve is 300 m, the superelevation is 80 mm, the curve radius is 500 m. The safety indexes are also analyzed, which include the derailment coefficient, wheel load reduction rate, and lateral force on the wheel axle. It can be seen that the worn suspension parameters have further increased the safety indexes, with a relatively small effect on the wheel load reduction rate, while the lateral force on the wheel axle and derailment coefficient have increased. When the speed is 60 km/h, the derailment of the new parameter and worn parameters are 0.16 and 0.175, the derailment of the new parameter and worn parameters are 0.58 and 0.585, and the lateral force on the wheel axle of the new parameter and worn parameters are 19.2 kN and 25.5 kN.
5. Wheel wear performance
5.1. Wear model
Jendel's wear model [22] is an advancement of the Archard wear model, which incorporates empirical adjustments to the wear coefficient through experimental validation. Precise demarcation of these tribological domains requires computational implementation through Fastsim algorithms, which simulate interfacial stress distribution to differentiate stationary adhesion from relative sliding motions. The methodology fundamentally redefines wear prediction by correlating localized frictional work with material loss rates under specific contact mechanics conditions:
where: is the material degradation coefficient quantifying wear rate per unit sliding work, is the surface hardness property reflecting resistance to plastic deformation. is the normal load acting on the tribological interface, is the tangential velocity differential between interacting surfaces, is the sliding zone of the contact patch.
The contact patch is divided into meshes with lengths of and , the integrated Hertz-Fastsim computational framework discretizes the contact interface into grid elements with defined spatial dimensions. Within this numerical scheme, the localized wear magnitude for individual computational cells is governed by the following relationship:
where, and are principal semi-axes characterizing the elliptical contact zone dimensions, tangential velocity differential along the rolling direction, is the lateral velocity component perpendicular to primary motion, is the nominal transit speed of the wheel relative to the contact interface.
5.2. The wheel wear simulation results
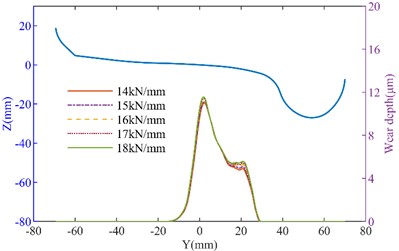
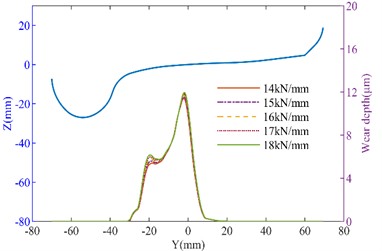
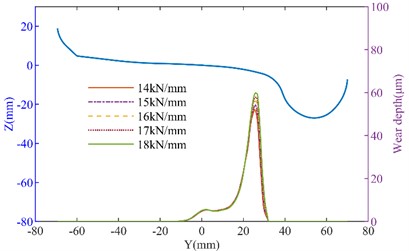
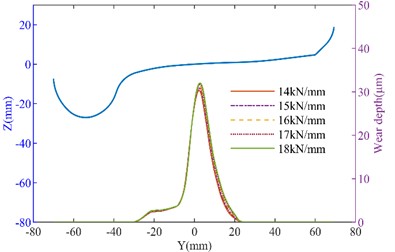
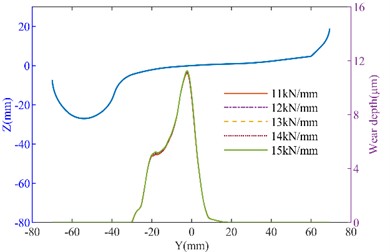
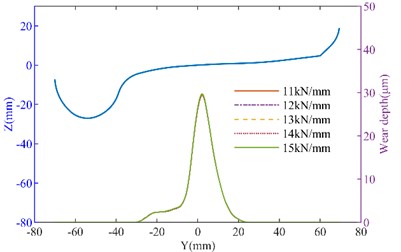
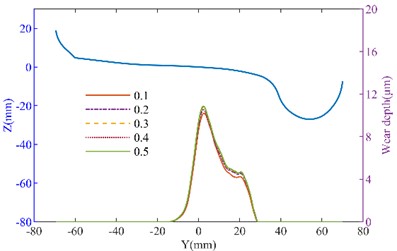
To further analyze the effect of suspension parameters on wheel wear, the influence of longitudinal stiffness and lateral stiffness on wheel wear was calculated separately, as shown in Fig. 6-Fig. 7. It can be seen that as the longitudinal stiffness of the primary suspension increases, the wheel wear on both the tangent track and the curved track increases. On the straight track, when the longitudinal stiffness increased from 14 MN/m to 18 MN/m, the maximum wear depth of the No.1 left wheel increased from 10.983 μm to 11.622 μm, while that of the No. 1 right wheel increased from 11.309 μm to 11.985 μm. On the curved track, the maximum wear depth of the No. 1 left wheel increased from 51.483 μm to 60.183 μm (a 14.45 % increase). This demonstrates that longitudinal stiffness has a relatively significant effect on wheel wear. When lateral stiffness increases, wheel wear further intensifies. When the primary lateral stiffness increased from 11 MN/m to 15 MN/m in the curved track, the maximum wear depth of the No. 1 left wheel increased from 48.863 μm to 49.54 μm, and that of the No. 1 right wheel increased from 29.334 μm to 29.609 μm.
Fig. 6The influence of longitudinal stiffness variation on tire wear: a) left wheel wear of the straight track; b) right wheel wear of the straight track; c) left wheel wear of the curved track; d) right wheel wear of the curved track
a)
b)
c)
d)
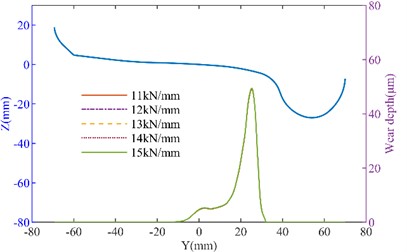
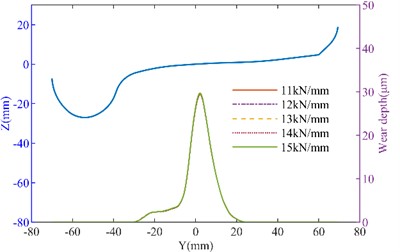
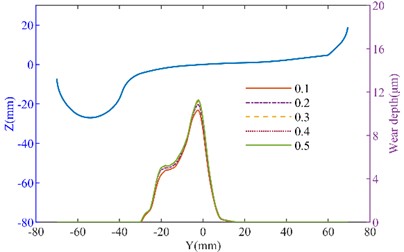
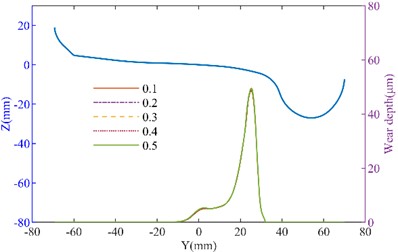
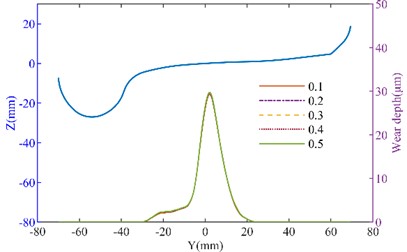
The side bearing and inclined wedge are shown in Fig. 8(a), when the side bearing lateral stiffness is changed, the wheel wear increases with the increase in stiffness. When the lateral stiffness of the side bearing increased from 50 % to 150 %, on the straight track, the maximum wear depth of the left wheel increased from 10.263 μm to 11.618 μm, and the right wheel’s maximum wear depth increased from 10.403 μm to 12.018 μm. However, on the curved track, the changes in wear depth were minimal. The side bearing wear can cause an increase in wheel wear. As the inclined wedge friction coefficient increases, as shown in Fig. 9, the wheel wear on both the tangent track and the curved track also increases. It can be seen that when the friction coefficient increases from 0.1 to 0.5, on the straight track, the maximum wear depth of the No. 1 left wheel increases from 10.238 μm to 10.825 μm. The maximum wear depth of the No. 1 right wheel increases from 10.569 μm to 11.250 μm. On the curved track, the maximum wear depth of the No. 1 left wheel increased from 48.163 μm to 49.263 μm (an increase of 2.28 %). The maximum wear depth of the No. 1 right wheel increases from 28.922 μm to 29.457 μm (an increase of 1.6 %). It can be concluded that with the wear of the suspension system, the suspension parameters of heavy haul freight vehicles will change, thereby affecting the wheel wear. Moreover, the deterioration of wear will further affect the dynamic performance. Therefore, it is important to effectively monitor the wear of the suspension system during operation.
Fig. 7The effect of axial stiffness variation on wheel wear: a) left wheel wear of the straight track; b) right wheel wear of the straight track; c) left wheel wear of the curved track; d) right wheel wear of the curved track

a)
b)
c)
d)
6. Conclusions
This paper first conducted experimental tests to measure the changes in suspension parameters after wear. Then, a dynamic model of heavy-haul freight vehicles was established to analyze the vehicle’s dynamic performance and wheel wear due the worn suspension parameters.
1) Through experimental tests, it was found that the stiffness parameters of the suspension system increased after wear. The validity of the dynamic model of the freight vehicle was verified by the measured data. In the time domain and frequency domain, the effectiveness of the model has been validated.
2) The influence of the wear suspension parameters on the dynamic performance was analyzed by the dynamic model. The critical speed further decreased, the critical speed for the new parameters is 226.1 km/h, while the critical speed for the worn parameters is 218.3 km/h. And the ride indexes and safety indexes increased. When the speed is 60 km/h, the derailment of the new parameter and worn parameters are 0.16 and 0.175, the derailment of the new parameter and worn parameters are 0.58 and 0.585, and the lateral force on the wheel axle of the new parameter and worn parameters are 19.2 kN and 25.5 kN.
Fig. 8The influence of lateral stiffness of side bearing on wheel wear: a) the three dimension model of the bogie; b) left wheel wear of the straight track; c) right wheel wear of the straight track; d) left wheel wear of the curved track; e) right wheel wear of the curved track
a)
b)
c)
d)
e)
3) The Jendel wear model was used to calculate the wear under different parameters. It was found that when the suspension parameters and inclined wedge friction coefficient increased, the wheel wear also increased. When the longitudinal stiffness increased from 14 MN/m to 18 MN/m, on curved track, the maximum wear depth of the No. 1 left wheel increased from 51.483 μm to 60.183 μm (a 14.45 % increase). This demonstrates that longitudinal stiffness has a relatively significant effect on wheel wear.
Fig. 9The effect of inclined wedge friction coefficient on wheel wear: a) left wheel wear of the straight track; b) right wheel wear of the straight track; c) left wheel wear of the curved track; d) right wheel wear of the curved track
a)
b)
c)
d)
References
-
Y. Qi, S. Li, L. Zhang, R. Jiang, H. Liu, and P. Ao, “Study on the mechanism of wheel asymmetric wear of heavy-haul freight vehicles,” Tribology Transactions, Vol. 67, No. 2, pp. 294–310, Mar. 2024, https://doi.org/10.1080/10402004.2024.2312244
-
P. A. de Paula Pacheco et al., “The effectiveness of different wear indicators in quantifying wear on railway wheels of freight wagons,” Railway Engineering Science, Vol. 32, No. 3, pp. 307–323, Apr. 2024, https://doi.org/10.1007/s40534-024-00334-8
-
Y. Qi et al., “Improving the lateral stability of high speed trains using elastic-suspended motors based on inerter structure,” Vehicle System Dynamics, pp. 1–26, Apr. 2025, https://doi.org/10.1080/00423114.2025.2487183
-
S. Sui, K. Wang, L. Ling, and Z. Chen, “Effect of wheel diameter difference on tread wear of freight wagons,” Engineering Failure Analysis, Vol. 127, p. 105501, Sep. 2021, https://doi.org/10.1016/j.engfailanal.2021.105501
-
H. Wang, Y. Zhao, Y. Qi, and Y. Cao, “Effect of line parameters on wheel wear of heavy-haul freight vehicle,” Industrial Lubrication and Tribology, Vol. 76, No. 3, pp. 419–430, Apr. 2024, https://doi.org/10.1108/ilt-02-2024-0038
-
X. Hu et al., “Dynamic analysis of cross brace anti-warp stiffness performance for heavy haul freight wagon,” Vehicle System Dynamics, pp. 1–23, Mar. 2025, https://doi.org/10.1080/00423114.2025.2473465
-
A. O. Shvets, “Dynamic interaction of a freight car body and a three-piece bogie during axle load increase,” Vehicle System Dynamics, Vol. 60, No. 10, pp. 3291–3313, Oct. 2022, https://doi.org/10.1080/00423114.2021.1942930
-
S. Panchenko, J. Gerlici, A. Lovska, V. Ravlyuk, and J. Dižo, “Prediction of residual wear resources of composite brake pads of a modernized brake system of freight wagons,” Vehicles, Vol. 6, No. 4, pp. 1975–1994, Nov. 2024, https://doi.org/10.3390/vehicles6040097
-
S. D. Iwnicki, S. Stichel, A. Orlova, and M. Hecht, “Dynamics of railway freight vehicles,” Vehicle System Dynamics, Vol. 53, No. 7, pp. 995–1033, Jul. 2015, https://doi.org/10.1080/00423114.2015.1037773
-
S. Bruni, J. Vinolas, M. Berg, O. Polach, and S. Stichel, “Modelling of suspension components in a rail vehicle dynamics context,” Vehicle System Dynamics, Vol. 49, No. 7, pp. 1021–1072, Jul. 2011, https://doi.org/10.1080/00423114.2011.586430
-
P. Millan, J. Pagaimo, H. Magalhães, and J. Ambrósio, “Clearance joints and friction models for the modelling of friction damped railway freight vehicles,” Multibody System Dynamics, Vol. 58, No. 1, pp. 21–45, Nov. 2022, https://doi.org/10.1007/s11044-022-09857-6
-
R. Kovalev et al., “Freight car models and their computer-aided dynamic analysis,” Multibody System Dynamics, Vol. 22, No. 4, pp. 399–423, Sep. 2009, https://doi.org/10.1007/s11044-009-9170-6
-
P. H. A. Corrêa, P. G. Ramos, L. H. S. Teixeira, G. F. M. Dos Santos, and A. A. Dos Santos, “Dynamic simulation of a heavy-haul freight car under abnormal braking application on tangent and curve,” Vehicle System Dynamics, Vol. 61, No. 9, pp. 2456–2471, Sep. 2023, https://doi.org/10.1080/00423114.2022.2113807
-
E. Bernal, M. Spiryagin, and C. Cole, “Wheel flat detectability for Y25 railway freight wagon using vehicle component acceleration signals,” Vehicle System Dynamics, Vol. 58, No. 12, pp. 1893–1913, Dec. 2020, https://doi.org/10.1080/00423114.2019.1657155
-
Y. Q. Sun, S. N. Ahmad, I. Persson, M. Spiryagin, E. Bernal Arango, and C. Cole, “Freight container wagon modelling and simulation analysis due to braking,” Vehicle System Dynamics, Vol. 62, No. 12, pp. 3255–3275, Mar. 2024, https://doi.org/10.1080/00423114.2024.2325189
-
P. H. A. Corrêa, P. G. Ramos, R. Fernandes, P. R. G. Kurka, and A. A. Dos Santos, “Effect of primary suspension and friction wedge maintenance parameters on safety and wear of heavy-haul rail vehicles,” Wear, Vol. 524-525, p. 204748, Jul. 2023, https://doi.org/10.1016/j.wear.2023.204748
-
L. Zhang and Y. Qi, “Research on the wheel wear prediction of heavy-haul freight wagon based on the roller rig test and line test,” Industrial Lubrication and Tribology, Dec. 2024, https://doi.org/10.1108/ilt-09-2024-0329
-
J. Zhang, G. Tao, and Z. Wen, “Influence of operating parameters on the temperature rise of the wheel tread of a freight wagon when braking on a long downhill ramp,” Tribology Transactions, pp. 1–24, Apr. 2025, https://doi.org/10.1080/10402004.2025.2488802
-
C. Fang, Y. Ding, H. Yan, J. Chen, W. Zhou, and X. Meng, “Prediction and analysis of wheel flange wear on small curved track considering wheel-rail conformal and lubricated contact,” Wear, Vol. 558-559, p. 205569, Dec. 2024, https://doi.org/10.1016/j.wear.2024.205569
-
R. Fröhling, A. Ekberg, and E. Kabo, “The detrimental effects of hollow wear--field experiences and numerical simulations,” Wear, Vol. 265, No. 9-10, pp. 1283–1291, Oct. 2008, https://doi.org/10.1016/j.wear.2008.01.032
-
Y. Qi, H. Dai, Y. Song, Y. Ye, and D. Li, “Optimisation design of grinding rail profile of metro lines for small radius curved track based on the GFC method: a case study,” Vehicle System Dynamics, Vol. 62, No. 8, pp. 1929–1951, Aug. 2024, https://doi.org/10.1080/00423114.2023.2270590
-
T. Jendel, “Prediction of wheel profile wear-comparisons with field measurements,” Wear, Vol. 253, No. 1-2, pp. 89–99, Jul. 2002, https://doi.org/10.1016/s0043-1648(02)00087-x
About this article

The datasets generated during and/or analyzed during the current study are available from the corresponding author on reasonable request.
Yufeng Cao: writing-original draft preparation, methodology. Weihua Zhang: conceptualization, formal analysis. Yayun Qi: investigation, writing-review and editing.
The authors declare that they have no conflict of interest.
