Abstract
This article conducts in-depth research on the force analysis of the test running wheel of a certain type of straddle monorail vehicle, based on the tire six-component force test and wheel dynamic stress test. The main research objective is to accurately identify the factors affecting the wheel strength, thereby providing a solid foundation for subsequent design optimization and safety enhancement. The research commences with a meticulous calibration of the vehicle connecting rod in the laboratory, aiming to acquire the “force-strain” coefficients under both tension and compression conditions. A novel approach lies in the verification of calibration accuracy through a detailed comparison with experimental results, ensuring the reliability of subsequent data acquisition. By strategically installing displacement sensors at various positions to measure the vehicle's dynamic displacement and detecting the strain of the connecting rod, the study innovatively calculates the six-component force data of the tire, which provides a comprehensive data basis for analyzing the forces acting on the wheel hub. Then evaluating the fatigue strength of the wheel hub under AW0 and AW3 operating conditions based on the IIW standard, the research uncovers unique findings. It is revealed that, although the maximum dynamic loads of the vertical force of the running wheel, the lateral force of the guide wheel, and the lateral force of the stabilizing wheel are within the limit load range with a certain safety margin, there are 1 point and 3 points on the wheel hub under AW0 and AW3 working conditions, respectively, that fail to meet the fatigue strength criterion requirements. The maximum equivalent force amplitude at Measurement Point 3 of the inner hub reaches 51.4 MPa, while the calculated service mileage is only 31,000 kilometers. This discovery is of great significance as it precisely pinpoints the weak points of the wheel hub, which is a major contribution to the field. Moreover, during the analysis of the wheel hub's dynamic stress during emergency braking and the influence of polygonal wear on it, the research confirms that there is no abnormal change in the wheel hub’s dynamic stress during emergency braking, and the polygonal wear of the tire shoulder has a negligible impact on the wheel hub’s dynamic stress. These results not only calculate the six-component force data of the tire but also break new ground in understanding the interaction between different factors and the wheel hub’s performance.
1. Introduction
Straddle monorail vehicles have the characteristics of low noise, strong climbing ability, strong adaptability of small radius curves, etc. [1], which has significant advantages in the more undulating terrain. For example, it has been mature and widely used in Chongqing [2]. It has significant differences with the traditional steel wheel track rail vehicles, mainly reflected in the bogie structure, guiding mechanism, wheel-rail contact relationship and other aspects [3]. The wheels of straddle monorail vehicle generally include running wheels, stabilizing wheels and guide wheels, which are in contact with the rail beams in the form of rubber tyres [4]. The frequency of fatigue-induced vehicle breakdowns increases as the vehicle's service time increases. Due to the unique structure of straddle monorail vehicle, fatigue tests are carried out on them using methods slightly different from those used for conventional steel rail vehicles, such as the tire six component force test and wheel hub fatigue test.
Domestic and foreign scholars have conducted extensive research on straddle monorail vehicles. For the dynamic performance, Yang et al. [5] established a dynamic model of straddle monorail four-vehicle considering the coupler force, and analyzed the vibration response, ride comfort and dynamic bending behavior. The article points out that the body acceleration vibration response obtained from the single-vehicle model differs significantly from that of the multi-vehicle model, and the ride comfort of the vehicle can be calculated more accurately by using the multi-vehicle model. Du et al. [6] through the force analysis on straddle monorail vehicle bogie and the track beam, the safety performance evaluation indexes of straddle monorail vehicle through curve were studied, combined with railway and vehicle safety performance evaluation index. And it is used to analyze and evaluate the safety performance of straddle monorail vehicle through the S-shaped curve at normal operating speed. Xu et al. [7] construct the wheel-track coupling dynamic equation, establish the track beam finite element model and vehicle dynamic model based on iterative method, and verify the convergence and accuracy of the iteration by comparing the calculation results with the vehicle test.
For wear grinding, Wen [8] analyzed the mechanical reason of wheel tire partial wear of monorail vehicles through the establishment of wheel-rail relationship and vehicle coupling dynamics model, revealed the wear mechanism of wheel tire and carried out research on the straddle type monorail wheel tire partial grinding control method. Yao et al. [9] present the design and calibration of a heavy load tire six component force sensor. The authors proved the rationality of the design scheme through “virtual calibration”. Although crosstalk exists in the sensors, experiments have proved that a high-accuracy heavy load tire six component force sensor is still obtained with decoupling calculation. Ren et al. [10] adopted a linearized tire model and considered the radial rigidity of the running tire, side deflection effect, etc., to establish a dynamics model and analyze the effect of tire pre-pressure on the smoothness of a straddle monorail solo vehicle passing through curves and staggered joints of track girders. Shen et al. [11] established the theoretical model and dynamic simulation model of the straddle monorail, focusing on the force analysis of the tire. The results show that by setting a reasonable pre-pressure, we can ensure the vehicle anti-overturning stability and the operation safety, which in turn reduces the wear of tires.
Previous studies show that current research on straddle-monorail vehicles mainly relies on theoretical simulations for dynamic indexes. Field tests on tire forces are scarce, and public reports on wheel fatigue life are non-existent. This paper, therefore, analyzes the factors affecting the wheel strength via tire six-component force and wheel-hub fatigue tests, offering crucial reference for future wheel design.
2. Wheel arrangement and calculation method
2.1. Wheel arrangement form
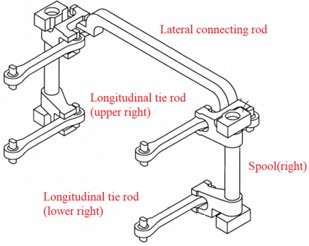
The wheel arrangement of a straddle monorail vehicle is shown in Fig. 1, using the railroad coordinate system, with the forward direction of the vehicle being the -axis positive direction. Each bogie contains 2 running wheels, 4 guide wheels and 2 stabilizing wheels.
2.2. Equivalent stress amplitude calculation method
Fatigue of wheel hubs is a fatigue problem under variable amplitude loads. Stresses below the fatigue limit can also have an effect on the damage of the structure, so the fatigue assessment of structures under variable amplitude loading needs to take into account the contribution of each level of stress to the fatigue damage of the structure. And the standards for the given S-N curves are all S-N curves under symmetric cycling. Therefore, the test data were corrected for the average stress.
Fig. 1Wheel arrangement form

a) Test train
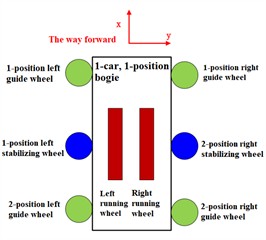
b) Schematic diagram
The rain-flow counting algorithm, a widely-used method for analyzing variable-amplitude loading histories, was then employed. This algorithm operates on the principle of simulating raindrops flowing down a roof. In a stress-time curve, it identifies and separates individual stress cycles by starting from peaks and flowing down until encountering a larger peak or the end of the sequence. Each identified cycle is characterized by its stress range and mean stress.
After applying the rain-flow counting algorithm, the one-dimensional stress spectra of each evaluation point under the test condition were obtained. These spectra are crucial for fatigue life assessment and further force analysis as they provide detailed information about the cyclic loading conditions the components are subjected to. Finally, to calculate the damage at each measurement point from the corresponding S-N curves.
According to the principle of equivalent damage and Miner’s cumulative damage theory, the stress amplitude spectrum is equivalent to a constant amplitude stress (Weld seam 2 million times, base metal 10 million times), which is called the equivalent stress amplitude.
The procedure for calculating the equivalent stress amplitude is as follows:
Based on Miner’s cumulative damage theory, the damage value at the time of the test was calculated in Eq. (1) [8]:
where: is the number of cycles for each level of stress amplitude; and are the relevant parameters of the S-N curves, which are taken as 3.0 for the weld and 5 for the base metal. is the equivalent stress amplitude corresponding to the safe operation of the frame and tie rods for 3.6 million kilometers (1 million kilometers for the hub). Assume that the damage produced by the equivalent force amplitude acting times is , then, as shown in Eq. (2) [9]:
where: is generally taken as 2 million times (10 million times for base metal); and are the relevant parameters of the S-N curves, which are taken as 3.0 for the weld and 5 for the base metal.
The number of kilometers of operation for a measured stress spectrum is known to be , and the damage produced by one stress spectrum is ; Assuming that the safe operating mileage that produces damage is (3,600,000/1,000,000 km), as shown in Eq. (3):
Bringing the expressions for and into Eq. (3) and organizing, we have Eq. (4):
If the equivalent stress amplitude at the measurement point is less than the corresponding fatigue permissible stress, it means that it is able to run for 3,600,000/1,000,000 kilometers in this state, and the fatigue limit at the hub (FAT71) can be calculated to be 51.5 MPa according to the above formula.
2.3. Fatigue strength assessment criteria
If the equivalent stress amplitude at the measurement point is lower than the corresponding fatigue allowable stress, it indicates that the system can operate for 3.6 (1) million kilometers under that condition. The fatigue strength assessment guideline and S-N curve are shown in Fig. 2 and Table 1.
Fig. 2S-N curve
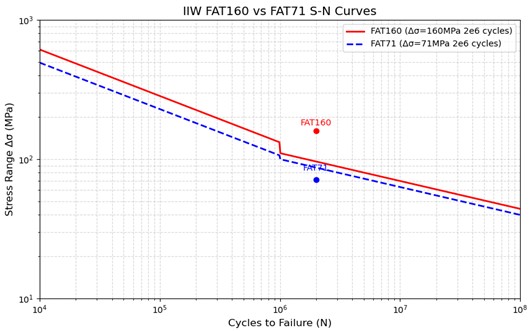
Table 1Fatigue limit
Assess location | Fatigue limit (stress range) |
Framework base material (FAT160) | 116 |
Framework base material (FAT71) | 41.5 |
Hub (FAT71) | 51.5 |
Lateral connecting rod (FAT160) | 116 |
3. Connecting rod calibration
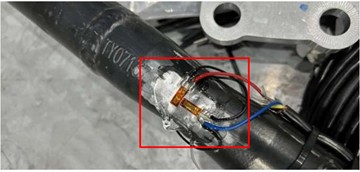
The longitudinal force of the running wheel needs to be obtained by calculating the force on the rod, and in order to obtain the force on the rod, the rod needs to be calibrated before testing. By loading the rod on the testing machine, recording the strain values under different loads, with a maximum loading force of 10 kN, loading once at an interval of 1 kN, a loading time of 10 s, a steady loading of 20 s, and then to the next cycle. Eventually, the variation relationship between the rod’s strain and force will be obtained, providing a calculation basis for the wheel’s force analysis. The connecting rod calibration equipments are shown in Fig. 3. The calibration process is shown in Fig. 4.
Fig. 3Connecting rod calibration equipment
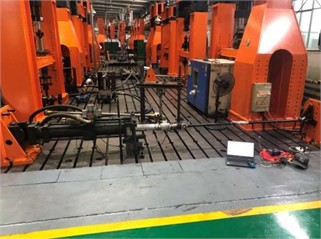
Fig. 4Example of figure consisting of multiple charts
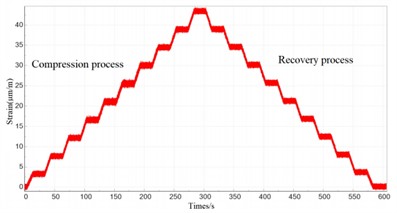
a) Rod Tension
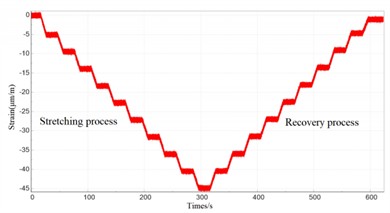
b) Rod compression
3.1. Strain-force calibration of rod
When the load on the rod is less than 10 kN, the rod is within the elastic deformation range, and the “strain-force” relationship is linearized, and the “force-strain” coefficients of the longitudinal tie rods and lateral connecting rods can be obtained through the test, as shown in Table 2. By loading on the testing machine, record the strain values under different loads, with a maximum loading force of 10 kN and an interval of 1 kN load once, load for 10 seconds, stabilize for 20 seconds, and then proceed to the next cycle. The calibration results of the rod in tension and compression are depicted in Fig. 5.
Table 2“Force-strain” corresponding coefficient
Name of rod | Force (kN) / Strain (um/m) |
Longitudinal tie rod | 1/4.5 |
Lateral tie rod | 1/17.5 |
Fig. 5Rod calibration results
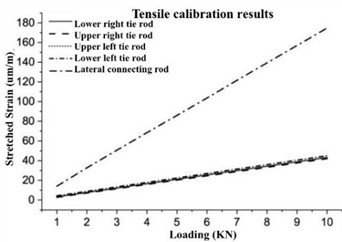
a) Rod tension
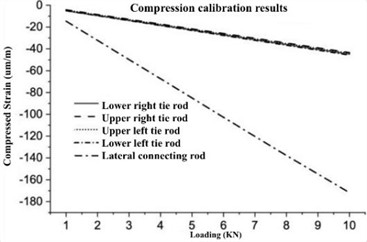
b) Rod compression
3.2. Comparison of theoretical calculations and test results
3.2.1. Comparison of theoretical calculations and test results
The structure diagram of the vehicle traction device is shown in Fig. 6. The force relationship of the rod can be obtained by theoretical calculation. The distance between the upper longitudinal pull rod and the rail surface is 110 mm, and the distance between the lower longitudinal pull rod and the rail surface is 460 mm. The ratio of the upper pull rod force to the lower pull rod force obtained by taking a moment on the running surface is 4.2. The distance between the transverse connecting rod and the axis of rotation is 30 and mm, and the distance between the longitudinal connecting rod and the axis of rotation is 226mm. The ratio of the unilateral longitudinal force to the transverse connecting rod force obtained by taking a moment on the axis of rotation is 1.3.
Fig. 6Traction device schematic diagram
3.2.2. Measured results
When the vehicle undergoes emergency braking, the rod is subjected to the maximum force, at which time the influence of other factors on the force on the rod can be ignored. Fig. 7(a) shows the force of the rods when the vehicle undergoes emergency braking, and it can be seen from the figure that when the vehicle undergoes stable deceleration, the steady-state forces on the upper and lower tie rods are approximately 5.6 kN and 1.5 kN, respectively, with a ratio of about 4; the stabilized value of the force of the lateral connecting rod is about 4.9 kN, and the ratio of the unilateral longitudinal force to the lateral connecting rod force is 1.44. The measured results are basically consistent with the theoretical calculations. From Fig. 7(b), it can be seen that under normal operating conditions, the force on the members will increase when passing through curved sections, and the smaller the curve radius, the greater the force.
4. Tire six component force test
The wheel six component force consists of the three-directional forces of the road acting at the center of the wheel and the three-directional moments formed by these forces. The analysis of tire force helps to predict the fatigue life of the vehicle structure as well as to analyze the effect of tire force on the wheel hub, it is important for vehicle and wheel development [12]-[13], and provides an important basis for subsequent wheel hub improvement programs.
4.1. Measuring point arrangement
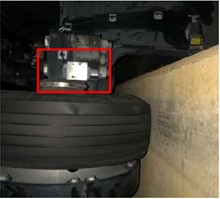
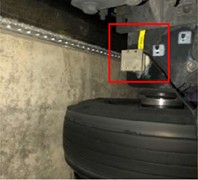
By using a laser sensor to test the dynamic displacement of the tire relative to the track, the vertical force of the driving wheel and the lateral force of the stabilizing wheel are obtained. When using the displacement sensor, a low-pass filter with a sampling frequency of 1000 Hz and 5 Hz is selected; By testing the strain of the traction rod and connecting rod, and based on the “strain force” relationship curve calibrated in the laboratory, the longitudinal and transverse forces of the traction are obtained. The arrangement of laser displacement sensor and tension rod strain measurement points is shown in Fig. 8.
Fig. 7The force diagram of the rod
a) AW3 load emergency braking condition
b) Normal operating conditions
Fig. 8Sensor layout diagram
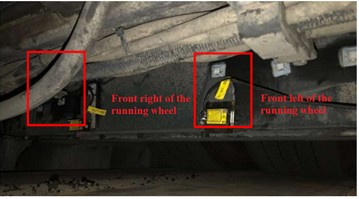
a) Running wheel vertical displacement measurement point
b) Guide wheel lateral displacement measurement point
c) Longitudinal tie rod measurement point
d) Stabilising wheel lateral displacement measurement point
4.2. Result processing
Tire displacement multiplied by the corresponding tire radial rigidity can be directly obtained tire force, each tire radial rigidity and pre-pressure as shown in Table 3. Tire dynamic force processing to “compression” force is positive, “stretch” force is negative. The following table shows the maximum dynamic compressive force of the tires (without pre-pressure) with 99.85 % confidence level. The maximum tire tensile and compressive forces for each site interval are shown for AW0 and AW3 loading conditions. (AW0 represents the unloaded condition, AW3 refers to the fully loaded condition, simulating overweight by adding sandbags or other methods inside the carriage)
Table 3Tire stiffness and pre-pressure
Running wheel | Guiding wheel / Stabilizing wheel | ||
Radial rigidity AW0/AW3 (kN/mm) | Pre-pressure AW0/AW3 (kN) | Radial rigidity (kN/mm) | Pre-pressure (kN) |
1.466/1.592 | 37.5/66.9 | 0.59 | 5.44 |
4.3. Test result
4.3.1. Vertical force of the running wheel
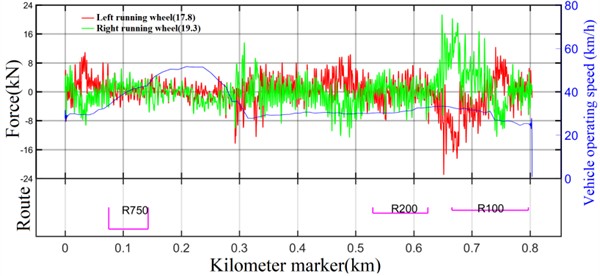
In this paper, the dynamic vertical force of the running wheel is measured when the vehicle is traveling on the line proper, and due to space limitation, only the interval when the vertical force of the running wheel is at its maximum is listed below. Figs. 9-10 respectively show the test results in the intervals where the maximum compressive force occurs in the wheels at AW0 and AW3 loads of the vehicle. At AW0 loading, the maximum vertical force on the running wheel is 19.3 kN, which occurs at the right running wheel of the 1-position frame; at AW3 loading, the maximum vertical force on the running wheel is 25.9 kN, which occurs at the left running wheel of the 1-position frame. Under both AW0 and AW3 loading conditions, the longitudinal forces exerted on the running wheel remained within the design limits, thus meeting the design criteria.
Fig. 9Vertical force of running wheel under AW0 load (1-position frame)
4.3.2. Longitudinal force of the running wheel
The longitudinal force of the running wheel was calculated by measuring the strain of the frame rods, and Table 4 shows the test results of the corresponding intervals at the maximum value of the longitudinal force of the tires at AW0 and AW3 loads, including the emergency braking condition as well as the normal driving condition on the positive line. It can be seen that the maximum longitudinal force of the running wheel tires during emergency braking is 12.8 kN for AW0 load and 8.1 kN for normal driving on the positive line, and the maximum longitudinal force of the running wheel tires during emergency braking is 19.5 kN for AW3 load and 9.5 kN for normal driving on the positive line. For both AW0 and AW3 loads, the longitudinal forces on the running wheel remained below the design limits, thus complying with the design criteria.
Fig. 10Vertical force of running wheel under AW3 load (1-position frame)
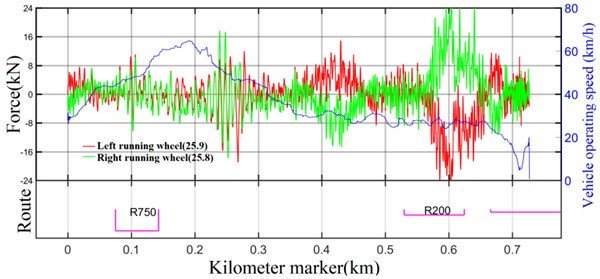
Table 4Longitudinal force results of running wheel
Working condition | AW0 tire longitudinal force (maximum tensile force) / kN | AW0 tire longitudinal force (maximum compressive force) / kN | AW3 tire longitudinal force (maximum tensile force) / kN | AW3 tire longitudinal force (maximum compressive force) / kN |
Emergency braking | 12.4 | 12.8 | 19.5 | 12.2 |
Normal operation | 8.1 | 7 | 7.9 | 9.5 |
4.3.3. The lateral force of guide wheel
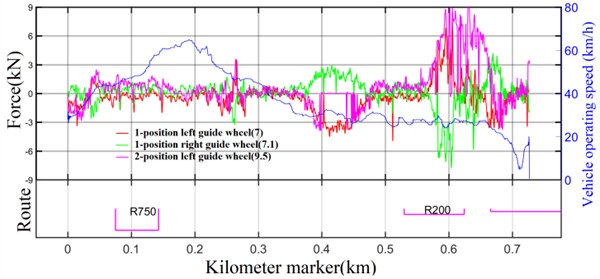
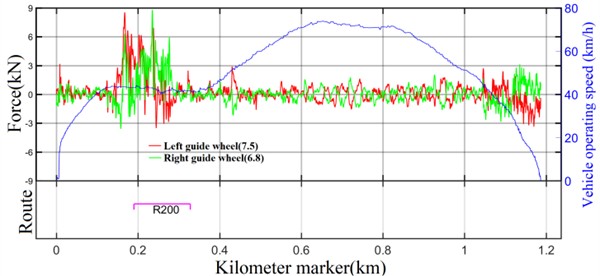
The lateral force of guide wheel is obtained by testing the dynamic lateral displacement of the tire relative to the track with a laser sensor. Due to space constraints, Figs. 11-12 respectively show the test results for the driving intervals corresponding to the maximum values of the lateral force of guide wheel for vehicle loads of AW0 and AW3. The maximum value of the lateral force of guide wheel under AW0 load is 8.3 kN, which occurs at the right guide wheel of the 1-position frame; the maximum value of the lateral force of guide wheel under AW3 load is 9.5 kN, which occurs at the left guide wheel of the 2-position frame. In the case of both AW0 and AW3 loads, the lateral forces exerted on the guide wheel did not surpass the design thresholds, which indicates that they conform to the design criteria.
Fig. 11Lateral force of guide wheel under AW0 load (1-position frame)
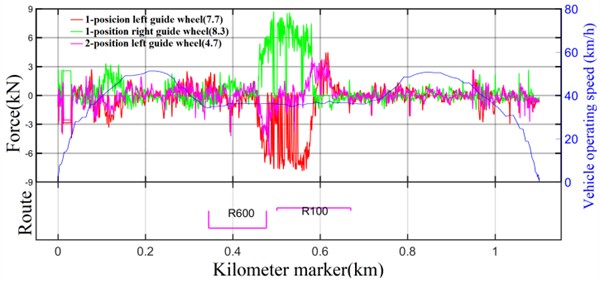
Fig. 12Lateral force of guide wheel under AW3 load (2-position frame)
4.3.4. Lateral force of stabilizing wheel
Like the lateral force of guide wheel, the lateral force of stabilizing wheel is also obtained from the dynamic lateral displacement of the tire relative to the track as measured by the laser sensor. Due to space constraints, only the results of the following driving intervals corresponding to the maximum values of the lateral force of stabilizing wheel are presented, as shown in Figs. 13-14. In particular, the maximum value of the lateral force of the stabilizing wheel under AW0 loading was 7.1 kN, which appeared in the left stabilizing wheel of the 1-position frame; the maximum value of the lateral force of the stabilizing wheel under AW3 loading was 7.5 kN, which appeared in the left stabilizing wheel of the 1-position frame. In the case of both AW0 and AW3 loads, the lateral forces exerted on the stabilizing wheel did not surpass the design thresholds, which indicates that they conform to the design criteria.
Fig. 13Lateral force of stabilizing wheel under AW0 load (1-position frame)
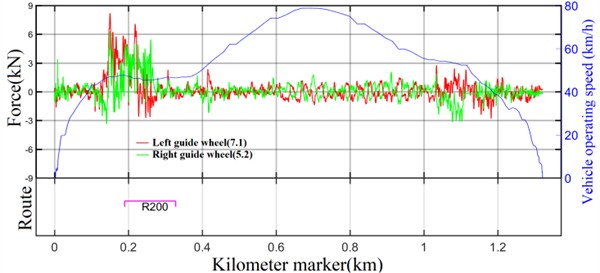
Fig. 14Lateral force of stabilizing wheel under AW3 load (1-position frame)
4.3.5. Three-direction torque
The three-direction torques are calculated as shown below: the rocking head torque is the product of the difference between the longitudinal force of the left and right side drawbars and half of the transverse span; the slewing torque is the product of the longitudinal force of the tires and the radius of the wheels; and the side-rolling torque is the product of the difference between the vertical force of the left and right side running wheels and half of the transverse span. According to the above calculation method, the following three-direction torque test results were obtained by measuring the relevant indexes, as shown in Table 5.
Table 5Statistics of maximum three-direction torque
Working condition | AW0 | AW3 | ||||
Rocking head torque kN.m | Slewing torque kN.m | Side-rolling torque kN.m | Rocking head torque kN.m | Slewing torque kN.m | Side-rolling torque kN.m | |
Emergency braking | 6.9 | 6 | \ | 0.9 | 8.9 | – |
Normal operation | 6.7 | 2.9 | 3.7 | 7.4 | 4.2 | 4.4 |
5. Hub dynamic stress
This section respectively test the dynamic stress levels in the wheel hubs of vehicles under AW0 (empty) and AW3 (heavy) loads, to assess the fatigue strength of the hubs according to the relevant guidelines. The rainflow counting (a time-domain fatigue analysis method to count cyclic stress/strain responses in dynamic signals) and average stress correction were performed on the dynamic stress time course, and the cumulative damage at the corresponding measurement point was analyzed and the equivalent stress amplitude was calculated according to Miner’s cumulative damage principle and the type of welded joint corresponding to each measurement point.
5.1. Measuring point arrangement
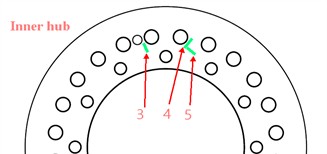
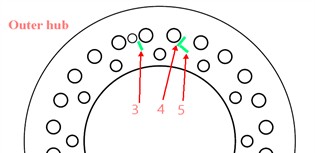
The dynamic stress measurement points of the inner hub are numbered as 3, 4, 5 and 7, and the dynamic stress measurement points of the outer hub are numbered as 3, 4, 5 and 8. Measurement points 3, 4 and 5 of the inner and outer hubs are shown in Fig. 15, and measurement point 7 of the inner hub is located at the back of the inner hub in the figure, symmetrical to the center of the hub with the measurement point 3; and measurement point 8 of the outer hub is located at the back of the outer hub in the figure, corresponding to the position of the measurement point 3.
Fig. 15Example of figure consisting of multiple charts
a) Inner hub dynamic stress measurement point
b) Outer hub dynamic stress measurement point
5.2. Test result
The sampling frequency of this test was 2400 Hz, and the dynamic stress time course obtained from this test was corrected for rainflow cycle counting and average stress to obtain 32 levels of zero-mean magnitude-frequency stress spectra. Due to the anomalies in individual data points during the test, the data anomaly measurement points were eliminated.
5.2.1. IIW standard wheel dynamic stress evaluation results
The measurement points were evaluated according to the equivalent stress amplitude calculation method in Section 2.2 and the fatigue strength assessment guidelines in Section 2.3, and the evaluation results are shown in Tables 6-7. AW0 condition has 1 point cumulative damage more than 0.5, does not meet the requirements; AW3 condition has 3 measurement points cumulative damage more than 0.5, does not meet the requirements, and one of the inner hub measurement point 3 equivalent stress amplitude up to 51.4 MPa, although does not exceed the fatigue limit of 51.5 MPa, but the calculated mileage is only 31,000 kilometers.
Table 6The equivalent stress amplitude and evaluation results of each measuring point under AW0 condition
Measurement point location | Maximum stress (MPa) | Minimum stress (MPa) | Stress amplitude (MPa) | Equivalent stress amplitude (MPa) | Calculating mileage (104km) | Cumulative damage |
Inside Hub 3 | 29.3 | –22.6 | 25.9 | 24.5 | 129 | 0.77338 |
Inside Hub 4 | 24.7 | –27.1 | 25.9 | 16.6 | 889 | 0.11247 |
Inside Hub 5 | 8.7 | –7.2 | 8.0 | 2.1 | 26256756 | 0.00000 |
Inside Hub 7 | 7.4 | –6.9 | 7.1 | 1.6 | 115355112 | 0.00000 |
Outer Hub 3 | 17.2 | –13.2 | 15.2 | 9.1 | 18474 | 0.00541 |
Outer Hub 4 | 16.5 | –11.5 | 14.0 | 7.8 | 39675 | 0.00252 |
Outer Hub 5 | 16.3 | –13.5 | 14.9 | 10.1 | 10897 | 0.00918 |
Outer Hub 8 | 54.7 | –32.2 | 43.4 | 19.4 | 417 | 0.24008 |
Table 7The equivalent stress amplitude and evaluation results of each measuring point under AW3 condition
Measurement point location | Maximum stress (MPa) | Minimum stress (MPa) | Stress amplitude (MPa) | Equivalent stress amplitude (MPa) | Calculating mileage (104km) | Cumulative damage |
Inside Hub 3 | 46.8 | –32.5 | 39.7 | 51.4 | 3.1 | 31.81462 |
Inside Hub 4 | 37.0 | –27.7 | 32.3 | 34.9 | 22.0 | 4.54828 |
Inside Hub 5 | 9.6 | –8.0 | 8.8 | 2.9 | 5140807.5 | 0.00002 |
Inside Hub 7 | 8.1 | –8.2 | 8.2 | 2.2 | 19987422.0 | 0.00001 |
Outer Hub 3 | 25.6 | –18.1 | 21.9 | 18.5 | 527.2 | 0.18970 |
Outer Hub 4 | 23.2 | –17.1 | 20.2 | 14.8 | 1608.6 | 0.06217 |
Outer Hub 5 | 24.0 | –20.3 | 22.1 | 21.4 | 252.4 | 0.39614 |
Outer Hub 8 | 33.4 | –28.6 | 31.0 | 32.2 | 32.6 | 3.06624 |
5.2.2. Wheel dynamic stress during emergency braking
Fig. 16 shows the variation of dynamic stresses in the wheel hub during emergency braking under AW3 loading, and it can be clearly seen that at the moment of emergency braking, there is no abnormal change in the dynamic stresses in the wheel hub, and the magnitude of the value tends to stabilize.
5.2.3. Wheel dynamic stress principal frequency analysis
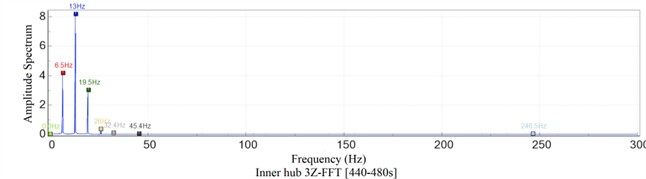
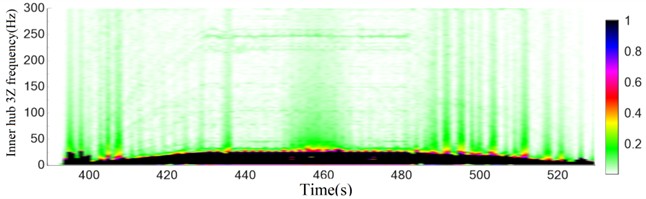
After processing the data with Fast Fourier Transform (FFT) and Short-Time Fourier Transform (SFFT), as depicted in Fig. 17(a), the primary frequencies of the hub dynamic stresses are distinctly identified as 6.5 Hz, 13 Hz, and 19.5 Hz. These frequencies correspond precisely to the rotational, twofold, and threefold frequencies, respectively. Notably, the 35th-order tire shoulder polygon wear frequency (a wear pattern on the tire shoulder that resembles a polygon), which is often of interest in such analyses, is not prominently evident in the hub dynamic stress spectrum. In Fig. 17(b), it is clearly observable that throughout the entire time period, the energy components below 20 Hz exhibit relatively higher magnitudes. This indicates that the hub dynamic stresses are predominantly influenced by these lower-frequency components, highlighting their significant role in the overall dynamic behavior of the hub.
Fig. 16Dynamic stress of hub during emergency braking under AW3 load
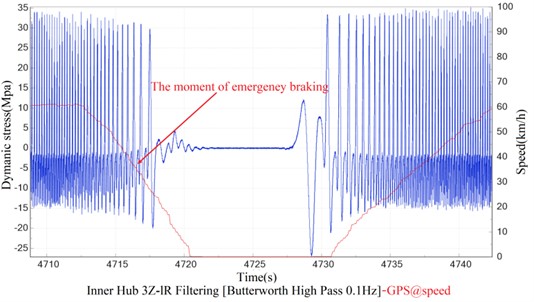
Fig. 17Dynamic stress spectrum analysis of hub under AW3 load
a) Magnitude-frequency diagram
b) Time-frequency diagram
5.2.4. Effect of polygon wear on dynamic stresses in hub
From section 5.2.3, it can be seen that the polygon wear frequency hub dynamic stress effect is not obvious, in order to further verify, this section of the AW3 load dynamic stress raw data for polygonal frequency bandstop filtering(a signal processing technique), to remove the effect of polygonal vibration (vibration caused by polygonal wear) on the dynamic stress of the hub, the comparison results are shown in Table 8, all the points of the original cumulative damage and the cumulative damage after the bandstop filtering error of not more than 5 %, it can be seen that the tire shoulder polygonal It can be seen that the shoulder polygonal wear has little effect on the dynamic stress of the wheel hub.
Table 8The influence of shoulder polygon on dynamic stress of wheel hub under AW3 load
Measurement point location | Equivalent stress amplitude (MPa) | Cumulative damage | ||
Initial | Bandstop filtering | Initial | Bandstop filtering | |
Inside Hub 3 | 51.4 | 51.4 | 31.81462 | 31.72966 |
Inside Hub 4 | 34.9 | 34.8 | 4.54828 | 4.50702 |
Inside Hub 5 | 2.9 | 2.9 | 0.00002 | 0.00002 |
Inside Hub 7 | 2.2 | 2.2 | 0.00001 | 0.00000 |
Outer Hub 3 | 18.5 | 18.5 | 0.18970 | 0.18889 |
Outer Hub 4 | 14.8 | 14.7 | 0.06217 | 0.06074 |
Outer Hub 5 | 21.4 | 21.4 | 0.39614 | 0.39197 |
Outer Hub 8 | 32.2 | 32.0 | 3.06624 | 2.94940 |
6. Conclusions
This paper analyzes wheel anomalies occurring in a straddle monorail vehicle, and performs tire six component force tests as well as wheel dynamic stress fatigue strength tests. The results show that the maximum dynamic loads of the vertical force of the running wheel, the lateral force of the guide wheel and the lateral force of the stabilizing wheel are all within the limit load range and have a certain safety margin; In the AW0 condition, there is one measurement point with accumulated damage over 0.5, which does not meet the requirements; in the AW3 condition, there are three measurement points with accumulated damage over 0.5, which does not meet the requirements, of which the equivalent force amplitude of the inner hub measurement point 3 reaches 51.4 MPa, although it does not exceed the fatigue limit of 51.5 MPa, but the calculated mileage is only 31,000 kilometers, and the rest of the test indexes do not see any abnormality; at the moment of emergency braking, there is no abnormal change in wheel dynamic stresses, and the tire shoulder polygon wear has little effect on wheel dynamic stresses. This paper analyzes the factors affecting the wheel strength of the straddle monorail vehicles through the test, and the tire six component force test and the wheel hub dynamic stress test of the vehicle provides an important reference for the subsequent design of the wheel hub.
Based on the findings and limitations of this study, several future research directions can be proposed. Firstly, more in-depth studies should be carried out to explore the impact of real-world environmental factors on tire and wheel hub performance. This could involve conducting field tests in various climates and road conditions. Secondly, advanced simulation techniques could be employed to model the tire-wheel hub-vehicle-road interactions more accurately, taking into account the non-uniformity of materials and complex dynamic behaviors. At the same time, topological optimization of the fillet radius can be carried out, or the bolt installation mode can be redesigned to reduce the fatigue damage of the hub.
References
-
J. B. Ma, “Research on static and dynamic behavior of straddle monorail transit system structure,” Master’s thesis, Southwest Jiaotong University, China, 2008.
-
X. He, “Application and prospect of straddle monorail transit system in China,” Urban Rail Transit, Vol. 1, No. 1, pp. 26–34, May 2015, https://doi.org/10.1007/s40864-015-0006-9
-
J. Q. Zhang, “Research on dynamics of straddle monorail cars,” Master’s thesis, Southwest Jiaotong University, China, 2009.
-
X. G. Zhu, “Analysis of the bogie structure of straddle monorail vehicles,” Master’s thesis, Chongqing Jiaotong University, China, 2011.
-
Z. Yang, Z. Du, Z. Xu, J. Zhou, and Z. Hou, “Research on dynamic behavior of train dynamic model of straddle-type monorail,” Noise and Vibration Worldwide, Vol. 51, No. 11, pp. 195–207, Aug. 2020, https://doi.org/10.1177/0957456520947998
-
Z. X. Du, Y. C. Li, and Z. H. Liang, “Research on curve through safety of straddle-type monorail vehicle,” Electric Drive for Locomotives, Vol. 1, pp. 79–83, 2016, https://doi.org/10.13890/j.issn.1000-128x.2016.01.017
-
Z. Z. Xu, Z. X. Du, L. Xin, and Z. Yang, “Study on equivalent calculation of rigid flexible coupling dynamics of straddle monorail,” Mechanical Design and Manufacturing, Vol. 6, pp. 278–281, 2022, https://doi.org/10.19356/j.cnki.1001-3997.20211229.017
-
X. X. Wen, “Research on the mechanism and control method of tire eccentric wear of straddle type monorail vehicles,” Ph.D. thesis, Chongqing Jiaotong University, China, 2018.
-
Z. Yao, Y. Wei, and J. Lv, “A heavy load tire six-component force sensor,” International Journal of Frontiers in Engineering Technology, Vol. 3, No. 3, Jan. 2021, https://doi.org/10.25236/ijfet.2021.030304
-
L. H. Ren, J. S. Zhou, G. Shen, and G., “Dynamics model and simulation study of a straddle type monorail car,” China Railway Science, Vol. 5, pp. 28–34, 2004, https://doi.org/10.3321/j.issn:1001-4632.2004.05.005
-
L. J. Shen and J. Q. Zhang, “Analysis of mechanical property of straddle monorail vehicle based on tyre,” Electric Drive for Locomotives, Vol. 4, pp. 22–26, 2019, https://doi.org/10.13890/j.issn.1000-128x.2019.04.006
-
D. Lu and D. H. Xia, “Research Progress on prediction of force and moment characteristics of automobile tire,” Tire Industry, Vol. 41, No. 3, pp. 185–189, 2021, https://doi.org/10.12135/j.issn.1006-8171.2021.03.0185
-
Z. Y. Ji, “Fatigue life analysis of frame with measured six-component wheel force,” Mechanical design and manufacturing, Vol. 353, No. 7, pp. 25–28, 2020, https://doi.org/10.19356/j.cnki.1001-3997.2020.07.007
About this article

The authors have not disclosed any funding.
The datasets generated during and/or analyzed during the current study are available from the corresponding author on reasonable request.
All authors contributed to the study conception and design. Material preparation, data collection and analysis were performed by Zengchuang Zhao and Pingbo Wu. Paper writing guidance, paper modification and improvement were performed by Lihui Ren. All authors not only offered their comments on the previous versions of the manuscript but also carefully read and unanimously approved the final manuscript.
The authors declare that they have no conflict of interest.
