Abstract
The preload of bolt connection affects the dynamic response of vertical pipeline structures, which has an important influence on the vibration and noise of hydraulic systems. Based on ANSYS, the finite element analysis model of the prestressed modal of the vertical pipeline connection unit was established. The clamp model was simplified by the equivalent stiffness test and fitting method. Under different preload torque conditions, the natural frequency and mode shape of the pipeline were solved. The modal test platform was established based on the hammering method to verify the error of modal calculation. The harmonic response analysis of the vertical pipeline was carried out, and the accuracy of the simulation analysis was verified by the frequency response test of the power flow parameters. The research results show that the preload load of the bolt has a limited influence on the modal characteristics of the connected pipeline. When the preload torque is about 8 N·m, the structural stiffness tends to be balanced, and under external excitation conditions, no large resonance amplitude will occur.
Highlights
- Based on ANSYS, the finite element analysis model of the prestressed modal of the verticalpipeline connection unit was established.
- The clamp model was simplified by the equivalent stiffness test and fitting method.
- Under different preload torque conditions, the natural frequency and mode shape of the pipeline were solved.
1. Introduction
In the aerospace sector, piping systems are often exposed to very complex operating environments. The aviation pipeline system is generally composed of pump, valve, oil filter and other components as well as the pipeline, clamp and pipe joint between them. It provides power for the retraction and retraction of landing gear on the aircraft, and realizes different control tasks such as turning and braking. It is very important to maintain the normal operation of the aircraft [1, 2]. Piping systems on aircraft may be excited by internal fluids or vibration from external machinery such as plunger pumps, engines, actuators, etc. during operation, resulting in piping deformation and piping vibration [3, 4]. The large number, long span and complex structure of aircraft pipelines, combined with the complexity of the working environment, also increase the difficulty of the research on the vibration characteristics of the pipeline system [5]. Joints in vertical piping systems are widely distributed and numerous, and are distributed almost in all parts of the aircraft body [6]. If the vibration frequency of the external environment is very close to the natural frequency of the pipeline itself, the pipeline system will generate structural resonance, which will lead to pipeline failure in serious cases, and bring serious hidden dangers to the safe operation of the aircraft. In aircraft flight, accidents caused by pipeline system failure or pipe joint failure are common. During the development of new aircraft, failures such as wear and tear of pipelines and leakage of pipe joints occur frequently, and the proportion of pipeline failures caused by the above reasons in the manufacturing process of aircraft is about 71 %. For pipelines that connected by bolts, modal analysis can clarify the specific impact of bolt preload on the natural frequency during vibration, ensuring structural stability. In subsequent research, the results obtained from preload modal analysis can provide a strong basis for the structural optimization of pipelines and bolt connections.
2. Modal analysis of vertical piping system
2.1. Establishment and setting of finite element model
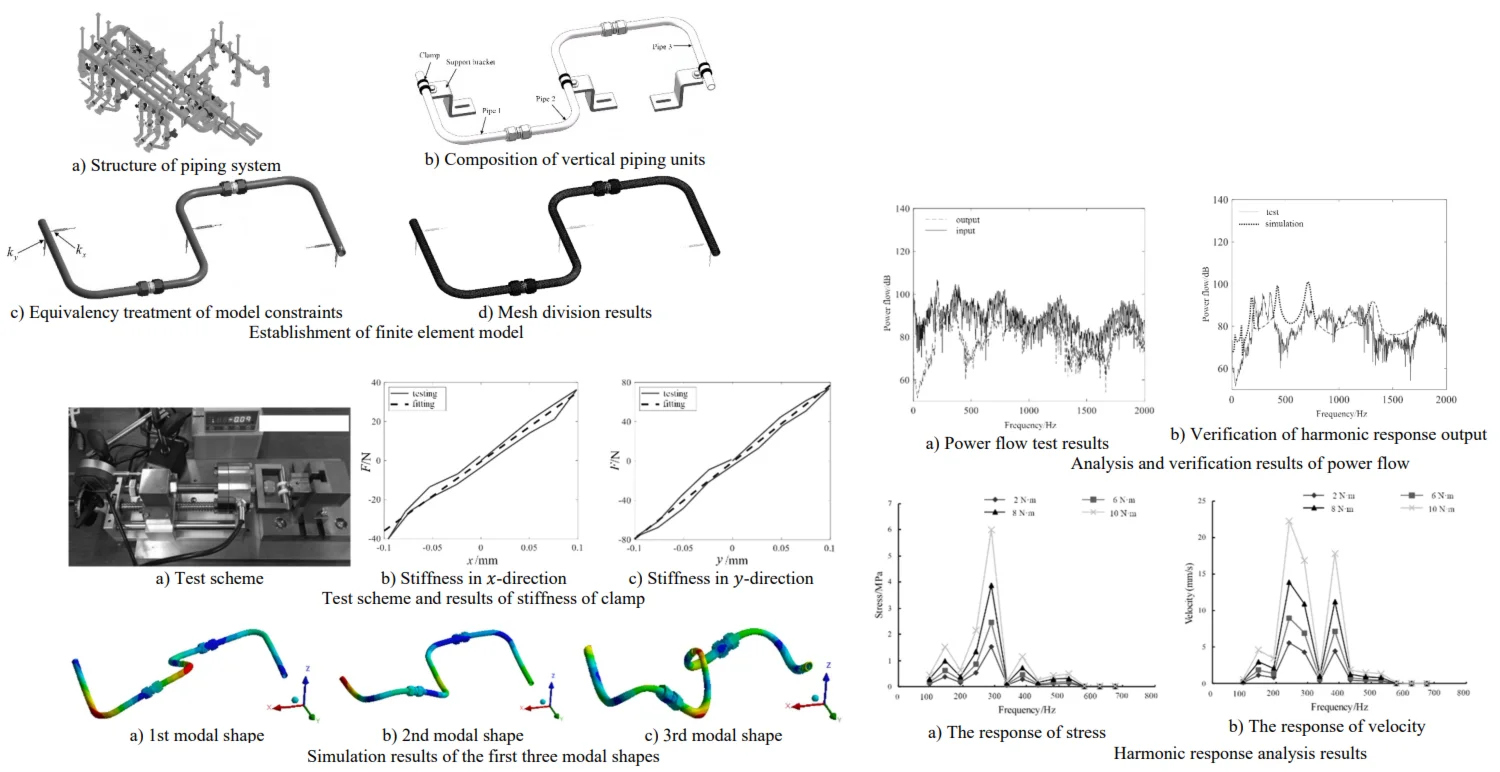
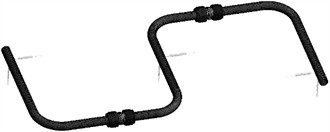
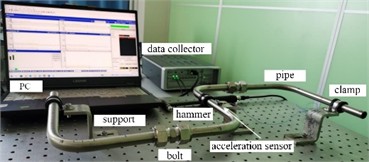
Considering the mechanical excitation of the pump source, the vertical piping system with joints is modeled as shown in Fig. 1(a) and Fig. 1(b). The pipe joint is a ferrule-type pipe joint. The clamp and support are the aviation gasket clamp and Z-shaped support used for fixing a single pipeline. The clamp and support are fixed by bolts. Due to the complex structure of the system, the supporting structure is reasonably equivalent or simplified during the finite element modeling and simulation analysis. As shown in Fig. 1(c), the clamp is simplified into a support constraint with stiffness of and respectively according to the different stiffness in different directions. SOLID186 cells are used to define the mesh type of the model. As one end of the spring is connected to the pipeline and the other end is connected to the ground, the spring stiffness is set as the sum of measured clamp stiffness and support stiffness. The mesh is divided by hexahedral mesh, in which the number of integral finite element model elements is 27234 and the number of nodes is 143534. The results of the finite element mesh division are shown in Fig. 1(d).
The test scheme of clamp stiffness is shown in Fig. 2(a). The test device includes lead screw slide loading mechanism, force sensor, force sensor display instrument, dial indicator and clamp fixing platform. During the test, use the magnetic meter base to fix the dial indicator on the base to ensure the accuracy of the test results. During the test, the lead screw slide table mechanism is used for loading, and the loading hand wheel can be controlled to apply tensile pressure to the clamp. The displacement of the clamp is directly displayed on the display screen of the dial indicator, and the tensile pressure is displayed on the external force sensor display instrument. The instrument is zeroed and commissioned before the test. Throughout the test, the clamp wire stiffness was tested in the sequence of forward loading - forward unloading - reverse loading - reverse unloading. Because there may be errors in the manufacturing process of the clamp, when the clamp is tested for stiffness, the data is processed and calculated by taking the average of two tests, and the stiffness of the clamp in the x and y directions is obtained, as shown in Fig. 2(b) and Fig. 2(c).
Fig. 1Establishment of finite element model
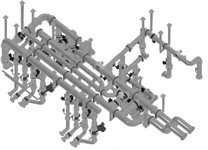
a) Structure of piping system
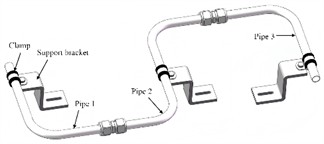
b) Composition of vertical piping units
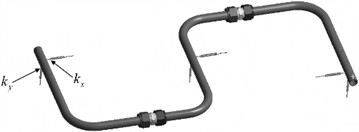
c) Equivalency treatment of model constraints
d) Mesh division results
2.2. Modal analysis based on simulation and testing
The modal characteristics of pipeline system are inherent properties of itself, related to materials and structures, and independent of external loads. Natural frequency and modal shape can be obtained through modal calculation. In order to obtain the natural frequencies and modal shapes of the complex pipeline system considering joint connection, the finite element simulation analysis method can be used for modal simulation and analysis. Simulation results of the first three modal shapes are shown in Fig. 3. It can be seen that the maximum vibration displacement is distributed at the corner of the vertical pipe. In order to ensure the reliability of the simulation results, experimental methods need to be used for further verification of modal analysis.
Fig. 2Test scheme and results of stiffness of clamp
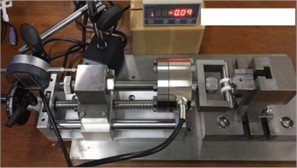
a) Test scheme
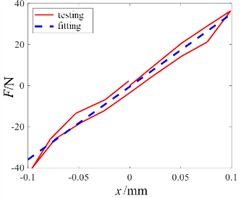
b) Stiffness in -direction
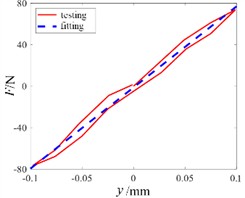
c) Stiffness in -direction
Fig. 3Simulation results of the first three modal shapes
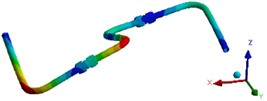
a) 1st modal shape
b) 2nd modal shape
c) 3rd modal shape
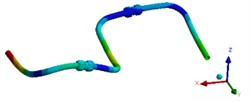
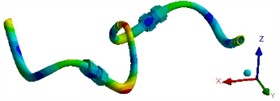
The scheme of modal experiment is shown in Fig. 4. Fix the pipeline on the base through the clamp and Z-type support, change the tightening torque of the pipe joint through the torque wrench, and test the inherent characteristics of the pipeline system by hammering under the action of the tightening torque of 8 N·m. During the test, the impact testing module of the data acquisition system supporting test software was used to establish a complex pipeline model considering the connection of joints in the geometry unit. Mark a point every 4 cm on the straight pipe part and every 1cm on the elbow part of the pipeline system. The modal test of the pipeline was carried out by hammering method, and the position of the acceleration sensor remained unchanged in the test. Start from the first marked point at the left end of the pipeline with a hammer and knock each point on the pipeline in turn, in order to eliminate the interference of external factors and maintain the accuracy of the test results. Each node is hammered five times, and the results are analyzed and processed in the data acquisition system. The natural frequencies of the complex pipeline system considering joint connection are shown in Table 1, and the vibration mode results are shown in Fig. 5.
Fig. 4The scheme of modal experiment
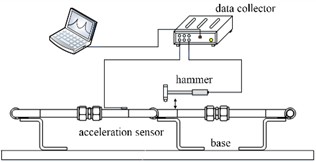
a) Principle of modal test
b) On-site modal test
Fig. 5Testing results of the first three modal shapes

a) 1st modal shape

b) 2nd modal shape

c) 3rd modal shape
Table 1Simulation and testing results of natural frequency
Order | Natural frequency / Hz | Error / % | |
Testing | Simulation | ||
1 | 172.2 | 187.1 | 8.7 |
2 | 556.5 | 579.2 | 4.1 |
3 | 1297.5 | 1389.7 | 7.1 |
Through the comparative analysis of Table 1 and Fig. 5, it can be known that the error between the simulated and measured natural frequencies is less than 10 %, and the modal shapes are consistent. The possible causes of error include torque wrench accuracy error, joint wear error and pipe joint stiffness error. In addition, the acceleration sensor can add little mass. In general, the experimental and simulation results are in good agreement, so the effectiveness of the model is verified. By simplifying the clamp with equivalent stiffness, high calculation accuracy and analysis efficiency can be obtained.
2.3. Influence of preload on natural frequency
Natural frequency under different condition of torque of preload can be obtained in Table 2. As the preload of the pipe joint bolts gradually increases, the natural frequency of the pipeline system also rises. This phenomenon can be explained by the relationship between the preload and the connection stiffness of the pipe joint. As the preload is applied by tightening the joint nuts, the connection stiffness between the pipes increases. Therefore, the overall structural stiffness of the pipeline system improves, leading to an increase in the natural frequency. When the connecting nuts are tightened, they compress the connection surface, reducing any potential gaps or looseness. This compression enhances the load transfer efficiency between the connected components, thereby increasing the effective stiffness of the connection. As the stiffness increases, the system becomes less flexible, which in turn raises its natural frequency. However, there is a critical point beyond which further increases in preload yield diminishing returns. Specifically, when the tightening torque reaches 8 N·m, the rate of increase in the natural frequency begins to slow down. At this torque level, the connection stiffness of the pipe joint starts to increase more slowly and eventually stabilizes. This stabilization occurs because the material of the joint reaches its maximum deformation limit under the applied force. Beyond this point, further tightening does not significantly alter the mechanical properties of the joint. In practical applications, this behavior is of great significance for the design and maintenance of pipeline systems. It is necessary to carefully consider the optimal preload to achieve an ideal balance between ensuring sufficient stiffness and avoiding over-tightening, which could lead to material failure or other issues.
Table 2Natural frequency under different condition of torque of preload
Order | Torque of preload / N·m | 2 | 6 | 8 | 10 | 14 | 16 |
Natural frequency / Hz | 1 | 164.3 | 181.3 | 187.1 | 188.2 | 189.6 | 192.0 |
2 | 542.8 | 573.4 | 579.2 | 582.7 | 588.1 | 589.2 | |
3 | 1323.1 | 1379.6 | 1389.7 | 1394.6 | 1399.3 | 1406.4 |
3. Harmonic response analysis of vertical piping system
3.1. Setting of analysis conditions
The significance of pipeline harmonic response analysis is to evaluate the dynamic response characteristics of the structure under periodic loads. Through harmonic response analysis, the dynamic response of the pipeline under specific frequency vibration load can be predicted, so as to ensure the reliability and safety of the pipeline under actual working conditions. Harmonic response analysis is helpful to identify resonance phenomenon and avoid structural damage or failure caused by resonance. The theoretical basis of harmonic response analysis is mainly based on the principle of linear dynamics. The dynamic response of the structure is obtained by solving the motion equation of the structure under harmonic excitation. Mathematically, this usually involves solving ordinary differential equations or partial differential equations, which describe the vibration behavior of structures subjected to periodic external forces. Through Fourier transform, the load in time domain can be transformed into the response in frequency domain, and then the response characteristics of the structure at different frequencies can be analyzed. Harmonic response analysis usually uses numerical methods, such as finite element analysis (FEA), to solve these equations and obtain the response curves of the structure at different frequencies. If the simulation results of power flow are verified by test, the harmonic response of stress peak and velocity peak under different preloads can be calculated based on the finite element method.
Complete method or mode superposition method can be adopted for harmonic response analysis. During harmonic response analysis, exciting load is applied to the pipeline, the load is set as 2 N·m. Respectively set the extraction positions of I/O response on the pipeline, as shown in Fig. 6(a). In order to quantify, the power flow is selected to measure the vibration transmission characteristics of the pipeline system. Through finite element analysis and considering the characteristics of joint connection, the harmonic response analysis and calculation of complex pipeline system can be realized, and the power flow response under a given excitation can be obtained. In order to verify the harmonic response simulation results, the experimental test scheme is designed as shown in Fig. 6(b). In the test, the wall plate with a wall thickness of 3 mm is fixed on the base of the vibration table by bolts. Set the excitation value as 1g and the frequency range as 10-2000 Hz in the relevant supporting software of the vibration table, and the vibration table will generate sweeping excitation. The force sensor and acceleration sensor collect the feedback signal of the wall panel and take it as the input signal of the pipeline system.
Fig. 6Simulation and test models for harmonic response analysis
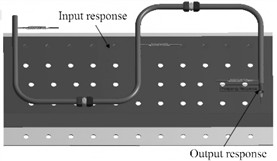
a) Simulation model
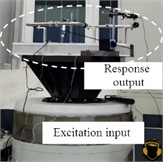
b) Test of excitation application
3.2. Result analysis and discussion
Analysis and verification results of power flow is shown in Fig. 7. It can be seen that the power flow calculated based on the finite element method has a high match with the experimental results, and a high calculation accuracy can be obtained. The input and output of vibration signal have no abnormal problem, and the result is reliable and stable. The advantage of using the complete method for harmonic response analysis is that the solution is accurate and can support the time-dependent displacement load and most of the constraint forms. However, the calculation time of the complete method is longer than that of the mode superposition method because the sparse matrix is used to solve the complex calculation equations. Due to the need to apply a time-dependent displacement load to the pipeline structure and the good performance of the workstation used to solve the results in a short time, the full method is used to solve the harmonic response analysis.
By conducting vibration harmonic response analysis on the boundary of the vertical pipeline, the stress peak response curve and velocity peak response curve at the output end were obtained as shown in Fig. 8. According to the results of the harmonic response analysis, it can be seen that with the increase of the preload force, the stress peak and the velocity peak show a significant increasing trend at each vibration frequency. When the moment of the preload force is 8 N·m, both the stress and the velocity are within the good working range, and at this time, the overall structure's stiffness is relatively stable, which can effectively resist the influence of fatigue loads.
Fig. 7Analysis and verification results of power flow
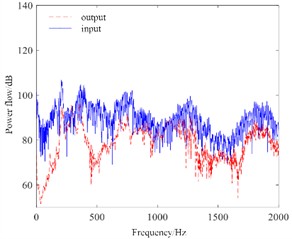
a) Power flow test results
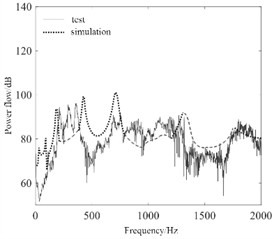
b) Verification of harmonic response output
Fig. 8Harmonic response analysis results
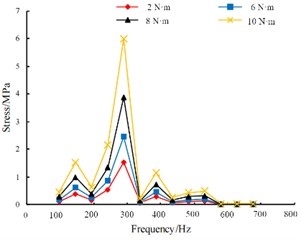
a) The response of stress
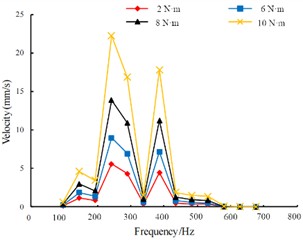
b) The response of velocity
4. Conclusions
1) According to modal analysis, the influence of preload on the natural frequency is limited. For the vertical pipeline system, when the moment of the preload is approximately equal to 8 N·m, the stiffness region is stable. According to the harmonic response analysis, under this preload condition, both the stiffness and strength criteria can be simultaneously met, which is conducive to improving the vibration response characteristics.
2) The harmonic response analysis of the pipeline structure was conducted using finite element method, and the dynamic response of the pipeline under periodic loads was successfully predicted. The analysis results are helpful for optimizing pipeline design and evaluating structural safety. Future research can further consider complex situations such as nonlinear factors and fluid structure coupling effects to improve the accuracy of analysis.
References
-
W. Liu, W. Cai, L. Kang, and Y. Fang, “Research on ultrasonic guided wave pipeline defect detection method based on modal analysis,” in Journal of Physics: Conference Series, Vol. 2834, No. 1, p. 012078, Oct. 2024, https://doi.org/10.1088/1742-6596/2834/1/012078
-
J. Huang and J. Liu, “Strength constrained topology optimization of hyperealstic structures with large deformation-induced frictionless contact,” Applied Mathematical Modelling, Vol. 126, No. 2, pp. 67–84, Feb. 2024, https://doi.org/10.1016/j.apm.2023.10.032
-
D. Zhu et al., “Noise and vibration performance of automotive disk brakes with laser-machined M-shaped grooves,” Proceedings of the Institution of Mechanical Engineers, Part D: Journal of Automobile Engineering, Vol. 237, No. 5, pp. 978–990, Apr. 2022, https://doi.org/10.1177/09544070221085972
-
H. Li, G. Wang, B. Wei, H. Liu, and W. Huang, “Improved variational mode decomposition method for vibration signal processing of flood discharge structure,” Journal of Vibration and Control, Vol. 28, No. 19-20, pp. 2556–2569, May 2021, https://doi.org/10.1177/10775463211016132
-
S. Gaygol and K. Wani, “Modal analysis of plate to analyze the effect of mass stiffeners using the Chladni plate approach,” Materials Today: Proceedings, Vol. 72, No. 3, pp. 1314–1321, Jan. 2023, https://doi.org/10.1016/j.matpr.2022.09.305
-
X. Li, D. Zhao, H. Zhai, M. Chen, and T. Zhang, “Modal analysis of circular arches in rectangular coordinate system,” Structures, Vol. 47, No. 1, pp. 2129–2137, Jan. 2023, https://doi.org/10.1016/j.istruc.2022.12.036
About this article

The authors have not disclosed any funding.
The datasets generated during and/or analyzed during the current study are available from the corresponding author on reasonable request.
The authors declare that they have no conflict of interest.
