Abstract
To explore the seismic response behavior of long-span continuous rigid-frame bridges, this study selects an asymmetric high-pier long-span continuous rigid-frame bridge as the subject. A finite element model is developed, and a thorough examination is conducted on both the dynamic performance and seismic response patterns of the bridge. The main findings are as follows: The fundamental frequency is determined as 0.167 Hz, corresponding to a natural period of 5.975 s, which is lower than that of ordinary continuous rigid-frame bridges, thus confirming that high-pier bridges tend to behave as more flexible structural systems. Both the dynamic characteristics and seismic responses of the considered asymmetric bridge exhibit clear asymmetry; the internal force responses of main piers 6# and 9#, as well as transition piers 4# and 12#, differ remarkably under seismic excitations, a fact that deserves particular attention in seismic design. The outcomes of this research are expected to provide a useful reference for the seismic design of similar bridge structures.
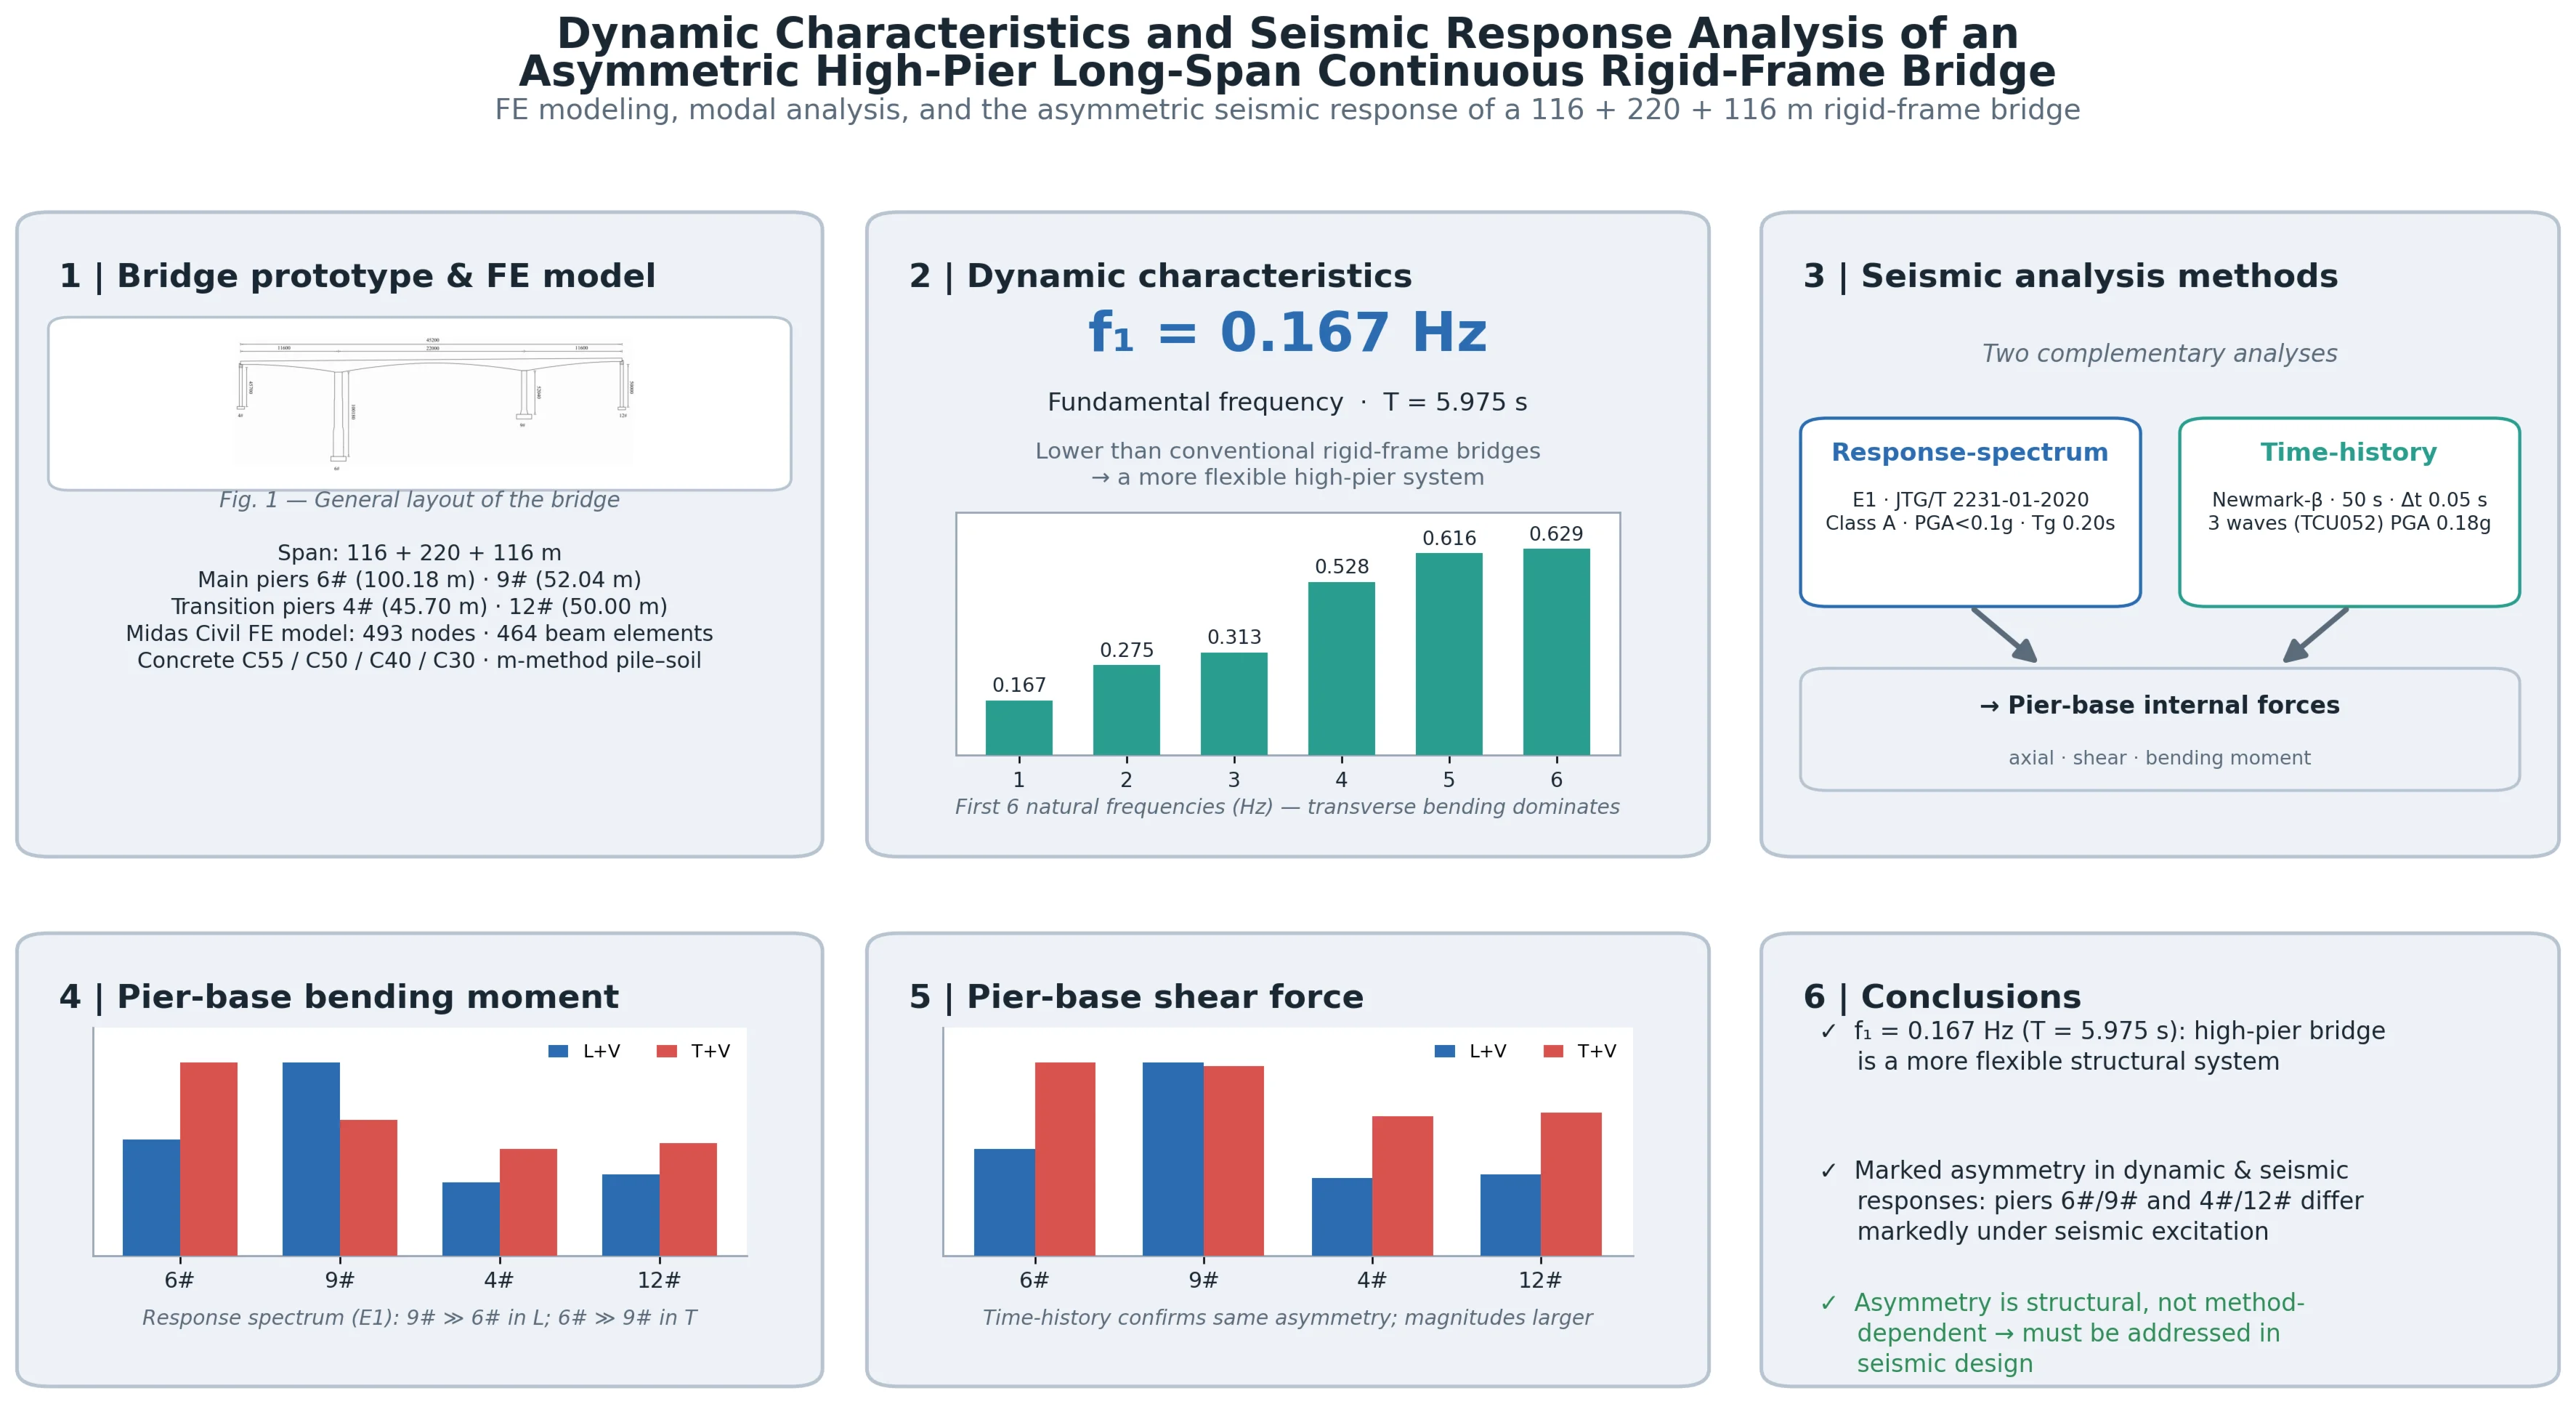
Highlights
- Combining the response spectrum method with nonlinear time-history analysis confirms that the response differences between the main and auxiliary piers mainly arise from structural asymmetry rather than the calculation method, providing a reference for seismic design of similar bridges.
- With a fundamental frequency of only 0.167 Hz (period 5.975 s), lower than conventional rigid-frame bridges, the first three modes are dominated by transverse bending, indicating a more flexible high-pier system with relatively low transverse stiffness.
- The main piers exhibit bending–torsion coupling due to the non-coincidence of stiffness and mass centers. Under longitudinal seismic excitation, short pier 9# bears larger forces, whereas under transverse seismic excitation, tall pier 6# experiences larger bending mom
1. Introduction
China is located in a seismically active region, where ground motions have a significant impact on bridge structures. Seismic analysis and research have therefore become an essential part of bridge structural design [1-3]. With the rapid development of national transportation infrastructure in recent years, continuous rigid-frame bridges have been widely adopted for bridges with spans ranging from 100 m to 250 m, owing to their strong spanning capability [4-5]. When crossing complex terrains such as valleys, continuous rigid-frame bridges often adopt high-pier and long-span configurations, which are frequently accompanied by pronounced structural flexibility, rendering the seismic response of such structures relatively complex [6-8]. Consequently, in-depth investigations into the seismic performance of this type of structure and analyses of its seismic response patterns are of significant practical importance. Taking an asymmetric high-pier long-span continuous rigid-frame bridge as the research object, this paper establishes its finite element model and systematically analyzes the dynamic characteristics and seismic response patterns of the bridge. This study can provide an engineering reference for the seismic design of similar bridge structures.
2. Project overview
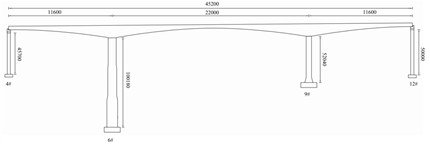
The bridge considered in the current study is a long-span prestressed concrete continuous rigid-frame bridge featuring asymmetric high piers. Its span layout is arranged as 116 m + 220 m + 116 m, and its general configuration is illustrated in Fig. 1. The main girder consists of a single-box single-cell variable-depth box girder. The top flange width is 12.00 m, the bottom flange width is 6.50 m, and the cantilever overhang is 2.75 m. The girder depth measures 13.40 m at the support section and 4.00 m at midspan. The bottom slab thickness decreases gradually from 120 cm at the root to 32 cm at midspan, while the web thickness varies in steps of 105 cm, 95 cm, 80 cm, 65 cm, and 50 cm along the girder length.
Piers 6# and 9# are the main piers, both monolithically connected to the main girder. Pier 6# has a height of 100.18 m and is a three-segment variable-section hollow pier, whereas pier 9# has a height of 52.04 m and is a uniform-section hollow pier. Piers 4# and 12# are transition piers, with heights of 45.70 m and 50.00 m, respectively, both adopting uniform-section hollow sections. The foundations of the main piers consist of separated pile caps and group pile foundations.
Fig. 1General layout of the bridge (unit: mm)
3. Finite element modeling and parameter selection
3.1. Spatial finite element model
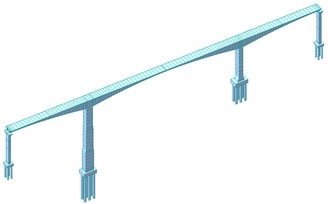
The entire bridge is modeled in Midas Civil with 493 nodes and 464 elements, as displayed in Fig. 2. All primary structural components – including the main girder, main piers, and transition piers – are idealized as beam elements. The global coordinate system is set with the -axis pointing longitudinally, the -axis transversely, and the -axis vertically. The pile-soil interaction is accounted for via the m-method. To represent the monolithic connection between the main piers and the superstructure, rigid links are introduced; meanwhile, at the transition pier locations, bearing supports are modeled by restraining longitudinal displacements while allowing transverse movements.
Fig. 2Full-bridge finite element model
3.2. Material parameters
In this bridge, the main girder, auxiliary piers, main piers, and pile foundations are modeled using C55, C40, C50, and C30 concrete, respectively, with elastic moduli of 3.55×10⁴ MPa, 3.45×10⁴ MPa, 3.25×10⁴MPa, and 3.00×10⁴MPa, respectively. Strand1860 steel strands are employed to simulate the prestressing tendons, which have an elastic modulus of 1.95×10⁵ MPa.
4. Dynamic characteristic analysis
The Lanczos method is used for dynamic characteristic analysis of the high-pier long-span continuous rigid-frame bridge. A total of 150 modes are computed, and the first six dominant modes are compared with Ref. [8] to ensure modal accuracy, as shown in Table 1. The cumulative modal participating mass in each direction is verified to exceed 98 %. Table 2 lists the frequencies, periods, and mode shape characteristics of the first 10 modes, and Fig. 3 shows the first 6 mode shapes.
Table 1Comparison of modal parameters between the present model and Ref. [8]
Mode number | This study | Ref. [8] | Deviation | This study | Ref. [8] | Deviation |
1 | 0.167 | 0.168 | 0.16 % | 5.975 | 5.952 | 0.38 % |
2 | 0.275 | 0.284 | 3.27 % | 3.631 | 3.521 | 3.03 % |
3 | 0.313 | 0.311 | 0.64 % | 3.197 | 3.215 | 0.56 % |
4 | 0.528 | 0.521 | 1.34 % | 1.894 | 1.919 | 1.32 % |
5 | 0.616 | 0.613 | 0.49 % | 1.622 | 1.631 | 0.55 % |
6 | 0.629 | 0.627 | 0.32 % | 1.590 | 1.595 | 0.31 % |
As shown in Table 1, the maximum differences in frequency and period between the two are 3.27 % and 3.03 %, respectively, while the remaining values are generally close, confirming the model’s accuracy and reliability for subsequent analysis.
Table 2Frequencies and mode shapes
Mode number / | Frequency / Hz | Period / s | Mode shape characteristics |
1 | 0.167 | 5.975 | Transverse bending of pier 6# |
2 | 0.275 | 3.631 | Main girder symmetric transverse bending |
3 | 0.313 | 3.197 | Main girder symmetric transverse bending |
4 | 0.528 | 1.894 | Main girder longitudinal drift |
5 | 0.616 | 1.622 | Pier 12# longitudinal bending (transition pier) |
6 | 0.629 | 1.590 | Main girder antisymmetric transverse bending |
7 | 0.710 | 1.409 | Pier 4# longitudinal bending (transition pier) |
8 | 0.860 | 1.163 | Pier 12# transverse bending (transition pier) |
9 | 0.985 | 1.015 | Pier 4# transverse bending (transition pier) |
10 | 1.004 | 0.996 | Main girder symmetric vertical bending |
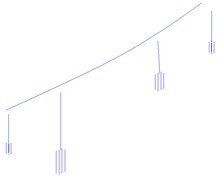
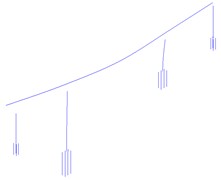
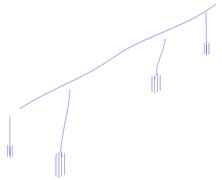
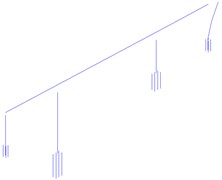
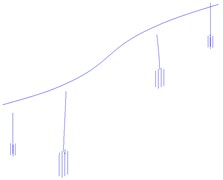
Fig. 3Structural natural vibration mode shapes (first six modes)
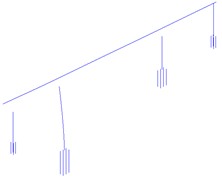
a)0.167 Hz
b) 0.275 Hz
c)0.313 Hz
d)0.528 Hz
e) 0.616 Hz
f)0.629 Hz
Table 2 and Fig. 3 show that the bridge has a fundamental frequency of 0.167 Hz (period 5.975 s), lower than conventional continuous rigid-frame bridges, indicating a more flexible high-pier system. The first three modes are governed by transverse bending of the girder or piers, reflecting relatively low transverse stiffness. This significantly amplifies the transverse seismic response, likely causing large lateral displacements and potential instability first in this direction.
5. Seismic response analysis
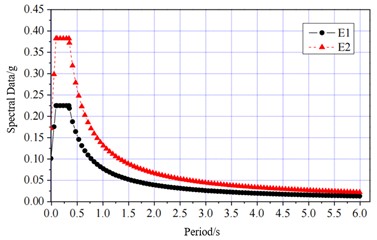
Per the Specifications for Seismic Design of Highway Bridges (JTG/T 2231-01-2020) [9] and the design drawings, the bridge is Class A, with a basic seismic peak ground acceleration below 0.1g, a response spectrum characteristic period of 0.20 s, and a fortification intensity below VI. Because response spectrum values are highly sensitive to damping ratio and the Chinese code uses 0.05 as the baseline, the method for determining the horizontal design acceleration response spectrum S under seismic excitation is established accordingly.
Since the seismic response analysis procedures under both the E1 and E2 earthquake levels are identical, and the shapes of their response spectra are the same – differing only in the peak spectral values due to different return periods – this paper conducts only the seismic response analysis for the E1 earthquake level.
Fig. 4Acceleration response spectrum curve
5.1. Response spectrum analysis
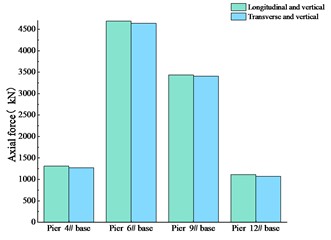
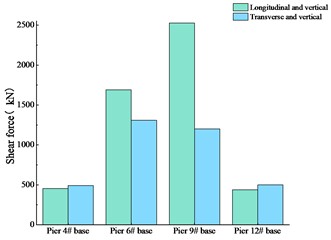
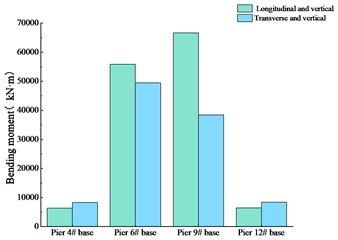
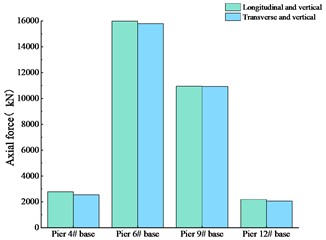
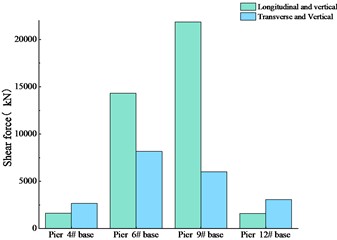
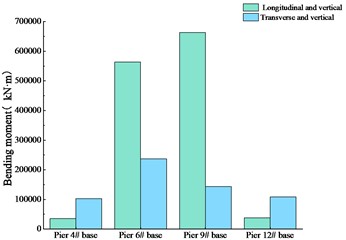
Using the method described above, the internal forces at the pier bases under seismic loading in the longitudinal plus vertical direction and the transverse plus vertical direction are extracted. The results are presented in Fig. 5.
The results plotted in Fig. 5 show that, for all seismic load combinations, the axial force at the base of main pier 6# is larger than that at main pier 9#, and the axial forces at the two transition piers are lower than those at the main piers. For the longitudinal-plus-vertical case, the shear force at the base of main pier 9# markedly exceeds that at main pier 6#, whereas in the transverse-plus-vertical case, the shear forces at the two main pier bases are nearly equal. Regarding bending moments, the longitudinal-plus-vertical loading produces a significantly larger moment at main pier 9# than at main pier 6#, but under transverse-plus-vertical loading, the situation reverses, with main pier 6# showing a larger bending moment than main pier 9#.
The results of the response spectrum analysis indicate that the bridge structure exhibits asymmetry, which leads to distinct seismic response characteristics of the two main piers under different seismic loading cases. Consequently, this asymmetry should be given due attention in the seismic design of the bridge.
5.2. Nonlinear time-history analysis
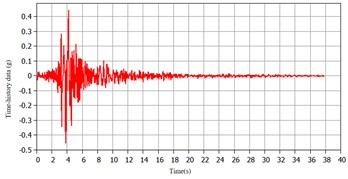
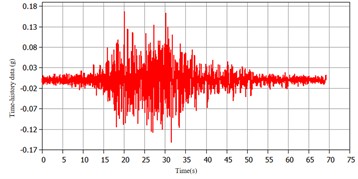
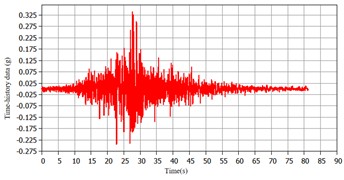
Nonlinear direct integration using the Newmark-β method is adopted for time-history analysis, with an analysis duration of 50 s and a time step of 0.05 s; the stiffness and mass factors of the structural damping matrix are 0.07 and 0.02, respectively. The maximum responses of three seismic waves are taken as the final seismic response. The original recording station is TCU052; the three waves have peak ground accelerations of 0.1793 g, 0.1788 g, and 0.1852 g, and characteristic periods of 0.25 s, 0.24 s, and 0.22 s, respectively. Eq. (1) is used to match the site-specific design response spectrum. The adjusted seismic wave time-history curves and the nonlinear time-history analysis results are shown in Figs. 6 and 7, respectively:
where , :corrected seismic acceleration curve and peak; , :original seismic acceleration curve and peak.
Fig. 5Internal forces of piers under response spectrum analysis
a) Axial force
b) Shear force
c) Bending moment
Fig. 6Adjusted seismic wave curve
a) Seismic wave 1
b) Seismic wave 2
c) Seismic wave 3
Comparing the results of the nonlinear time-history analysis with those of the response spectrum analysis, the internal force responses of the main piers and transition piers obtained from the nonlinear time-history analysis exhibit similar patterns to those from the response spectrum analysis, indicating that the computational results of the nonlinear time-history analysis can realistically reflect the internal force responses under actual seismic action. However, compared with the response spectrum analysis, the nonlinear time-history analysis yields larger values of axial force, shear force, and bending moment at the pier bases.
Fig. 7Internal forces at pier bases under nonlinear time-history analysis
a) Axial force
b) Shear force
c) Bending moment
Longitudinally, shorter pier 9# is much stiffer than taller pier 6# because a cantilever pier’s longitudinal stiffness is approximately proportional to EI/L3. Pier 9# therefore attracts more longitudinal inertial force, causing larger shear and bending moment. Transversely, asymmetric spans and unequal pier heights cause the stiffness and mass centres to be non-coincident, leading to coupled bending–torsion. Phase differences between pier motions, higher-mode contributions, and girder torsional rotation make pier 6# undergo larger curvature and bending moment than pier 9#. Transition piers 4# and 12# also show non-uniform responses due to the same asymmetry.
A comparison of the seismic response results from the two analytical methods reveals that the differences in internal force responses between the main piers and transition piers follow the same trend under both methods, suggesting that such differences are primarily attributed to the structural asymmetry of the bridge rather than the analytical method employed.
6. Conclusions
A high-pier long-span continuous rigid-frame bridge is taken as the engineering prototype in this study. A finite element model is developed, and the dynamic characteristics are computed. Furthermore, the seismic response patterns of the piers are examined through both response spectrum analysis and nonlinear time-history analysis. Based on these analyses, the following conclusions can be reached:
1) The fundamental frequency of the bridge is 0.167 Hz, corresponding to a natural period of 5.975 s, which is lower than that of conventional continuous rigid-frame bridges, indicating that high-pier bridges tend to be more flexible systems. For high-pier structures, the transverse stiffness can be improved by optimizing the structural dimensions, thereby achieving a more reasonable mechanical behavior.
2) The dynamic characteristics and seismic responses of the asymmetric high-pier long-span continuous rigid-frame bridge exhibit a pronounced asymmetry. The internal force responses at main piers 6# and 9# and transition piers 4# and 12# differ considerably under seismic loading, and this asymmetry warrants special attention in the seismic design process.
3) With the advancement of technology and the growing demand for transportation and urban landscape aesthetics, an increasing number of asymmetric and irregularly shaped bridge structures are being constructed. In the future, more refined seismic design approaches should be adopted to address the differences in seismic performance among asymmetric structures.
References
-
Chen B. K. et al., “Research on ground motion selection for seismic time-history analysis of sea-crossing bridges,” (in Chinese), World Earthquake Engineering, Vol. 42, No. 3, pp. 59–73, 2026, https://doi.org/10.19994/j.cnki.wee.2026.0041
-
X. Y. Yan et al., “Research on seismic response of ultra-high pier continuous rigid-frame bridge based on shaking table test,” (in Chinese), Earthquake Resistant Engineering and Retrofitting, Vol. 47, No. 2, pp. 115–123, 2025, https://doi.org/10.16226/j.issn.1002-8412.2025.02.014
-
Wei W., “Influence analysis of structural parameters on seismic performance of continuous rigid-frame bridges with corrugated steel webs,” (in Chinese), Transport World, Vol. 26, pp. 141–143, 2025, https://doi.org/10.16248/j.cnki.11-3723/u.2025.26.023
-
H. J. Lei, Y. H. Chen, and Y. K. Sun, “Seismic mitigation control of high-speed railway continuous rigid-frame bridge under near-fault earthquakes,” (in Chinese), Journal of Railway Science and Engineering, Vol. 19, No. 9, pp. 2480–2489, 2022, https://doi.org/10.19713/j.cnki.43-1423/u.t20211156
-
D. Yang et al., “Seismic analysis of continuous rigid-frame bridge based on orthogonal test and multi-objective function,” (in Chinese), Coal Technology, Vol. 40, No. 5, pp. 186–189, 2021, https://doi.org/10.13301/j.cnki.ct.2021.05.051
-
T. He, J. P. Tu, and K. L. Zhang, “Lightweight design and seismic mitigation of high-pier long-span continuous rigid-frame bridge in strong earthquake regions,” Earthquake Resistant Engineering and Retrofitting, Vol. 46, No. 4, pp. 77–84, 2024.
-
B. Kan, “Dynamic response study of long-span continuous rigid-frame bridge under multi-dimensional seismic action,” (in Chinese), Shanxi Architecture, Vol. 48, No. 20, pp. 164–167, 2022, https://doi.org/10.13719/j.cnki.1009-6825.2022.20.042
-
X. Du, “Study on seismic response characteristics of asymmetric high-pier long-span continuous rigid-frame bridges,” Chang'an University, Xi’an, 2017.
-
“Specifications for seismic design of highway bridges: JTG/T 2231-01-2020,” 2020.
About this article

The authors have not disclosed any funding.
The datasets generated during and/or analyzed during the current study are available from the corresponding author on reasonable request.
The authors declare that they have no conflict of interest.

