Abstract
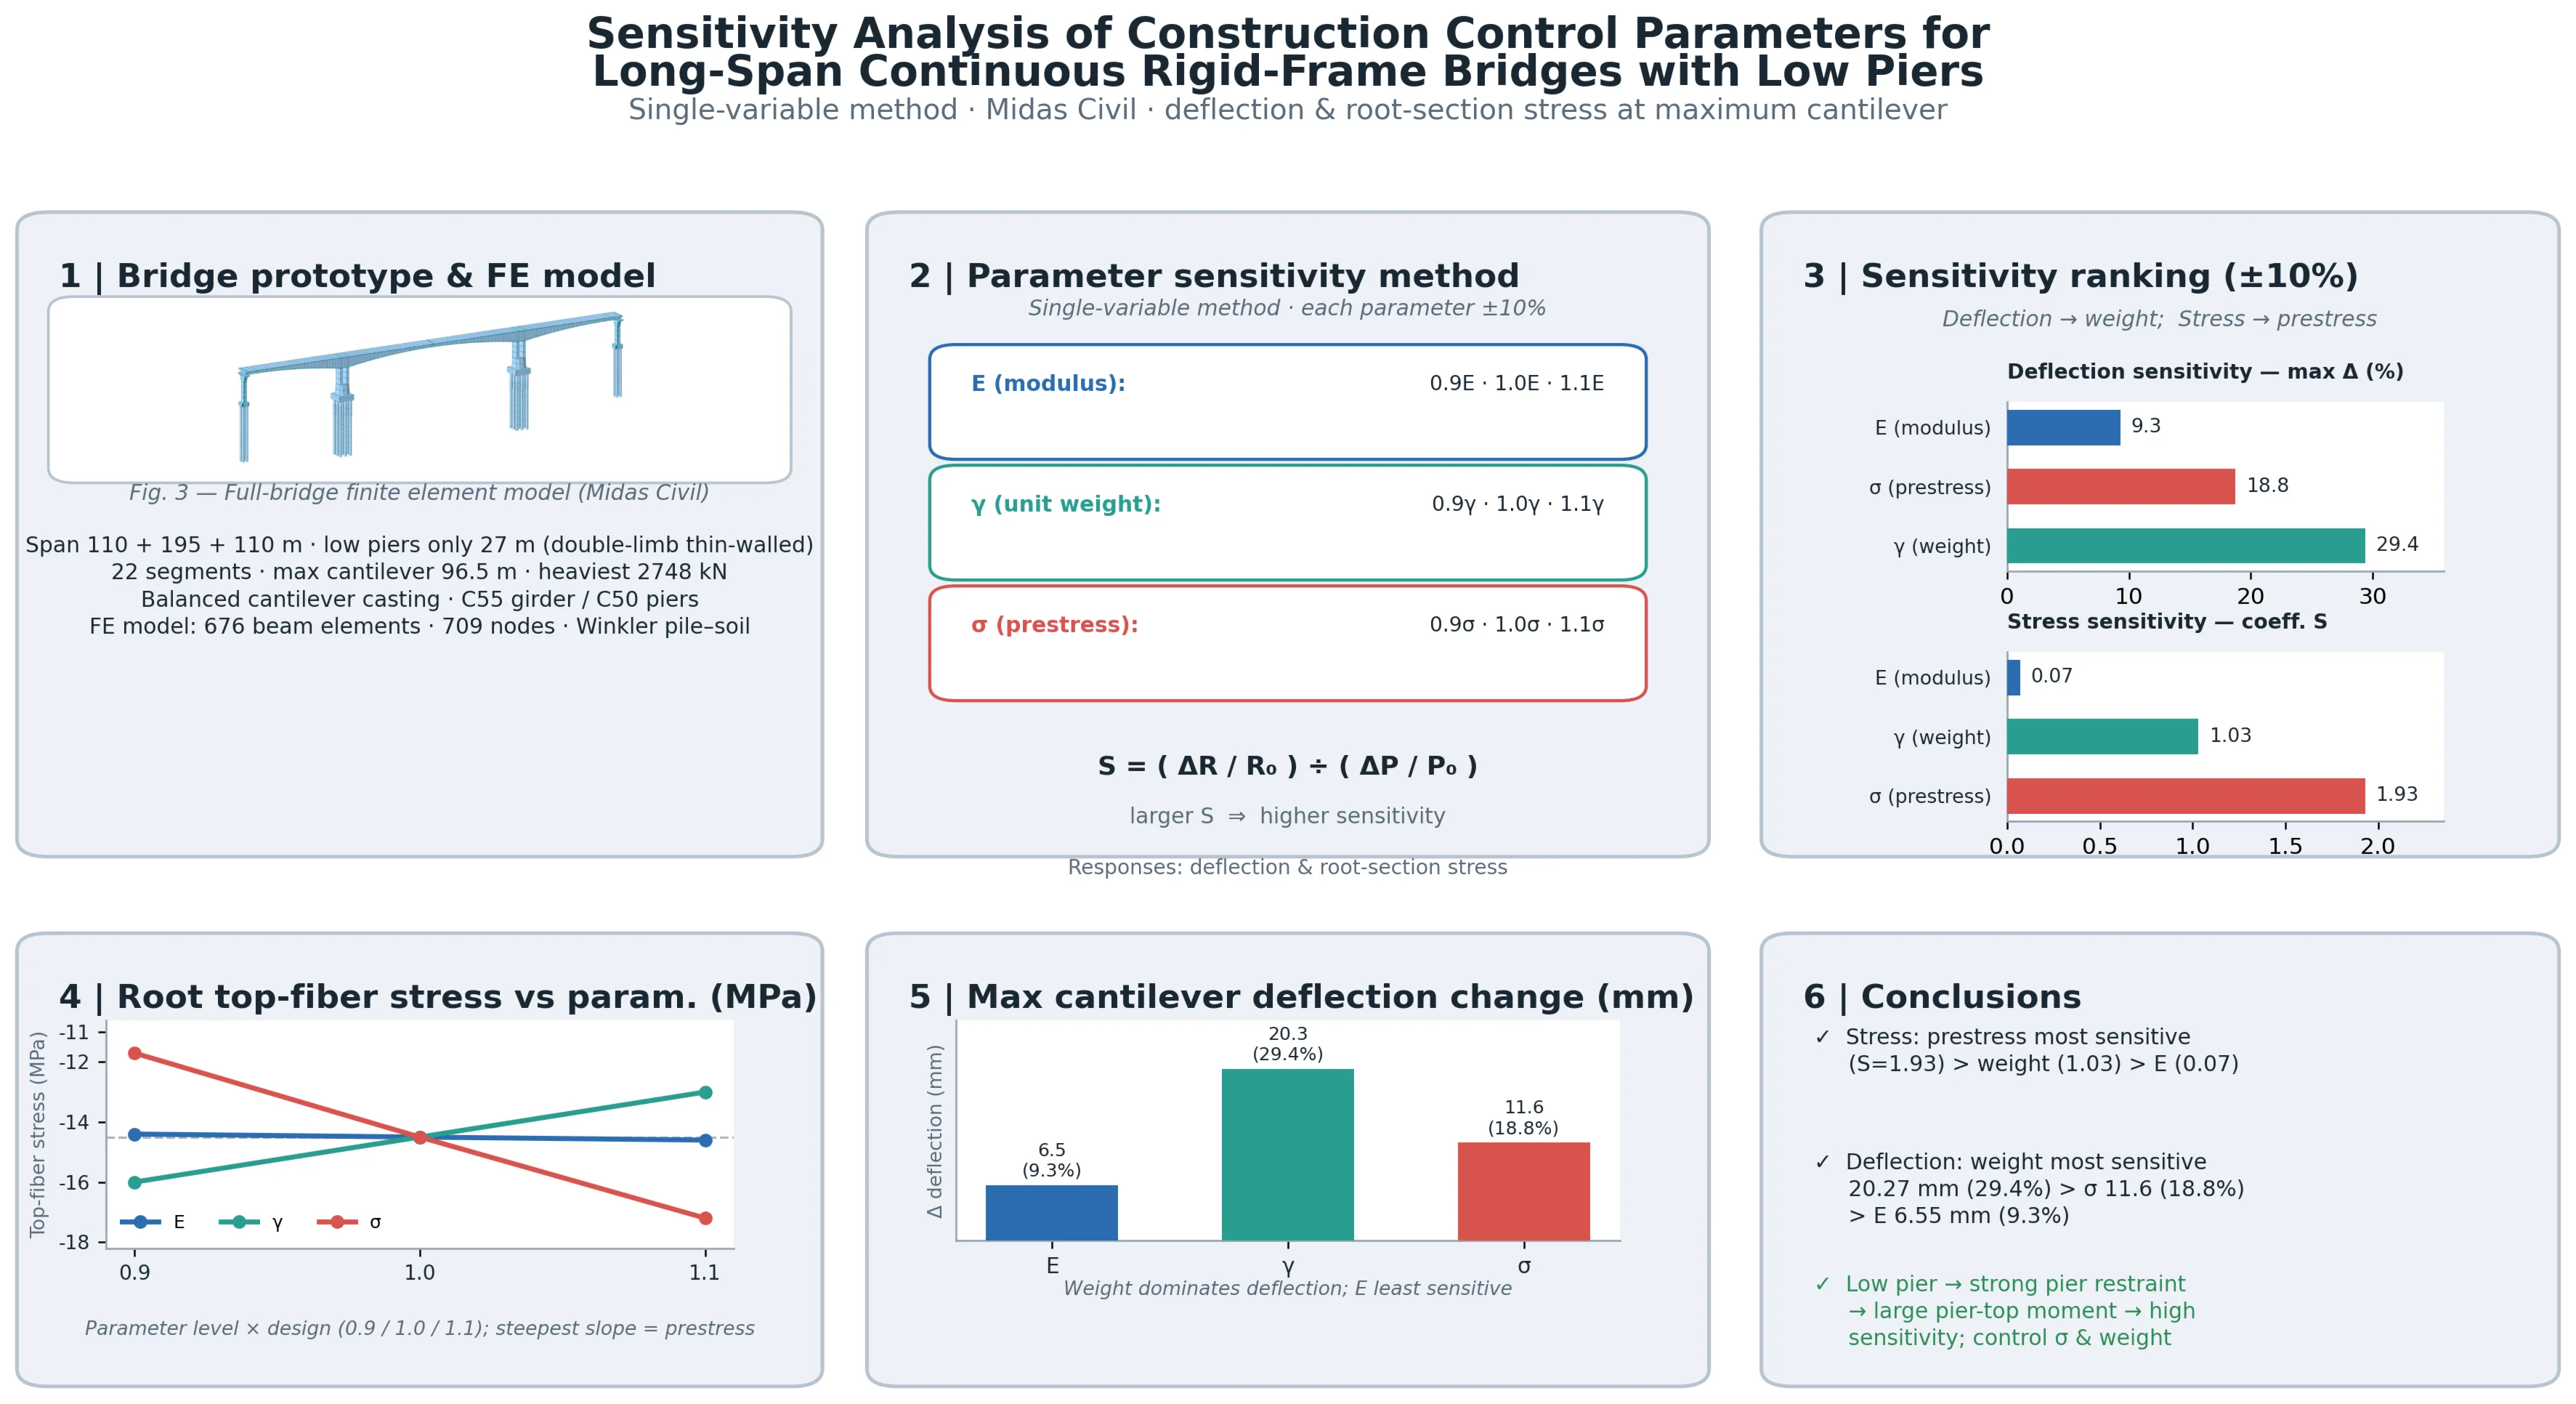
This study focuses on a low-pier continuous rigid-frame bridge and investigates the sensitivity of construction control parameters given its pronounced low-pier characteristics. A refined finite element model simulating the construction process was established to analyze the effects and sensitivities of key parameters – concrete unit weight, elastic modulus, and prestress tensioning – on girder deflection and critical section stresses during cantilever construction. Results indicate that structural stress is most sensitive to prestress tensioning, followed by concrete unit weight, and least sensitive to concrete elastic modulus; structural deflection is most sensitive to concrete unit weight, followed by prestress tensioning, and least sensitive to concrete elastic modulus. These findings reveal the parameter sensitivity characteristics of low-pier long-span continuous rigid-frame bridges, providing a theoretical and practical basis for identifying key parameters and formulating control strategies in construction monitoring of similar bridges.
Highlights
- This study fills the gap of previous research concentrated on high-pier bridges and reveals that such structures are more sensitive to construction parameters owing to the large pier–girder stiffness mismatch and large negative bending moments at pier tops.
- Sensitivity coefficients are introduced for quantitative assessment. Structural stress is most sensitive to prestress tensioning, followed by concrete unit weight; structural deflection is most sensitive to concrete unit weight, followed by prestress. This precisely ide
- The findings directly guide engineering practice, emphasizing strict control of concrete unit weight and prestress tensioning in cantilever construction of low-pier bridges, while objectively noting the limitations of the univariate method and pointing to future multi-parameter coupling analysis.
1. Introduction
Based on the advantages of strong spanning capacity, high structural stiffness, and convenient construction, long-span continuous rigid-frame bridges with low piers are often adopted in complex terrains such as steep slopes and deep valleys. However, due to the relatively small pier-height-to-span ratio of this type of bridge, the stiffness matching between the pier and the girder differs significantly from that of conventional rigid-frame bridges. The restraining effect of the piers on the main girder is notably enhanced, resulting in a considerable increase in negative bending moments at the pier tops, which renders the structure more sensitive to parameters such as construction loads, temperature effects, and concrete shrinkage and creep [1-3]. Improper selection of construction control parameters can easily lead to the accumulation of deflection deviations and stress exceedance, thereby adversely affecting the structural performance and service life of the completed bridge. Therefore, conducting a sensitivity analysis of construction control parameters is a critical step in optimizing the construction scheme and ensuring structural safety.
In recent years, several studies have investigated construction-stage control parameters of continuous rigid-frame bridges. Chen et al. [4] systematically evaluated the effects of longitudinal prestress loss, environmental humidity variation, excessive deck pavement weight, and excess bottom-slab concrete on mid-span deflection, concluding that prestress loss is the dominant factor. Zhao [5] systematically analyzed the influence of major construction-stage parameters on the mechanical properties and alignment sensitivity of completed continuous rigid-frame bridges. Lu [6] showed that girder deflection is highly sensitive to concrete unit weight, prestress loss, elastic modulus, and annual temperature difference load, whereas stress is more sensitive to unit weight, prestress loss, and local solar temperature difference. Li [7] selected unit weight, elastic modulus, tensioning control stress, and form-traveler load as influencing parameters for a construction control project of a high-pier long-span continuous rigid-frame bridge, and analyzed their effects on mid-span deflection at the maximum cantilever and completed bridge stages. However, existing studies mainly focus on conventional high-pier continuous rigid-frame bridges, and parameter sensitivity analysis for low-pier long-span continuous rigid-frame bridges remains insufficient. Therefore, this paper takes a three-span low-pier continuous rigid-frame bridge with a main span of 195 m as a case study and systematically investigates the sensitivity of control parameters during cantilever casting construction, providing a theoretical basis and engineering reference for construction control of similar bridges.
2. Project overview
This study is based on a three-span prestressed concrete continuous rigid-frame bridge with a span arrangement of (110+195+110) m. The main girder is a single-cell single-box variable-section box girder with a top width of 16.4 m and a bottom width of 8.4 m. The main piers are double-limb thin-walled hollow piers with a height of only 27 m, representing a typical low-pier structure. The upper box girder is constructed using the balanced cantilever casting method with form travelers. The maximum cantilever length is 96.5 m, and the girder is divided into 22 segments, with the heaviest segment weighing 2,748 kN. The closure sequence is side spans first and then the center span. The construction procedure is as follows: substructure → construction of segment 0 → maximum cantilever stage → side-span closure → center-span closure → secondary pavement. The elevation view of the bridge and the division of the main girder segments are shown in Fig. 1 and Fig. 2, respectively.
Fig. 1Bridge elevation view (unit: cm)
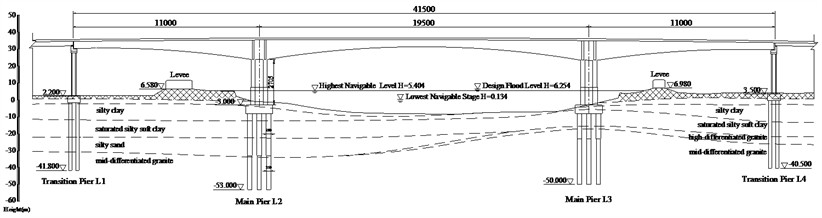
Fig. 2Main girder segment division (unit: cm)

2.1. Finite element modeling and parameter selection
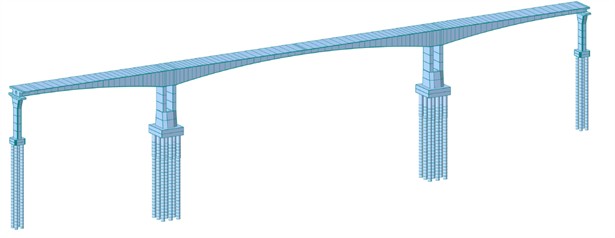
A finite element model is established using Midas Civil. The entire bridge structure is simulated using beam elements, with a total of 676 elements and 709 nodes. Rigid connections are adopted between the main piers and the main girder, while general connections are used between the transition piers and the main girder. In addition, to account for the flexibility effect of the group pile foundations, a foundation model considering pile-soil interaction is established based on the Winkler model [8]. The finite element model is shown in Fig. 3. The main girder is made of C55 concrete with an elastic modulus of 3.45×10⁴ MPa; the piers are made of C50 concrete with 3.55×10⁴ MPa; and the prestressing tendons are made of 15.2 steel strands, with a tensioning control stress of 1395 MPa and an elastic modulus of 1.95×10⁵ MPa.
Fig. 3Full-bridge finite element model
2.2. Parameter sensitivity analysis method
During the cantilever construction of long-span continuous rigid-frame bridges, factors such as structural unit weight, elastic modulus, and prestressing tensioning all increase the complexity of construction control. In the design phase, structural analyses are often performed based on assumed parameters to predict the stress and deflection at each construction stage, thereby ensuring that the completed bridge state satisfies the design requirements. However, the actual parameter values often deviate from the design assumptions, causing the structural responses to deviate from the expected values, which may lead to errors in the internal forces and deflections at the completion stage. Therefore, the core of construction control lies in adjusting the parameters to make the analytical model approximate the actual structural conditions. Since different parameters exert varying degrees of influence on the structural responses, it is necessary to identify the dominant and secondary parameters through sensitivity analysis. Among these, the dominant parameters should be strictly controlled during construction, while the secondary parameters should also be given due attention when higher accuracy is required.
In bridge construction monitoring, parameter sensitivity analysis aims to quantify the influence of each parameter on the structural deflection and stress responses. The single-variable method is adopted to calculate the variations in structural responses, and a sensitivity coefficient is introduced for quantitative assessment. Its expression is given as follows:
where denotes the response under the design state, is the variation in the response caused by a single-parameter change, and is the relative variation amplitude of the parameter. A larger value of indicates higher parameter sensitivity.
3. Parameter sensitivity analysis
3.1. Elastic modulus of concrete
The structural stiffness of long-span continuous rigid-frame bridges is primarily governed by the elastic modulus of the material and the sectional properties. In this section, the elastic modulus of concrete is taken as 0.9E, 1.0E, and 1.1E, respectively, to analyze the variations in the main girder deflection and key section stresses under the maximum cantilever stage of a single T-shaped structure. The results are shown in Fig. 4 and Table 1, and the deflection sensitivity coefficients are presented in Fig. 5.
Fig. 4Main girder deflection at the maximum cantilever stage
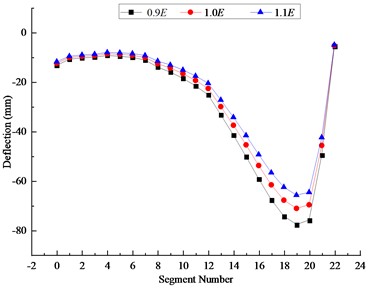
Fig. 5Deflection sensitivity coefficients at maximum cantilever stage
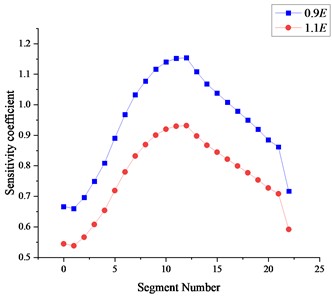
As shown in Fig. 4 and 5 and Table 1, when the elastic modulus varies by 10 %, the deflection of the main girder at the cantilever stage decreases with increasing elastic modulus, with a maximum change of 6.55 mm, accounting for 9.3 % of the deflection at that location. The maximum stress change at the upper flange of the root section is 0.10 MPa, with a corresponding sensitivity coefficient of 0.07, while the stress at the lower flange remains virtually unchanged. The deflection sensitivity coefficients of each segment are more pronounced when the elastic modulus decreases, with Segments 10-13 exhibiting the highest sensitivity. Overall, the elastic modulus has a significant influence on the deflection of the main girder, but a relatively minor effect on the stress, and the deflection variation tends to accumulate with increasing cantilever length.
Table 1Section stresses under varying elastic modulus of concrete
Elastic Modulus | Section stress at girder root (MPa) | |||
Top fiber | Bottom fiber | Top-fiber sensitivity coefficient | Bottom-fiber sensitivity coefficient | |
0.9E | –14.40 | –10.40 | 0.07 | 0.00 |
1.0E | –14.50 | –10.40 | – | – |
1.1E | –14.60 | –10.40 | 0.07 | 0.00 |
3.2. Unit weight of concrete
In long-span structures, the self-weight accounts for over 70 % of the total load, so variations in unit weight have a significant effect on the structural forces and deflections. In this section, the unit weight is taken as 0.9, 1.0, and 1.1, respectively, to calculate the main girder deflection and key section stresses under the maximum cantilever stage of a single T-shaped structure. The results are shown in Fig. 6 and Table 2, and the deflection sensitivity coefficients are presented in Fig. 7.
Table 2Section stresses under varying unit weight of concrete
Unit weight | Section stress at girder root (MPa) | |||
Top fiber | Bottom fiber | Top-fiber sensitivity coefficient | Bottom-fiber sensitivity coefficient | |
0.9 | –16.00 | –8.84 | 1.03 | 1.50 |
1.0 | –14.50 | –10.40 | – | – |
1.1 | –13.00 | –11.90 | 1.03 | 1.44 |
Fig. 6Main girder deflection at the maximum cantilever stage
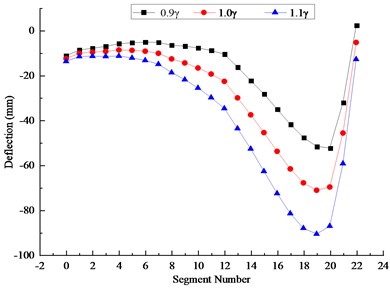
Fig. 7Deflection sensitivity coefficients at maximum cantilever stage
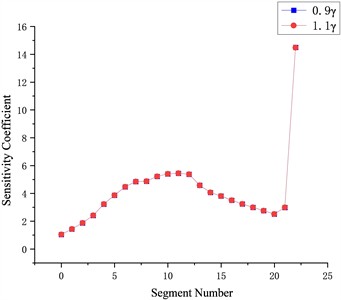
As shown in Fig. 6 and 7 and Table 2, when the unit weight of concrete varies by 10 %, the deflection of the main girder at the cantilever stage decreases with increasing unit weight, with a maximum change of 20.27 mm, accounting for 29.38 % of the deflection at that location. The maximum stress change at the upper flange of the root section is 1.50 MPa, with a corresponding sensitivity coefficient of 1.03, while the stress change at the lower flange is 1.56 MPa, with a sensitivity coefficient of 1.50. The deflection sensitivity of each segment to both increases and decreases in unit weight is generally comparable, with the deflection at the maximum cantilever segment being the most sensitive, considerably higher than that of the other segments. In summary, variations in unit weight have a significant influence on both the deflection and stress of the main girder, and thus should be strictly controlled during construction.
3.3. Prestressing tensioning
Prestressing serves as a key component of long-span continuous rigid-frame bridges, primarily used to resist tensile stresses in the girder. However, during actual construction, issues such as insufficient tensioning or over-tensioning of the prestressing tendons may occur, leading to deviations between the actual in-girder prestress and the design values.
In this section, the in-girder prestress is taken as 0.9, 1.0, and 1.1, respectively, to calculate the main girder deflection and key section stress variations under the maximum cantilever stage of a single T-shaped structure. The results are shown in Fig. 8-9 and Table 3 (deflection sensitivity coefficients).
Fig. 8Main girder deflection at the maximum cantilever stage
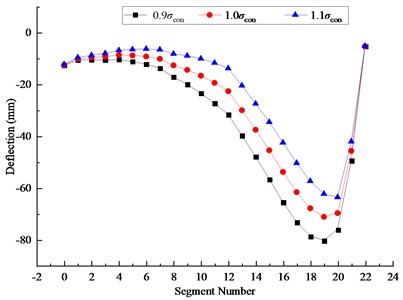
Fig. 9Deflection sensitivity coefficients at maximum cantilever stage
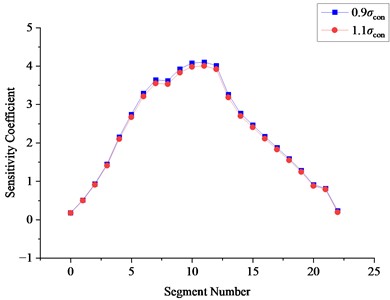
Table 3Section stresses under varying unit weight of concrete
Prestress | Section stress at girder root (MPa) | |||
Top fiber | Bottom fiber | Top-fiber sensitivity coefficient | Bottom-fiber sensitivity coefficient | |
0.9 | –11.70 | –10.90 | 1.93 | 0.48 |
1.0 | –14.50 | –10.40 | – | – |
1.1 | –17.20 | –9.87 | 1.86 | 0.51 |
As shown in Fig.8 and 9 and Table 3, when the prestressing level varies by 10 %, the deflection of the main girder at the cantilever stage decreases with increasing prestressing, with a maximum change of 11.57 mm, accounting for 18.75 % of the deflection at that location. The maximum stress change at the upper flange of the root section is 2.80 MPa, with a corresponding sensitivity coefficient of 1.93, while the stress change at the lower flange is 0.53 MPa, with a sensitivity coefficient of 0.51. The deflection sensitivity of each segment to both increases and decreases in prestressing is generally consistent, with Segments 8~12 exhibiting the highest sensitivity, considerably higher than that of the other segments. In summary, variations in prestressing have a significant influence on both the deflection and stress of the main girder, and thus insufficient tensioning or over-tensioning should be avoided during construction.
3.4. Limitations of the univariate method
This study employs a univariate sensitivity analysis, varying each parameter independently by ±10 % while keeping the others at their design values, to reveal the dominant sensitivity ranking of elastic modulus, concrete unit weight, and prestress tensioning. However, this method cannot capture coupling and interaction effects under simultaneous multi-parameter deviations; for example, the deflection and stress responses induced by concurrent fluctuations in concrete unit weight and prestress tensioning are not simply additive. Future studies should adopt a multivariate analysis framework to quantitatively characterize parameter interactions. Nevertheless, univariate analysis can still provide a basis for identifying controlling parameters that require priority monitoring.
4. Conclusions
Based on a three-span low-pier long-span continuous rigid-frame bridge, this paper systematically investigates the sensitivity of control parameters during the cast-in-place cantilever construction process, considering the effects of structural elastic modulus, concrete unit weight, prestressing tensioning. The following conclusions are drawn:
1) The structural stress is most sensitive to variations in prestressing tensioning (with a maximum top-fiber stress sensitivity coefficient of 1.93), followed by concrete unit weight (top-fiber sensitivity coefficient of 1.03), and is least sensitive to changes in concrete elastic modulus (top-fiber sensitivity coefficient of 0.07).
2) The structural deflection is most sensitive to variations in concrete unit weight (with a maximum variation of 20.27 mm, accounting for 29.38 % of the local deflection), followed by prestressing tensioning (maximum variation of 11.57 mm, i.e., 18.75 %), and is least sensitive to changes in concrete elastic modulus (maximum variation of 6.55 mm, i.e., 9.3 %).
References
-
W. K. Cui, “Design parameter analysis of main girder and main pier for continuous rigid-frame bridges,” (in Chinese), Engineering Technology Research, Vol. 11, No. 6, pp. 166–168, 2026, https://doi.org/10.19537/j.cnki.2096-2789.2026.06.055
-
Q. Wei et al., “Research on dynamic impact factor of high-pier long-span continuous rigid-frame bridges,” (in Chinese), Journal of Vibration and Shock, Vol. 44, No. 7, pp. 209–216, 2025, https://doi.org/10.13465/j.cnki.jvs.2025.07.024
-
X. C. Li, “Orthogonal experiment-based parameter sensitivity analysis of continuous rigid-frame bridges,” (in Chinese), Heilongjiang Transportation Science and Technology, Vol. 49, No. 3, pp. 64–68, 2026, https://doi.org/10.16402/j.cnki.issn1008-3383.2026.03.014
-
C. X. Chen, S. B. Liu, and Z. Zou, “Parameter analysis of long-term deflection for a five-span rigid-frame continuous girder bridge with unequal spans,” (in Chinese), Urban Roads Bridges and Flood Control, No. 5, pp. 218–223, 2026, https://doi.org/10.16799/j.cnki.csdqyfh.251090
-
H. Zhao, “Construction monitoring and sensitivity analysis of main parameters for continuous rigid-frame bridges,” (in Chinese), Transport World, No. 31, pp. 128–130, 2025, https://doi.org/10.16248/j.cnki.11-3723/u.2025.31.029
-
J. Lu, “Sensitivity analysis of construction monitoring parameters for high-pier long-span continuous rigid-frame bridges,” (in Chinese), Construction and Design for Engineering, No. 3, pp. 86–88, 2025, https://doi.org/10.13616/j.cnki.gcjsysj.2025.02.025
-
N. Q. Li, “Uniform design-based multi-parameter sensitivity analysis of construction control for long-span continuous rigid-frame bridges,” (in Chinese), Heilongjiang Transportation Science and Technology, Vol. 48, No. 8, pp. 60–63, 2025, https://doi.org/10.16402/j.cnki.issn1008-3383.2025.08.027
-
J. X. Yang and S. Yang, “Dynamic response analysis of rigid-frame-continuous composite girder bridges with different longitudinal slopes under rare earthquake,” (in Chinese), Highway and Automotive Transportation, Vol. 41, No. 1, pp. 78–83, 2025, https://doi.org/10.20035/j.issn.1671-2668.2025.01.016
About this article

The authors have not disclosed any funding.
The datasets generated during and/or analyzed during the current study are available from the corresponding author on reasonable request.
The authors declare that they have no conflict of interest.

