Abstract
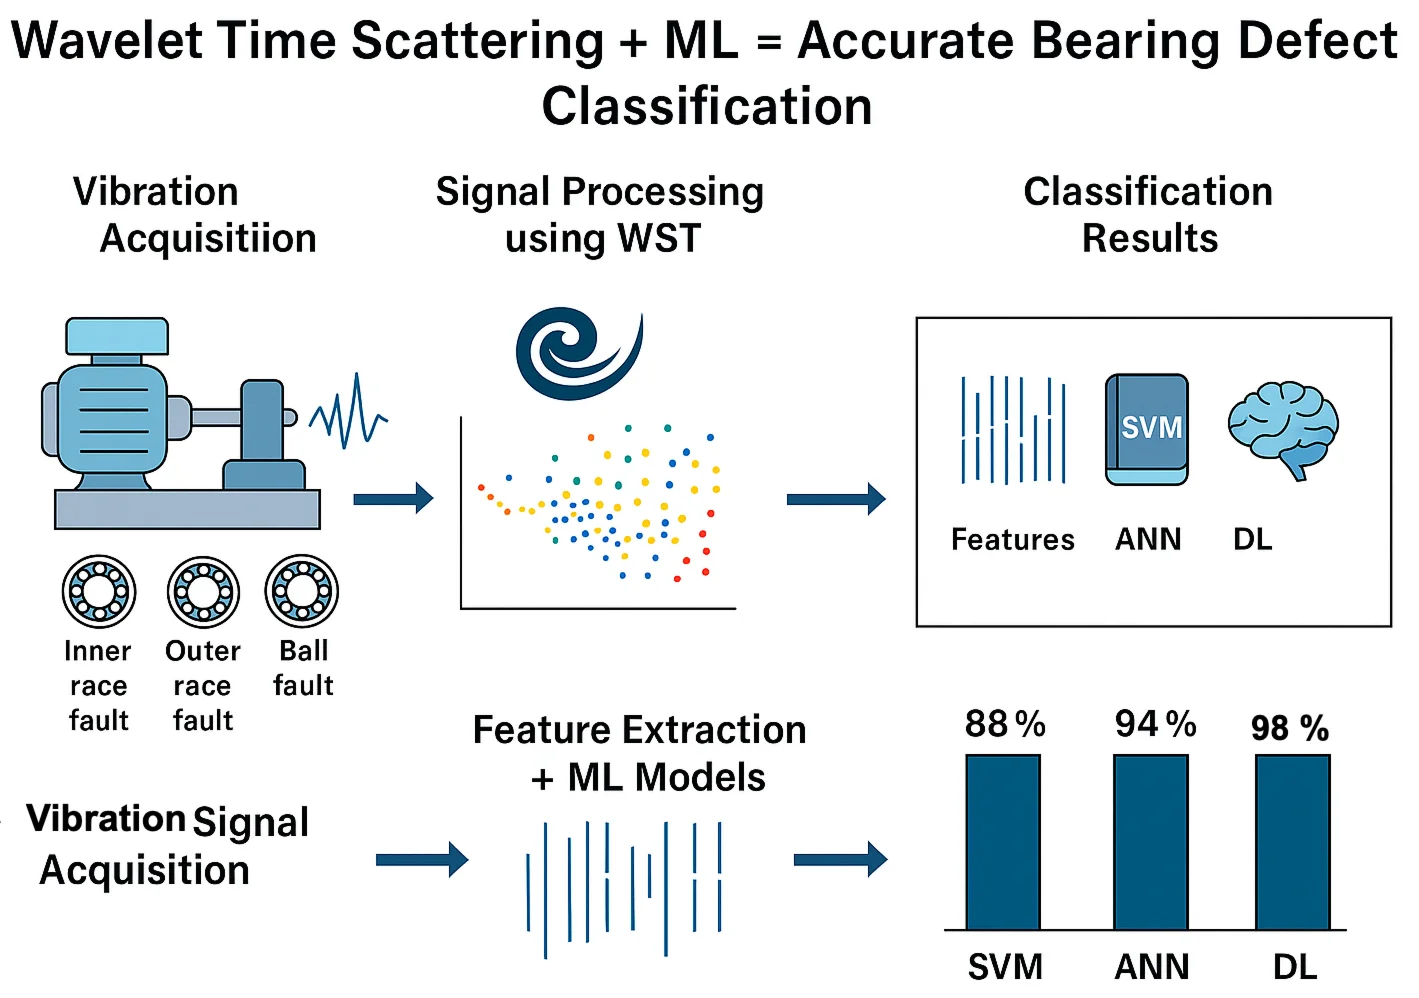
Rolling element bearings (REBs) are critical components used in almost all rotating machinery. Small defects, such as pits and spalls, are formed on bearing surfaces due to cyclic loading, results in failure in these rotating machinery and sometime production downtime. Early detection of these small defects is essential to avoid such failure in machinery. In this work, a technique for bearing fault classification using the Wavelet Scattering Transform (WST) and machine learning is proposed. The proposed technique is based on principles of signal processing i.e. wavelet transforms, extracts features that are stable under small deformations and invariant to time shifts. These features are captured automatically from the WST images and are used to train conventional machine learning techniques such as Support Vector Machine, Artificial Neural Network and Decision Tree. The proposed methodology is validated using experimental data from the Case Western Reserve University Bearing Data Centre. Results indicate that WST-based feature extraction, with various classification algorithms, significantly improves the accuracy of bearing fault diagnosis, offering a robust solution for early defect detection.
Highlights
- Wavelet Scattering Transform (WST) enables early identification of inner race, outer race, and ball defects in rolling element bearings.
- WST provides stable, translation-invariant features from non-stationary vibration signals for robust defect characterization.
- Extracted features are classified using Support Vector Machine (SVM), Artificial Neural Network (ANN), and Decision Tree (DT).
- The Decision Tree model achieved the highest classification accuracy of 98%, outperforming ANN (94%) and SVM (88%).
- The approach can be extended to other fault detection problems in rotating machinery.
1. Introduction
Rolling element bearings (REBs) are critical components in rotating machinery and are among the primary sources of mechanical failures. If defects develop during operation, they can lead to serious damage and even catastrophic failure of the entire machine. Therefore, early detection of bearing defects is essential to ensure operational safety and reliability. Localized defects, i.e. spalls and pits are typically form on the bearing contact surfaces due to cyclic loading. These imperfections cause sudden impact forces when a rolling element traverses them. The resulting impact frequencies are characteristic of the specific defective bearing component. Consequently, vibration signal analysis has become the most widely used technique for bearing fault diagnosis, as it effectively captures these diagnostic frequencies.
Diagnosis of bearing defects involves two main steps. In the first step, relevant signals are captured from the system under observation. These signals are then processed to extract features that effectively capture information about potential defects. Feature extraction can be performed in various domains, including Time-Amplitude Domain for Analyzing signal patterns over time, Frequency-Amplitude Domain for evaluating the spectral content of the signal and Time-Frequency Domain for Combining time and frequency information for more detailed insights, often using techniques like Short-Time Fourier Transform (STFT) or wavelet transforms. Further these features are utilized for diagnosis using various machine learning techniques, such as decision trees (DT), artificial neural networks (ANN), and support vector machines (SVM). These methods assist in classifying faults or predicting failures based on the patterns learned from the signal features.
Over the past several years, many studies have been presented for the classification of REB defects [1-8]. McFadden and Toozhy [1] presented a combined high-frequency resonance method using synchronous averaging to determine the changes in vibration signals of REBs due to various defects. The distribution of inner race damages and the variations between rolling elements were correlated with the synchronous average of the signal. Vyas and Satishkumar [2] explained artificial neural network for diagnosing REBs defects, using statistical moments of vibration signals to train the network. Similarly, Samanta and Al-Balushi [3] proposed a method that extracts time domain statistical features from vibration responses of both healthy and defective bearings, which are then used to train an ANN. Yang et al. [4] is used intrinsic mode functions from the envelope spectrum along with a support vector machine for bearing fault diagnosis. Lei et al. [5] is introduced an innovative artificial intelligence approach combining adaptive neuro-fuzzy inference systems, improved distance evaluation, and empirical mode decomposition for the diagnosis of bearing defects. Kankar et al. [6] is evaluated the performance of SVM and ANN for REBs defects diagnosis and concluded that SVM offers superior classification accuracy. Toma et al. [7] proposed an effective fault diagnosis method based on wavelet scattering transform derived features, combined with machine learning classifiers. The study focus on motor current signals from a publicly available bearing dataset, applying a two-layer WST for feature extraction, followed by training three models: random forest, extreme gradient boosting, and a multi-layer ANN. Afsar et al. [8] is proposed an effective fault diagnosis method based on wavelet scattering transform derived features, combined with machine learning classifiers.
However, most of the methods used in the said literature are effective for stationary signals, often fail to capture the non-stationary and nonlinear characteristics present in real-world bearing fault signals. To overcome these limitations, recent works have discovered hybrid approaches that integrate machine learning, time-frequency analysis, and domain knowledge to improve feature extraction and increase classification accuracy.
Moreover, deep learning techniques such as convolutional neural networks and recurrent neural networks are revealed promising results by automatically capturing features from raw vibration signals. These approaches reduce the dependency on manual feature engineering and are capable of adapting to complex and varying fault patterns.
Although wavelet transform has proven effective in detecting defects, characterizing the healthy or defective state remains challenging. This is primarily due to the difficulty and time-consuming nature of selecting appropriate parameters, such as the mother wavelet, decomposition scale, and relevant features. Most previous studies in the area of bearing fault classification used continuous wavelet transform (CWT) [9-11]. To overcome the limitations of CWT, recently, Tuneable Q wavelet transform (TQWT) has been used as a powerful tool for analyzing oscillatory signals such as cardiac sounds and defective bearing vibration signals [12].
This manuscript presents a technique based on the Wavelet Scattering Transform (WST) and machine learning for classifying defects in rolling element bearings. WST is employed to extract features from both normal and defective bearing data, enabling effective fault characterization. The extracted features are then used in machine learning algorithms, which are SVM, ANN and Decision Tree to classify bearing defects. The classification results demonstrate the effectiveness of WST in capturing significant features from the experimental data.
2. Wavelet scattering transform
The basic of WST is supported by the theory of wavelet transform and are used for the analysis of time domain data. A wavelet transform calculates convolutions of signals with translated and dilated wavelets. Wavelets are a small wave form and are stable to any deformations, as opposite to Fourier sine waves. Convolutions of wavelets are not translation invariant. A WST framework derive nonlinear invariants from wavelet coefficients, with the help of modulus and averaging functions [13-15]. A WST framework enables one to extract features from real valued time domain data that can be used for the training and testing of machine learning techniques. The scattering features are invariant to input data translations and are stable to deformations. The WST framework uses pre-exist wavelet and scaling filters.
Consider a mother wavelet , a stable scaling factor 1, and a resolution parameter . The dilation of the wavelet represent as . Consider a signal and a dilated wavelet , the wavelet transforms of a time domain signal is [13]:
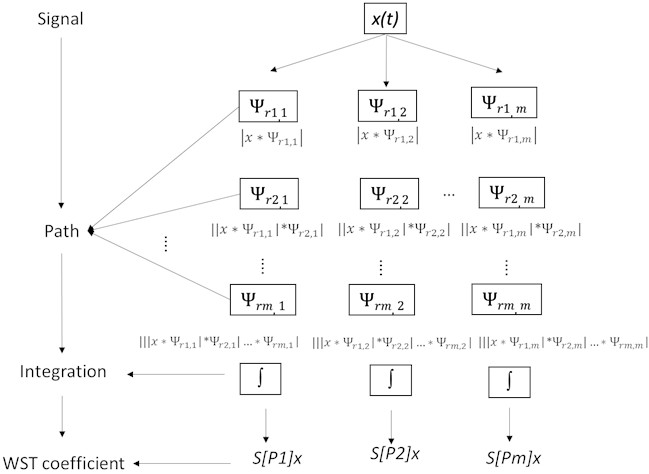
Eq. (1) simply represent the convolution of signal with dilated wavelet. Fig. 1 shows the basic framework of the WST which constantly uses wavelet transform and modulus operator to generate the WST coefficient. Applying different mother wavelets on signal will give a different set of WST coefficients which indicate the characteristics of the signals that can be used to classify the bearing defects in this study.
Fig. 1Framework of wavelet scattering transform
3. Machine learning techniques
Machine learning is an approach that uses examples-referred to as data-to synthesize programs or models that can make predictions or decisions. When these examples consist of input/output pairs, the approach is known as supervised learning, where the goal is to learn a mapping from inputs to outputs. In contrast, unsupervised learning is used when the data has no labelled outputs; here, the objective is to discover patterns or structure within the data, thereby gaining insight into the underlying process that generated it. In this work, for the classification of bearing defects, machine learning techniques such as artificial neural networks (ANN), support vector machines (SVM), and decision trees are used.
3.1. Support vector machine (SVM)
Support Vector Machine (SVM) is one of the most extensively used machine learning methods. It is a type of supervised learning method used in both classification and regression, particularly effective when the dataset is comparatively small. SVM works by creating a hyperplane that divides the data into different classes. The data points that lie neighboring to the hyperplane are referred to as support vectors. To minimize generalization error and increase classification accuracy, SVM maximizes the margin between the support vectors and the hyperplane. An overview of the SVM technique is presented in [16].
Finding the optimal margin is formulated as a convex optimization problem, specifically one that involves minimizing a quadratic objective function (related to the norm of the weight vector) subject to linear inequality constraints (ensuring correct classification of the training data). This mathematical formulation ensures that the problem has a unique global minimum, which makes SVMs both efficient and reliable in practice. A training sample set , 1 to is considered, where is the total number of samples. The hyperplane that separates the given data can be determined by solving the following optimization problem [10]:
where is a constant representing the penalty for classification errors. By rewriting the above optimization problem using Lagrange multipliers, it transforms into the following dual problem:
The Sequential Minimal Optimization algorithm provides an efficient method for solving the dual problem that arises during the formulation of SVM. It simplifies the overall quadratic programming problem by breaking it down into smaller quadratic programming sub-problems, which are easier to solve.
3.2. Artificial neural network
An Artificial Neural Network (ANN) consists of a group of interconnected neurons. These neurons transmit information from the input layer to the output layer through one or more hidden layers. An ANN is an adaptive, information-based structure that modifies its internal configuration based on the flow of information through the network [17].
Each neuron typically includes the following components: Synapses: These maintain the connections between the th neuron and input signals along with the associated weighting factor . Summation Junction: It computes the weighted sum of input signals, where each input is multiplied by its corresponding weight. Activation Function transforms the total input into an output within a specified range, often to introduce non-linearity into the model:
where: – input signals, – weights, – bias, – activation function, – output of the neuron.
3.3. Decision tree
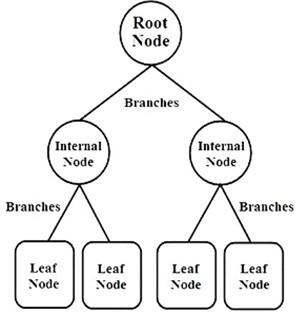
A decision tree consists of roots, nodes, branches, and leaves. Each node represents a attribute, and each branch corresponds to a possible outcome or decision based on that feature. A path from the root to a leaf node represents a sequence of decisions that leads to a final classification or prediction (i.e., the class label). The features used in the tree provide valuable information about how the decision tree makes its classifications. [18]. It is an information-based machine learning technique used for the classification. J48 algorithm is majorly used to build. Fig. 2 shows the decision tree model.
Fig. 2Decision tree model
4. Experiment
The experiment data used in this study are taken from the Case Western Reserve University (CWRU) Bearing Data Center website [19]. The CWRU test rig is shown in Fig. 3. The setup includes a 2 HP three-phase induction motor, a dynamometer, and an encoder. The test bearing is mounted on the drive-end side of the motor and is subjected to loading by the dynamometer. This description outlines a structured experimental setup for studying vibration signals in a motor with intentionally seeded bearing faults. In the aforesaid experiment we have used 2 horsepower typical induction motor. Motor speeds varied with load from 1797 RPM to 1720 RPM.
Fig. 3Schematic of CWRU bearing experiment [19]
![Schematic of CWRU bearing experiment [19]](https://static-01.extrica.com/articles/25069/25069-img3.jpg)
The test bearings support the motor shaft, and single-point faults are introduced into them using electro discharge machining, with fault diameters of 7 mils, 14 mils, 21 mils, 28 mils, and 40 mils (where 1 mil = 0.001 inches). An accelerometer with a magnetic base is mounted on the housing of the test bearing to capture vibration signals from both healthy and defective bearings, including inner race defects, outer race defects, and ball defects. Digital vibration data were collected at sampling rates of 12,000 samples per second and 48,000 samples per second for analyzing drive-end bearing faults. In addition, speed and horsepower data were manually recorded using a torque transducer and encoder.
Normal bearing data is considered as the benchmark data in the analysis. In this work, the drive end test bearing data are used for the classification and the detailed physical specifications with parameters of the bearing are given in Table 1.
Table 1Bearing specifications of CWRU
Bearing parameter | Value |
Bearing type | 6205-2RS JEM SKF, Deep Groove ball bearing |
Inner Diameter | 25 mm |
Outer Diameter | 52 mm |
Thickness | 15 mm |
Ball diameter | 05 mm |
5. Results
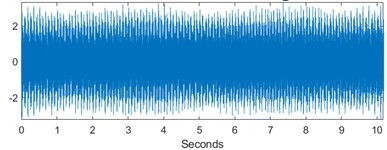
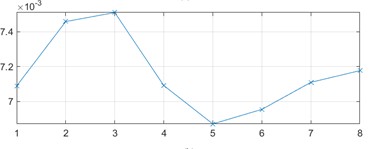
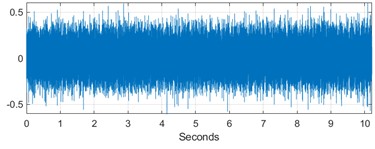
The bearing datasets used in this study are taken from the CWRU Bearing Data Centre discussed in Section 4. The dataset contains various conditions: healthy bearings, inner race faults, ball faults, and outer race faults. Representative time-domain signals and feature trends for each bearing condition are illustrated in Figs. 4, 6, 8, and 10.
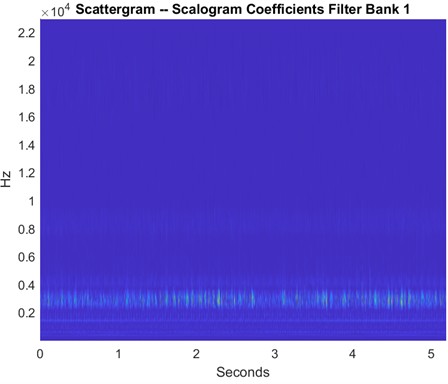
To extract meaningful and discriminative features from the vibration signals, the Wavelet Scattering Transform is used. This technique captures time-frequency representations of signals while preserving both temporal structures and localized frequency content. The WST is implemented in MATLAB and applied to both healthy and defective bearing conditions, producing time-frequency scattergrams that represent the signal’s energy distribution over time and frequency. For healthy bearings, the scattergrams as shown in Fig. 5 display consistent horizontal bands around 1000 Hz and 2000-2500 Hz, indicating stable vibrations typically expected from normal rotating components. In contrast, scattergrams derived from faulty bearings reveal distinct patterns associated with specific defect types and locations. For instance, inner race faults exhibit energy concentration in the lower frequency range, typically between 200 and 400 Hz, due to periodic impacts caused by the rolling elements striking the damaged inner race as shown in Fig. 7. Outer race faults also show energy concentrated in the same low-frequency range, reflecting the impacts occurring as rolling elements pass over a stationary defect on the outer ring as shown in Fig. 9. In the case of ball faults, the scattergram reveals discrete and localized bursts of energy in the 2000-3000 Hz range, which corresponds to repetitive, but not completely periodic, impacts resulting from damage on the rolling elements themselves as shown in Fig. 11. The coefficients obtained from these scattergrams are used as features that characterize both the spectral and temporal properties of the vibration signals. These features then used as inputs to machine learning techniques, with appropriate class labels assigned based on the type of bearing defects, location, and severity. The use of WST enabled the extraction of highly informative features that contributed to the reliable for defect classification.
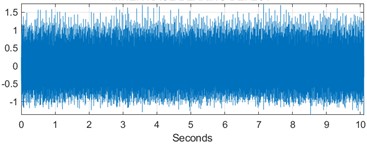
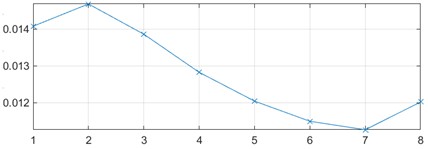
Fig. 4Time-domain signal and feature trend for healthy bearing
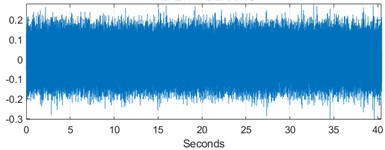
a) Time-domain signal for healthy bearing
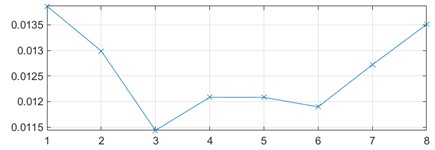
b) Feature trend for healthy bearing
Fig. 5Scattergram of healthy bearing at 1730 RPM
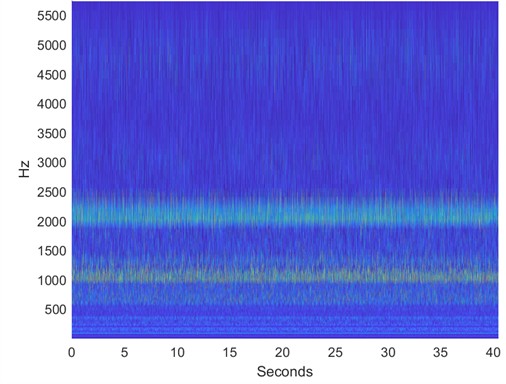
Fig. 6Sample time domain and feature trend for inner race defects
a) Time-domain signal for inner race defects
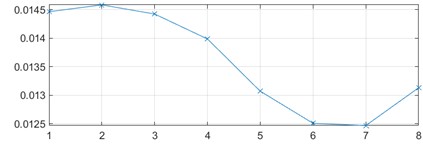
b) Feature trend for inner race defects
Fig. 7Scattergram of inner race fault

Fig. 8Time-domain signal and feature trend for outer race fault
a) Time-domain signal for outer race defects
b) Feature trend for outer race defects
Fig. 9Sample scattergram of outer race defects
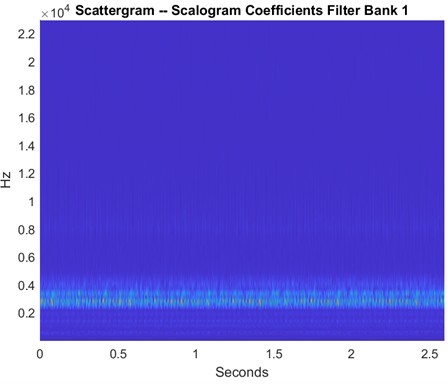
Fig. 10Time-domain signal and feature trend for ball fault
a) Time-domain signal for ball defects
b) Feature trend for ball defects
Fig. 11Sample scattergram of ball defects
The performance of the classification models-Support Vector Machine (SVM), Artificial Neural Network (ANN), and Decision Tree (DT) is evaluated using standard metrics including accuracy, precision, recall, and F1-score shown in Table 2. These performance metrics are calculated using a 10-fold cross-validation approach to ensure robustness and generalizability of the results. Among the classifiers, the Decision Tree model achieved the highest overall accuracy of 98 %, followed by ANN with 94 %, and SVM with 88 %. Similarly, the Decision Tree outperformed the other models in precision, recall, and F1-score, demonstrating its superior ability to correctly identify and classify the different types of bearing faults. These results indicate that the combination of Wavelet Scattering Transform feature extraction and Decision Tree classification yields the most effective performance for bearing fault diagnosis using the CWRU dataset.
Table 2Performance matrix (accuracy, precision, recall, F1-score)
Classifier | Accuracy (%) | Precision (%) | Recall (%) | F-1 Score (%) |
SVM | 88 | 91.8 | 91.5 | 91.6 |
ANN | 94 | 93.6 | 93.8 | 93.7 |
Decision Tree | 98 | 96.4 | 96.5 | 96.4 |
The confusion matrices provide a detailed view of the classification outcomes for each class-healthy, inner race fault, outer race fault, and ball fault Shown in Tables 3-5. In the case of the Decision Tree classifier, most predictions were concentrated along the diagonal of the confusion matrix, indicating a high number of correctly classified instances across all fault types. Misclassifications were minimal, with very few instances being incorrectly assigned to adjacent fault categories. Compared to SVM and ANN, which showed higher off-diagonal values indicating more classification errors, the Decision Tree maintained better class discrimination. This reinforces the conclusion that the Decision Tree, when used in conjunction with features extracted via WST, provides the most accurate and reliable classification performance for bearing health monitoring.
The proposed methodology provides good classification accuracy and performs efficiently without the need for signal preprocessing or manual feature selection making it more effective than many previous approaches. Because of various intrinsic limitations, the proposed methodology does not achieve 100 % defect identification. In particular, overlapping frequency components in the vibration signatures of various bearing defects, such as inner race and outer race faults, can cause misclassification. Furthermore, even while WST’s resolution is resistant to translation and noise, it might not be able to completely distinguish closely spaced spectral features, particularly when there are small or early-stage defects present. Confusion across fault classes is also intensified by differences in signal quality, restricted fault severity levels, and parallels in transitory features. Despite the fact that the suggested method offers good accuracy.
Table 3Confusion matrix using SVM
Classified as | Healthy | IR defect | Ball defect | OR defect |
Healthy | 21 | 2 | 1 | 1 |
IR defect | 1 | 22 | 1 | 1 |
Ball defect | 1 | 2 | 22 | 0 |
OR defect | 0 | 1 | 1 | 23 |
Table 4Confusion matrix using ANN
Classified as | Healthy | IR defect | OR defect | Ball defect |
Healthy | 24 | 1 | 0 | 0 |
IR defect | 1 | 23 | 1 | 0 |
OR defect | 0 | 1 | 23 | 1 |
Ball defect | 0 | 0 | 1 | 24 |
Table 5Confusion matrix using decision
Classified as | Healthy | IR defect | OR defect | Ball defect |
Healthy | 25 | 0 | 0 | 0 |
IR defect | 0 | 24 | 0 | 1 |
OR defect | 0 | 1 | 24 | 0 |
Ball defect | 0 | 0 | 0 | 25 |
6. Conclusions
In this work, Wavelet Scattering Transform (WST)-based features were employed for the classification of rolling element bearing defects. The application of WST effectively enabled the extraction of scattering coefficients from both healthy and defective bearing signals, which were then used as informative features for classification. The results demonstrated that these scattering coefficients capture critical signal characteristics that are valuable for fault diagnosis. The experimental investigation confirmed that the proposed method is both suitable and effective for detecting defects in rolling element bearings. Moreover, this study highlights the potential of the WST-based approach to be extended beyond bearings to other components in rotating machinery.
References
-
P. D. Mcfadden and M. M. Toozhy, “Application of synchronous averaging to vibration monitoring of rolling element bearings,” Mechanical Systems and Signal Processing, Vol. 14, No. 6, pp. 891–906, Nov. 2000, https://doi.org/10.1006/mssp.2000.1290
-
N. S. Vyas and D. Satishkumar, “Artificial neural network design for fault identification in a rotor-bearing system,” Mechanism and Machine Theory, Vol. 36, No. 2, pp. 157–175, Feb. 2001, https://doi.org/10.1016/s0094-114x(00)00034-3
-
B. Samanta and K. R. Al-Balushi, “Artificial neural network based fault diagnostics of rolling element bearings using time-domain features,” Mechanical Systems and Signal Processing, Vol. 17, No. 2, pp. 317–328, Mar. 2003, https://doi.org/10.1006/mssp.2001.1462
-
Y. Yang, D. Yu, and J. Cheng, “A fault diagnosis approach for roller bearing based on IMF envelope spectrum and SVM,” Measurement, Vol. 40, No. 9-10, pp. 943–950, Nov. 2007, https://doi.org/10.1016/j.measurement.2006.10.010
-
Y. Lei, Z. He, and Y. Zi, “Application of an intelligent classification method to mechanical fault diagnosis,” Expert Systems with Applications, Vol. 36, No. 6, pp. 9941–9948, Aug. 2009, https://doi.org/10.1016/j.eswa.2009.01.065
-
P. K. Kankar, S. C. Sharma, and S. P. Harsha, “Fault diagnosis of ball bearings using machine learning methods,” Expert Systems with Applications, Vol. 38, No. 3, pp. 1876–1886, Mar. 2011, https://doi.org/10.1016/j.eswa.2010.07.119
-
R. N. Toma et al., “Classification framework of the bearing faults of an induction motor using wavelet scattering transform-based features,” Sensors, Vol. 22, No. 22, p. 8958, Nov. 2022, https://doi.org/10.3390/s22228958
-
M. Afshar, M. Heydarzadeh, and B. Akin, “Multi-sensory distributed bearing fault classification using wavelet scattering transform,” 2023 IEEE Energy Conversion Congress and Exposition (ECCE), pp. 3077–3084, Oct. 2023, https://doi.org/10.1109/ecce53617.2023.10362239
-
S. Kavathekar, N. Upadhyay, and P. K. Kankar, “Fault classification of ball bearing by rotation forest technique,” Procedia Technology, Vol. 23, pp. 187–192, Jan. 2016, https://doi.org/10.1016/j.protcy.2016.03.016
-
P. K. Kankar, S. C. Sharma, and S. P. Harsha, “Rolling element bearing fault diagnosis using wavelet transform,” Neurocomputing, Vol. 74, No. 10, pp. 1638–1645, May 2011, https://doi.org/10.1016/j.neucom.2011.01.021
-
V. Vakharia, V. K. Gupta, and P. K. Kankar, “Efficient fault diagnosis of ball bearing using relief and random forest classifier,” Journal of the Brazilian Society of Mechanical Sciences and Engineering, Vol. 39, No. 8, pp. 2969–2982, Jan. 2017, https://doi.org/10.1007/s40430-017-0717-9
-
N. Upadhyay and P. K. Kankar, “Diagnosis of bearing defects using tunable Q-wavelet transform,” Journal of Mechanical Science and Technology, Vol. 32, No. 2, pp. 549–558, Feb. 2018, https://doi.org/10.1007/s12206-018-0102-8
-
J. Bruna and S. Mallat, “Invariant scattering convolution networks,” IEEE Transactions on Pattern Analysis and Machine Intelligence, Vol. 35, No. 8, pp. 1872–1886, Aug. 2013, https://doi.org/10.1109/tpami.2012.230
-
S. Mallat, “Group invariant scattering,” Communications on Pure and Applied Mathematics, Vol. 65, No. 10, pp. 1331–1398, Jul. 2012, https://doi.org/10.1002/cpa.21413
-
V. Peddinti, T. Sainath, S. Maymon, B. Ramabhadran, D. Nahamoo, and V. Goel, “Deep scattering spectrum with deep neural networks,” in ICASSP 2014 – 2014 IEEE International Conference on Acoustics, Speech and Signal Processing (ICASSP), pp. 210–214, May 2014, https://doi.org/10.1109/icassp.2014.6853588
-
C. Cortes and V. Vapnik, “Support-vector networks,” Machine Learning, Vol. 20, No. 3, pp. 273–297, Sep. 1995, https://doi.org/10.1007/bf00994018
-
R. Tadeusiewicz, “Neural networks: a comprehensive foundation,” Control Engineering Practice, Vol. 3, No. 5, pp. 746–747, May 1995, https://doi.org/10.1016/0967-0661(95)90080-2
-
J. R. Quinlan, “Improved use of continuous attributes in C4.5,” Journal of Artificial Intelligence Research, Vol. 4, pp. 77–90, Mar. 1996, https://doi.org/10.1613/jair.279
-
K. Loparo, “Bearings vibration data set.” Case Western Reserve University, https://csegroups.case.edu/bearingdatacenter/pages/welcome-case-western-reserve-university-bearing-data-center-website
About this article

The authors have not disclosed any funding.
The datasets generated during and/or analyzed during the current study are available from the corresponding author on reasonable request.
Heena Khan: conceptualization, literature review, and manuscript preparation. Dr. Nitin Upadhyay: supervisor methodology design, data analysis, and results interpretation. Prof. Vaibhav Shivhare: implementation, visualization and manuscript writing.
The authors declare that they have no conflict of interest.
