Abstract
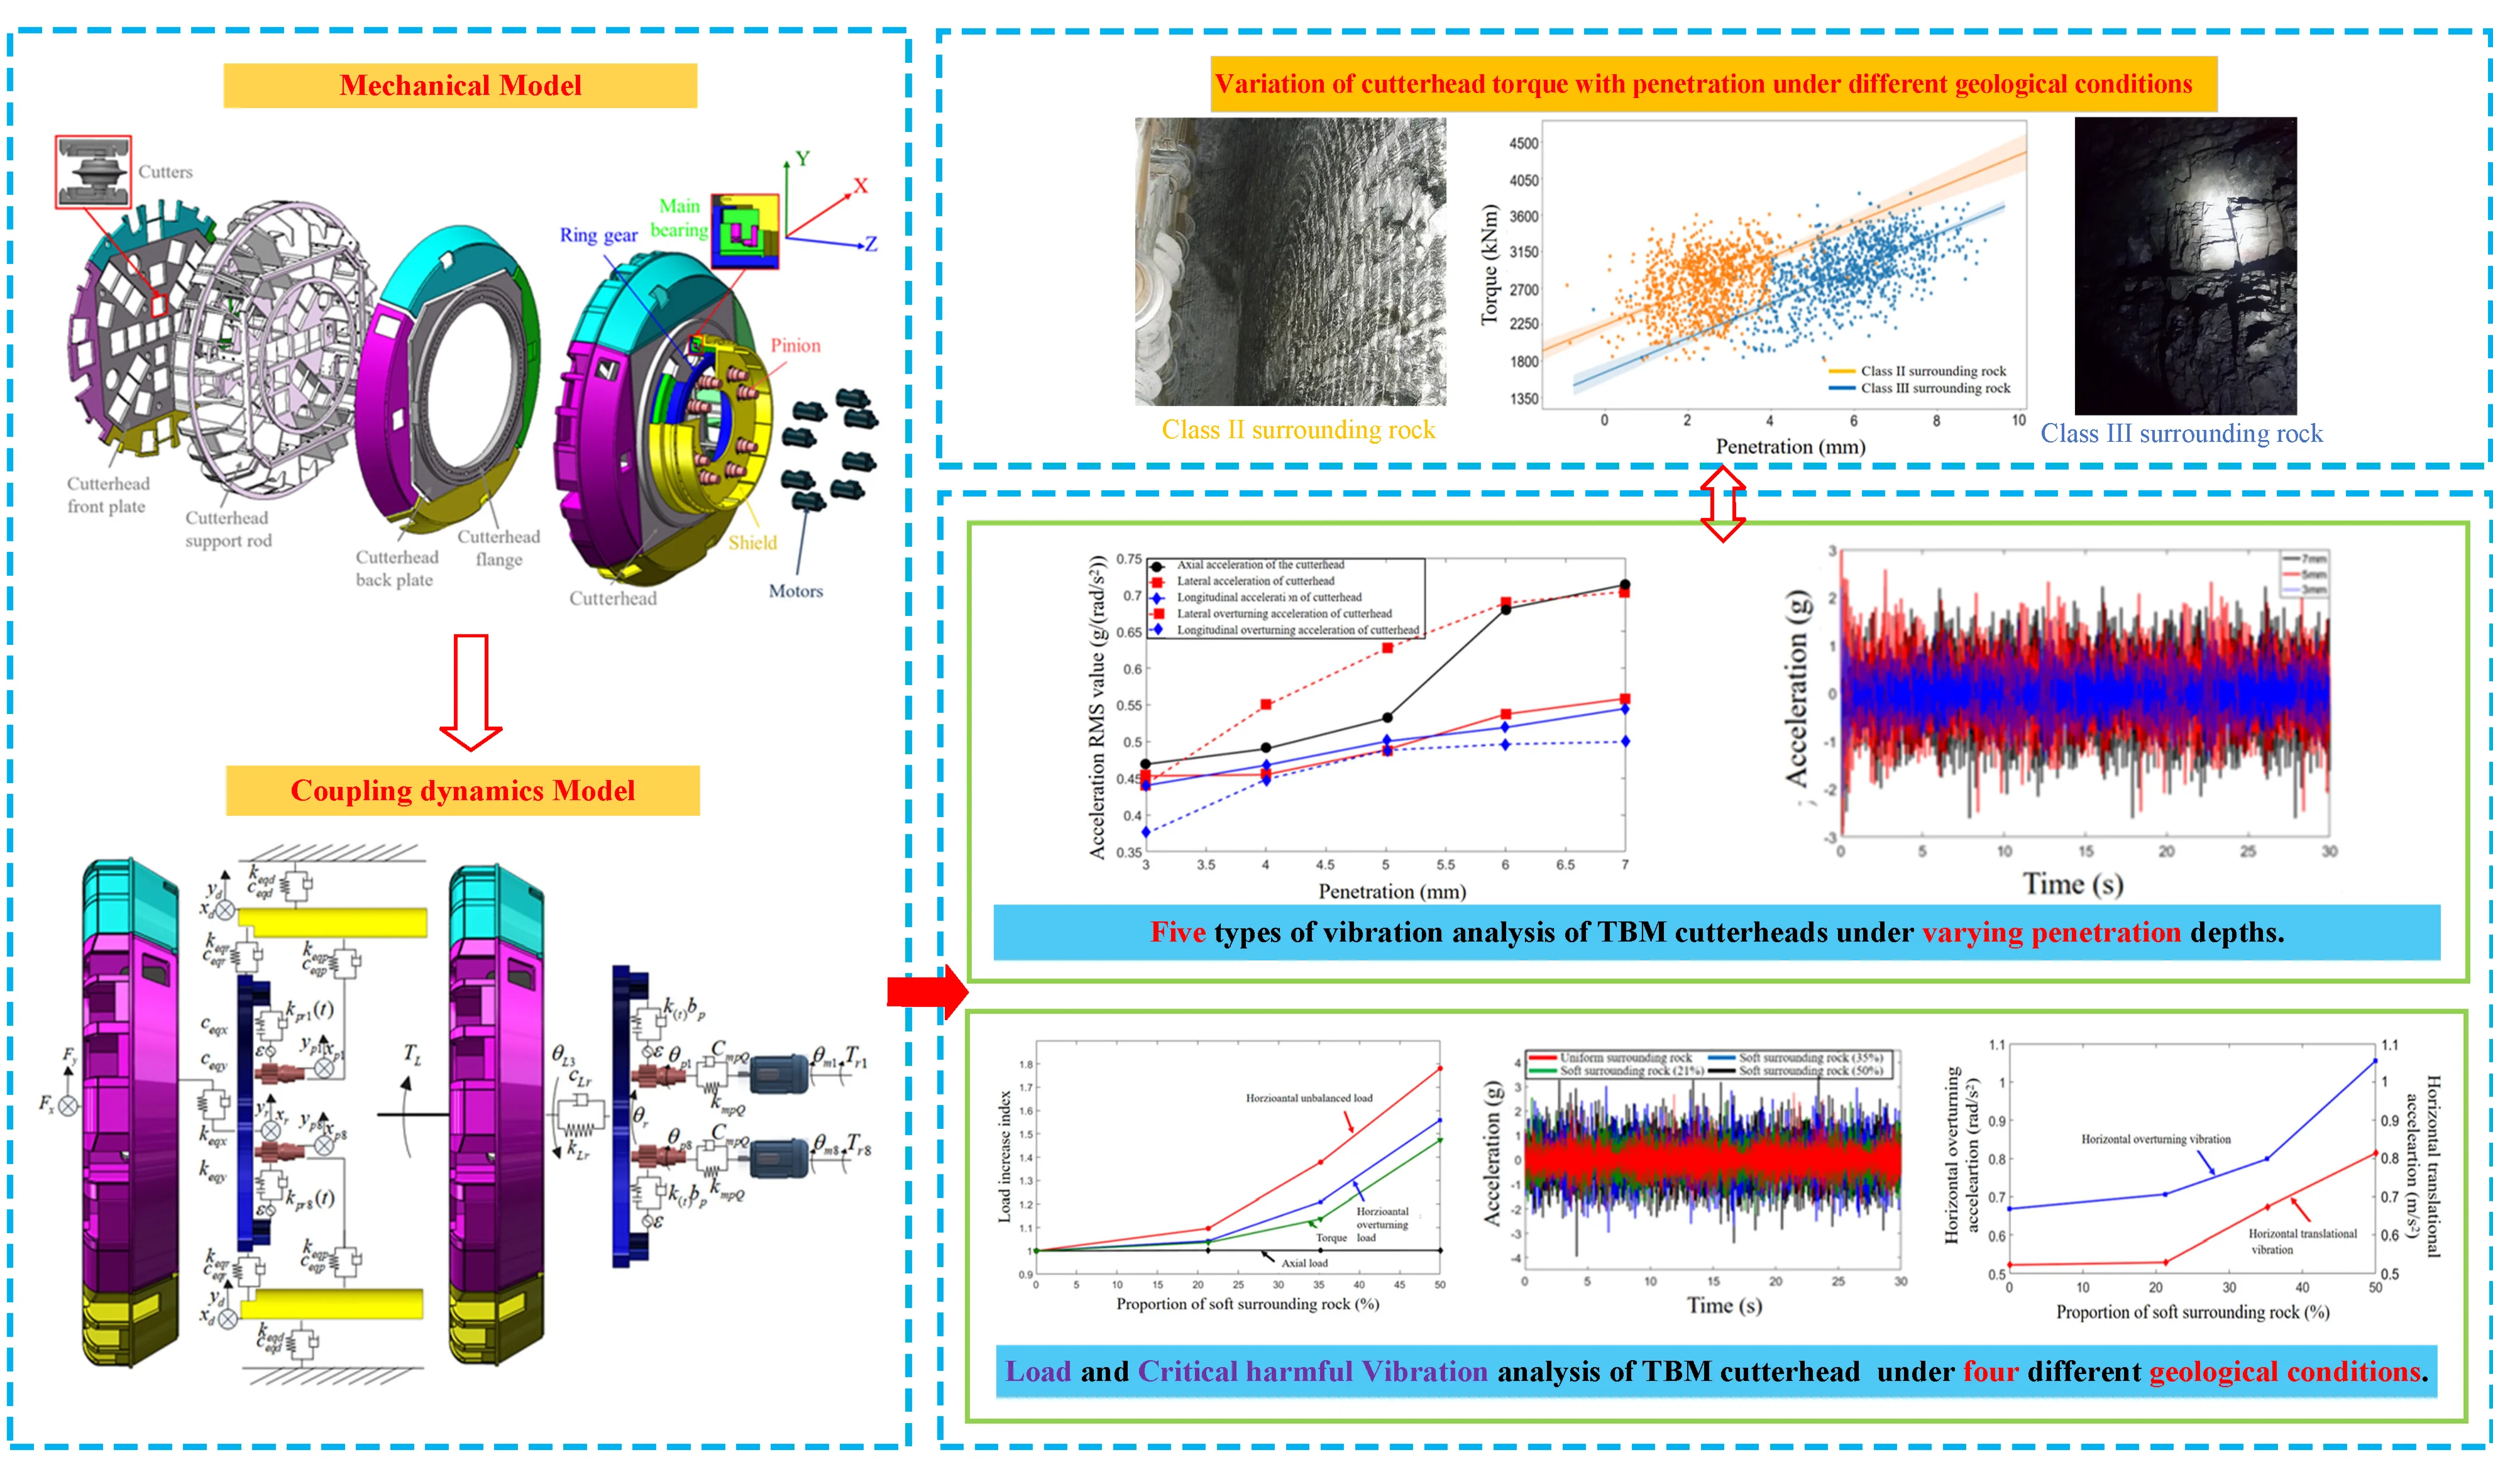
In order to ensure the reliable operation of TBM excavation process, it is particularly important to analyze the vibration characteristics in complex surrounding rock environments. The coupling dynamics model of the TBM main drive system proposed in this article considers the structural characteristics of distributed support and multi-source inputs, as well as nonlinear internal excitations such as bearing dynamic stiffness, gear meshing error, and tooth side clearance, which can more accurately calculate the dynamic characteristics of the main drive system. Based on the TBM scale test-bed, the modeling method and the vibration response of the main components were compared and verified. Based on the coupled dynamic model of the main driving system, the vibration characteristics of the driving system were analyzed under different excavation penetrations and different proportions of soft and hard surrounding rocks. The analysis results show that during the process of penetration from 5 mm to 6 mm, the average vibration increase speed is the highest, reaching 0.1493 g/mm. As the proportion of soft surrounding rock increases, the lateral unbalanced load and torque of the cutterhead significantly increase. Meanwhile, as the proportion of soft surrounding rock increases, the corresponding rate of load increase significantly increases. Within the range where the proportion of soft surrounding rock increases from 21 % to 35 %, its lateral overturning vibration RMS value increases by 13.08 %. Within the range where the proportion of soft surrounding rock increases from 35 % to 50 %, its lateral overturning vibration RMS value increases by 32.18 %. This can easily cause safety accidents such as the fracture of key load-bearing components of the system during the excavation process.
Highlights
- Developed a multi-DOF coupled model for TBM main drive system incorporating multi-source inputs, gear errors, and bearing nonlinearities.
- Highest vibration acceleration increase occurs at 5–6 mm penetration, posing peak fracture risk to bearings and gears.
- Soft rock >21% drastically amplifies lateral vibration: 35–50% causes 32.18% RMS surge in overturning vibration, accelerating component fatigue.
1. Introduction
The Full-face Hard Rock Tunnelling Boring Machine (TBM) is a large-scale, complex, and integrated equipment that incorporates functions such as excavation, mucking, and lining for tunnel construction. Compared to conventional shield tunneling equipments, TBMs are primarily used in rock geological constructions, such as the construction of railway, highway, water conservancy and hydropower diversion tunnels, subways, and other underground engineering. During excavation, TBMs encounter extreme boundary conditions of surrounding rock, which is great burial depths (exceeding 1600 meters), high hardness (up to 100 MPa), and high quartz content (70 %). Such extreme environments cause severe vibrations and loads on the key components of TBMs during excavation.
The TBMs’ dynamic behaviors of each subsystem are extremely complex due to the extreme conditions encountered during excavation. Also, the distributed and multi-point rock-breaking characteristics of the cutter group will cause the mutual interactions and interventions among subsystems within the TBM’s main drive system. Consequently, predicting the load-bearing behavior and vibration transmission patterns of key components during excavation is a great challenge. It will directly affect the overall stability, lifespan, and excavation performance of the main drive system. Ultimately, this can lead to a series of abnormal failures in the key components of the TBM's main drive system (e.g., large-scale cracking of the cutterhead body, fracture of split-body connecting bolts, cracking at the split-body of the main beam, and overload of drive units), resulting in severe engineering issues.
The vibration, load distribution, and transmission mechanisms within the primary load-bearing structures of TBMs is the key to understand complex dynamic behaviors of the system under impact loads. It can solve the severe vibrations and extreme loads endured by the key components of TBM's main drive system. This paper will elaborate on the current research status both domestically and internationally, focusing on several aspects, including the study of external excitations on TBMs, the investigation of dynamic characteristics of TBM systems, and the modeling and solution methods for coupling dynamics.
The TBM’s cutterhead rock-breaking load is the external excitation of the main drive system. It directly influences the accuracy of system dynamic characteristic research [1]. Research on cutters’ rock-breaking loads is primarily conducted through three methods: laboratory cutter rock-breaking experiments, numerical model simulations, and field measurements [2-4]. Under typical excavation conditions, the rotational speed of the TBM cutterhead is 4 to 6 rpm, while the total system thrust exceeds 12000 kN and the total system torque is 4000 KNm. To withstand such heavy loads, the system's structural rigidity is relatively high. To maintain system stability, support cylinders are installed at multiple locations within the TBM’s main drive system. Under this structural configuration, the primary structures of the TBM’s main drive primarily exhibit rigid body vibrations under low-frequency loads. Additionally, the drive system of the TBM’s main drive is a typical multi-gear drive system. Consequently, scholars mostly adopt the lumped mass method for dynamic modeling of the TBM’s main drive system. Under extreme vibrations and loads, it is highly susceptible to causing abnormal damage to critical components, such as the main load-bearing bearings and drive motors. Consequently, to study the dynamic characteristics like vibration loads within the system, scholars primarily focus on the multi-gear synchronous drive configuration and the main bearing structural features of TBM main drive system. Based on gear dynamics and bearing dynamics, a dynamic model of the TBM main drive system is established. It’s the foundation for studying the dynamic characteristics. Liu et al. [5] established a mathematical equivalent model for the drive control system of shield tunneling machines, considering the torque master-slave control strategy of the main drive system and the driving characteristics of asynchronous motors. The load-sharing characteristics of the system under various operating conditions with sudden changes in external loads are analyzed. Sun et al. [6] focused on the structural characteristics of the TBM cutterhead-main drive system, comprehensively considering factors such as dynamic mesh stiffness of gear teeth and bearing stiffness, derived the deformation compatibility relationships among the primary structures of the system, and established a multi-degree-of-freedom coupled dynamic model. Then Sun et al. [7] elaborated on this dynamic model by employing the lumped mass method to discretize the primary structural components into mass points. The finite element method was used to model the subsystems of the drive shafts within the main drive system. Finally, a hierarchical dynamic modeling method was adopted to integrate these multi-subsystem model. The analysis of the dynamic characteristics of the synchronous drive transmission system is more accurate.
Based on the former dynamics models of TBM's main drive system, scholars have conducted follow-up research on the system’s inherent characteristics and dynamic behaviors under impact loads. The dynamic characteristics of the system primarily encompass the inherent properties of the main drive system and its dynamic responses under typical external loads. The latter specifically includes the dynamic load characteristics of key load-bearing components, the vibration characteristics of core components, and the synchronization characteristics of the synchronous drive system. For instance, Huo et al. [8-9] established an equivalent dynamics model of the TBM's main drive system using Adams. The influence of the system’s front-end support stiffness on the vibration characteristics of the main drive system is analyzed. Xia et al. [10] built a multi-body dynamics simulation platform, applied a field vibration measurements of the TBM’s support and propulsion system. The vibration frequency bands of the support and propulsion system is investigated. The results showed that the vibration of the main beam was predominantly axial, with the primary vibration frequency bands concentrated between 20 Hz and 30 Hz. Peng et al. [11] established a mathematical model for the axial dynamic response of the main propulsion hydraulic cylinder, considering the intense vibration characteristics of the TBM during excavation. Tang et al. [12] used interval uncertainty theory to describe the uncertainty of formation parameters and, in conjunction with dynamic models, analyzed the vibration characteristics of TBMs in composite strata. The influence of the ratio of soft to hard rocks in the strata and the orientation of stratigraphic interfaces on these vibration characteristics were explored.
In summary, in terms of the dynamic design of the TBM main drive system, scholars primarily rely on existing cutterhead system dynamics models and support/propulsion system dynamics models to investigate and analyze the inherent and dynamic characteristics of the partial main drive system. However, due to the limitations in modeling accuracy and lack of actual test data on the main drive, the descriptions of system dynamic characteristics offered by these models are often inaccurate. Additionally, existing research rarely involved dynamic performance analysis under various typical operating conditions during the tunneling process. The more extreme loads encountered under these typical conditions put forward higher dynamic performance requirements on the main drive system during actual tunneling. Therefore, to achieve long-term stable and reliable operation of TBMs, system dynamic performance analysis under typical extreme operating conditions is indispensable. Regarding the dynamic performance of TBM main drive systems in service under varying penetration rates, surrounding rock conditions, and other major tunneling conditions in the field. This study provides theoretical and experimental basis for research on the dynamic characteristic mechanisms and system dynamics design of TBM main drive systems.
2. Coupling dynamic model of main drive system
The typical TBM main drive system is shown in the Fig. 1, which consists of a main drive system and a supporting propulsion system. The main drive system consists of a cutterhead, a large gear ring, a main bearing, a support shell, drive gears, reducers, and drive motors. Each drive gear, reducer, and drive motor are positioned on the support shell. Multiple sets of synchronous motors, under the control of the synchronous drive system, synchronously drive the large gear ring to rotate, and rotates the cutterhead. The support shell is connected to the side shield and top shield through wedge cylinder, upper left and right cylinder and top cylinder around the support shell.
In practical engineering, the top shield is tightened against the overhead surrounding rock under the pressure of the top cylinder, thereby maintaining the longitudinal stability of the front section of the main drive. Simultaneously, the side shields are secured under the combined action of the wedge cylinder and the upper left and right cylinders, ensuring the horizontal stability of the front section of the main drive. During each cycle, the shoes are horizontally tightened against the surrounding rock by the shoe cylinders. The main beam and saddle are connected via slide rails, allowing for forward and backward movement. The extension of the main thrust cylinder pushes the main beam forward, completing the axial movement of the TBM. The main drive system and supporting propulsion system are consolidated by flanges at the front section of the main beam, with the supporting propulsion system providing axial support for the entire main drive system. Through the coordinated operation of the main drive system and supporting propulsion system, the rotation and rock-breaking actions of the main drive along the tunneling direction are achieved.
Fig. 1Schematic diagram of the structure of the TBM main drive system
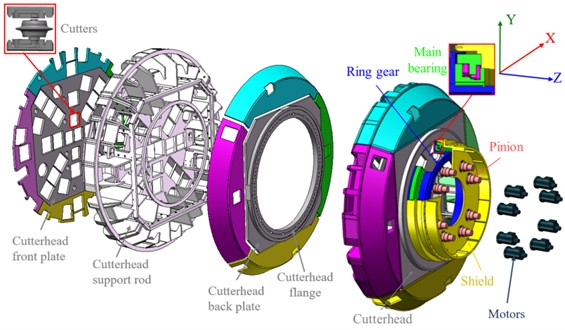
Fig. 2Dynamic model of TBM main drive system
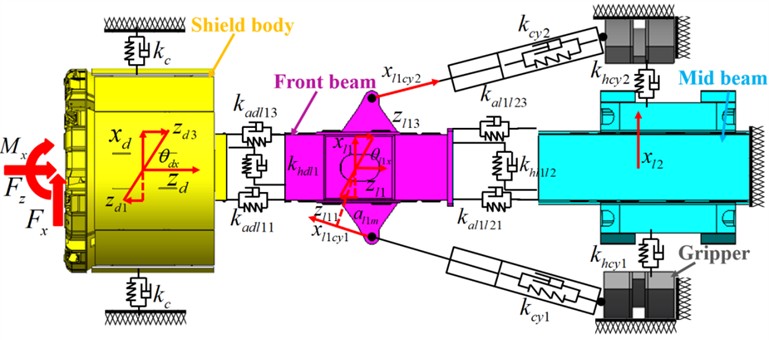
a) Dynamic model of TBM supporting propulsion system
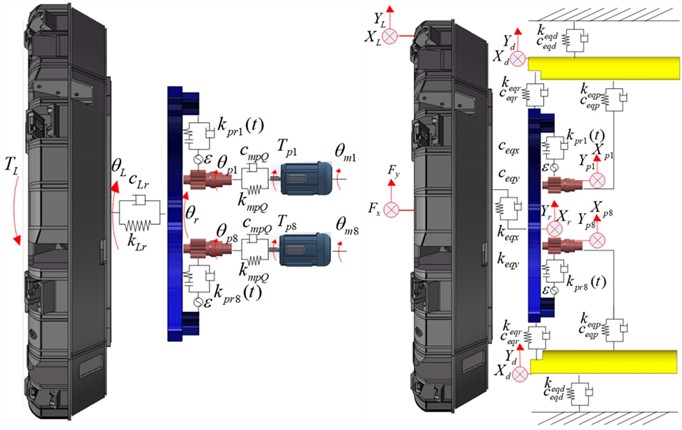
b) Dynamic model of TBM drive system (Lateral viewing angle)
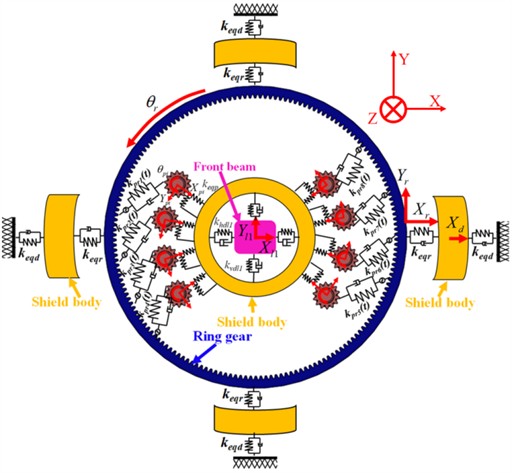
c) Dynamic model of TBM drive system (Axial viewing angle)
2.1. The bending and twisting coordination relationship between the main drive system's large gear ring and the drive gear
When the main drive system is working, each small gear synchronously drives the large gear ring to rotate. According to the different structures of the main drive system, the drive mode can be divided into internal and external meshing. When the gear drive is external meshing, the relative displacement relationship between the pinion and the large gear ring is shown in Fig. 2(c). Project the displacement of the pinion and the large gear ring onto the meshing line, thereby obtaining the relative elastic deformation between the large gear ring and the pinion as :
where, and are the displacement of the large gear ring and small gear on the meshing line; , , , are the horizontal and vertical displacements of the large gear ring and the small gear ring; and are the meshing angle and the phase angle of each pinion gear.
In the TBM main drive system model, the equivalent meshing error generated by the large gear ring and the small gear on the meshing line is as Eq. (2):
Among them, , , , are the manufacturing error, installation error, tooth thickness deviation and tooth profile error of the large gear ring. , , , is the manufacturing errors, installation errors, tooth thickness deviations, and tooth profile errors of pinions; is the meshing angle of the internal gear transmission; is the azimuth angle of each pinion; , , , are the phase angles of each error; and are the angular velocities of the large gear ring and the small gear. Based on the relative deformation relationship and considering the backlash, the time-varying meshing force and the time-varying meshing damping force of the gear can be calculated, as shown in Eqs. (3) and (4). The vibrations discussed in this paper are predominantly low-frequency, the damping elements may have a negligible impact on the overall response:
where, and are the time-varying meshing stiffness and damping of each pinion gear, and is the nonlinear function of the meshing clearance, which is calculated according to Eq. (5):
where, the side clearance of the gear pair is 2.
2.2. Establishment of system dynamics differential equation group
The dynamic equations of TBM supporting propulsion system and driving system are as follows.
Bending torsion coupling direction:
Axis overturning coupling direction:
2.3. Parameter correction for the dynamic model
In the dynamic model of the main drive system, the structural stiffness of the front and middle sections of the main beam is calculated using the finite element method. This approach involves applying a unit load at the tunneling-direction end of the structure, extracting the average deformation in specified directions, and thereby estimating the structural stiffness in various directions. Based on the experimental vibration data obtained from the scaled cutterhead test platform, the parameters of the dynamic model are adjusted to minimize the error objective function, as shown in Eq. (8). Here, and represent the calculated and measured values of the cutterhead's axial vibration, respectively; and represent the calculated and measured values of the main beam’s lateral vibration, respectively; and is the calculated and measured values of the axial vibration in the front section of the main beam, respectively:
2.4. Vibration experiments based on a scaled-down TBM platform
To validate the accuracy of the dynamic model of the TBM main drive system, vibration experiments under simulated thrust conditions using a scaled-down TBM platform is conducted, as shown in Fig. 3. The experiment employs dual hydraulic actuators to simulate the impact loads acting on the cutterhead. Vibration measurement point T1 is located inside the center of the TBM cutterhead, while measurement point T2 is located on the upper section of the TBM main beam’s front part. Triaxial accelerometers are installed at measurement points T1 and T2, as illustrated in Fig. 4(b) and (c). At point T1, the accelerometer measures vibrations in the -direction, which aligns with the axial direction of the scaled-down TBM platform's propulsion, and in the -direction, which aligns with the horizontal direction of the platform. At point T2, the accelerometer measures vibrations in the -direction, which aligns with the axial direction of the TBM, and in the -direction, which aligns with the horizontal direction of the TBM. A signal receiver is installed at the end of the main beam to collect sensor data.
Fig. 3Vibration experiments based on a scaled-down TBM platform
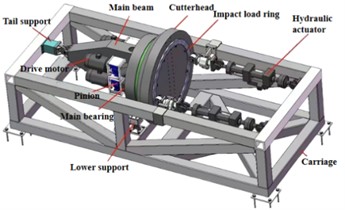
a) Structure of TBM scale test bench
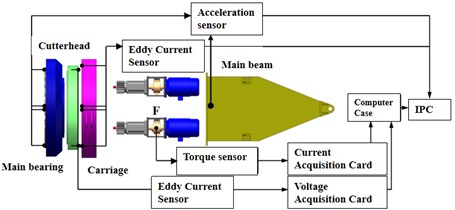
b) Layout of sensors for TBM scale test bench

c) Experimental process of TBM scale test bench
3. Comparative analysis of model vibration response and experimental results
Vibration measurements were conducted on a scaled-down TBM platform to simulate the thrust process of a TBM. For the vibration data obtained from the experiments, a 30-second segment of the test data from each measurement location was extracted and used as the optimization target for determining the stiffness parameters of the dynamic model. The stiffness parameters of the main drive system’s key structures were optimized using the method described earlier in this study. The dynamic model was solved using the Newmark- method, with integration parameters set to 0.5, 0.25. The time step is 0.005 s. The optimization history of each parameter and the optimization target is illustrated in the Fig. 4, and the optimization results are summarized in the Table 1.
Table 1The optimization results
f | (N/m) | (N/m) | (N/m) | (N/m) |
1.569 | 7.55×10⁸ | 7.25×10⁸ | 1.40×10⁹ | 1.44×10⁹ |
As shown in the Fig. 4 and Table 1, the optimization process for the stiffness parameters and objective function reaching stable values converges after 100 steps. The optimized stiffness values and are determined to be 7.55×10⁸ N/m and 7.25×10⁸ N/m, respectively. Consequently, the axial stiffness between the TBM shield and the front section of the main beam is 3.02×10⁹ N/m. The axial stiffness between the front and middle sections of the main beam is and 2.9×10⁸ N/m. Similarly, the lateral stiffness between the TBM shield and the front section of the main beam is 1.4×10⁹ N/m, and the lateral stiffness between the front and middle sections of the main beam is 1.44×10⁹.
After the optimization, the dynamic model’s calculated acceleration values at the cutterhead center and the front section of the main beam (both lateral and axial directions) are compared with the experimental data, as illustrated in the accompanying Fig. 5 and Fig. 6. The statistical comparison of the calculated and measured acceleration values at each location is summarized in the Table 2.
Fig. 4Optimization history diagram
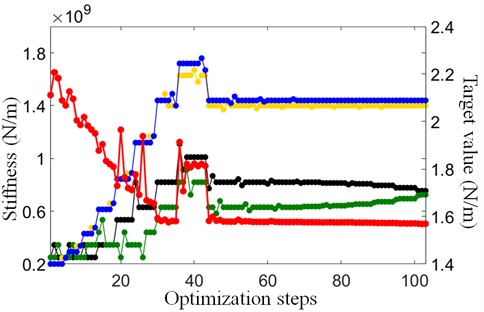
Fig. 5Comparison of calculated and experimental results
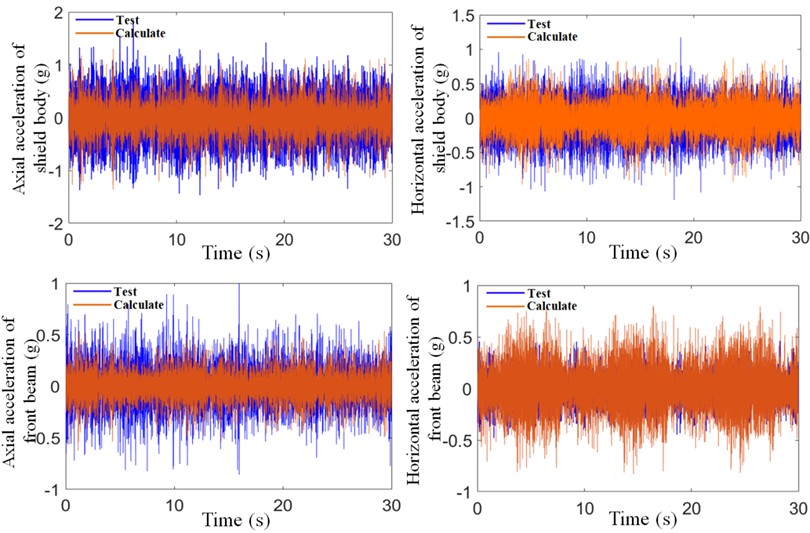
As shown in Fig. 5 and Fig. 6, the axial acceleration RMS values are the highest at both the cutterhead and the front section of the main beam, while the radial acceleration values are relatively smaller. Furthermore, the time-domain responses calculated by the model, which was refined using field-measured data, closely match the experimental results. The calculation errors for the axial and radial accelerations at the cutterhead are approximately 8 %, while the errors for the accelerations at the main beam are within 20 %. Additionally, the distribution of vibration accelerations across all measured locations is consistent, indicating that the dynamic model, calibrated using experimental data, achieves high computational accuracy. This demonstrates the model's capability to accurately describe the vibration behavior of the main drive system under operational conditions.
Fig. 6Acceleration distribution diagram
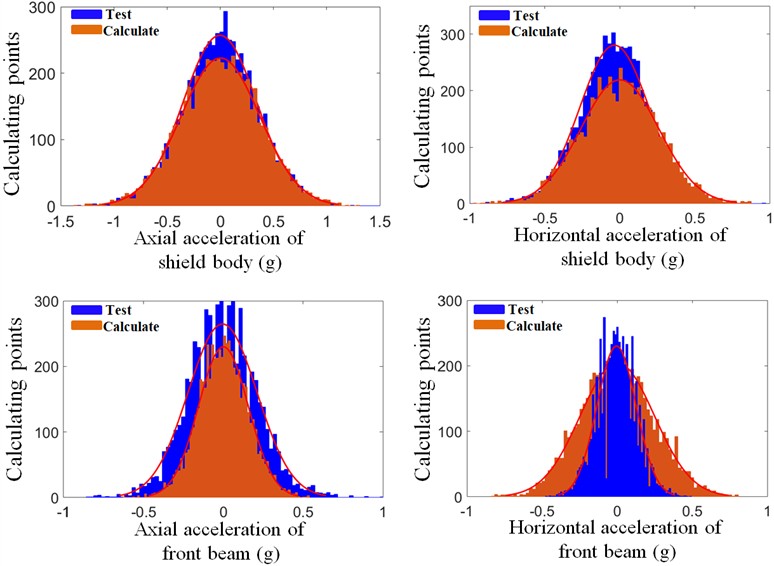
Table 2Statistical value of vibration data
Type position | Cutterhead horizontal vibration | Cutterhead axial vibration | Main beam front part horizontal vibration | Main beam front part axial vibration |
Test (g) | 0.2410 | 0.3533 | 0.1301 | 0.2162 |
Calculate (g) | 0.2586 | 0.3722 | 0.1560 | 0.2464 |
Error | 7.30 % | 0.53 % | 19.91 % | 13.97 % |
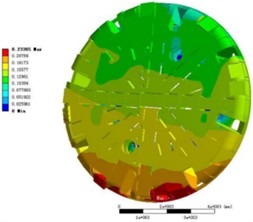
In the dynamic model, the equivalent load of the cutterhead is loaded by the limit load of the cutter, shown in Fig. 7(a). In order to obtain the safety margin of the cutterhead structure under the same load, the transient dynamic analysis of the cutterhead structure was carried out to obtain the overall deformation and strain of the cutterhead under the same load. During the loading process, each cutter on the cutterhead bears the ultimate load, and the vertical force, rolling force and the gravity of the cutterhead are applied on each cutter base. The loading scheme of the finite element model is shown in the following figure. After the pre-processing of finite element analysis, the overall stress distribution of the cutterhead is extracted in the post-processing module, as shown in Fig. 7(b).
It can be seen from the calculation results above that the maximum stress generated in the cutterhead part under this working condition is about 146 MPa, which occurs at the intersection of the support flange and the cutterhead support rib. The calculated results of the cutterhead under this limit load are less than the allowable stress limit of the material, and the structural strength meets the design requirements. Extract the overall deformation of the cutterhead as shown in the Fig. 7(c). The maximum deformation of the cutterhead is 0.23 mm which occurs in the connection area of the cutter holder support plate at the lower split edge of the cutterhead. The overall deformation of the cutterhead is reasonable and can meet the requirements of practical application. Due to the long-term service conditions of the cutterhead, the industry generally requires that the maximum stress value of the cutterhead component is less than 250 MPa [15]. Therefore, when the axial vibration RMS of the cutterhead calculated by the dynamic model in this paper is 0.3722 g, the maximum stress safety margin of the structure is at least 100 MPa.
Fig. 7Transient dynamic analysis of the cutterhead structure under ultimate load
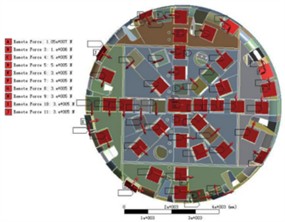
a) Load setting
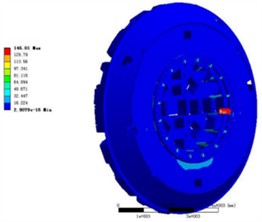
b) Strain of the cutterhead
c) Deformation of the cutterhead
4. Dynamic analysis under typical tunneling parameters
4.1. Dynamic response of the main drive transmission system
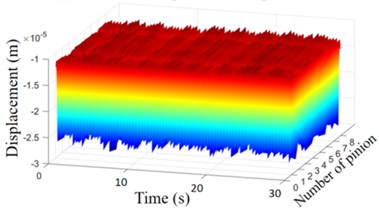
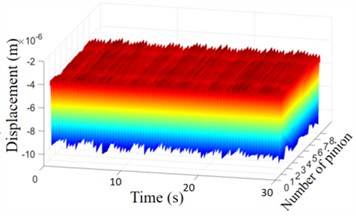
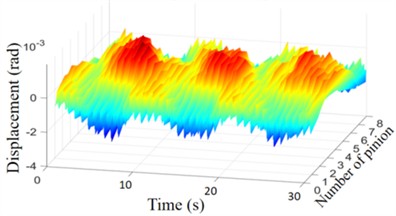
Based on the verified modeling method, the dynamic response of TBM is calculated by using the real open TBM structure and tunneling parameters, as shown in Table 3. The meshing vibration characteristics between the large ring gear and the pinion gear directly influence the stability of the cutterhead rotation and the longevity of the gears. Based on the validated dynamic model, the vibration response of the TBM main drive transmission system under actual tunneling conditions is calculated, as shown in the Fig. 8.
Table 3Main parameters of TBM
Component | Parameters | Values |
Cutterhead | Diameter | 8.53 |
Main bearing | Outer diameter | 5.3 |
Gears | Number of ring gear teeth | 174 |
Number of pinion teeth | 14 | |
Modulus | 22 | |
Pressure angle | 20 | |
Reduction ratio | 1:22 | |
Meshing type | Inner mesh | |
Motors | Number | 8 |
Class II surrounding rock | the basic quality index (BQ) of rock mass | 451-550 |
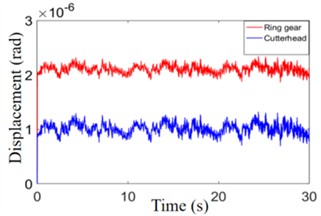
As shown in Fig. 8, the vibration states of the drive gears in the TBM transmission system are similar, with their radial vibration amplitudes fluctuating stably within the range of 1×10⁻⁵-2.5×10⁻⁵m. In contrast, the torsional vibrations exhibit significant periodic fluctuations, with a maximum amplitude of 4.5×10⁻³ rad. The mean torsional vibration of the large ring gear remains stable at approximately 1×10⁻⁶ rad, with an amplitude of around 2.1×10⁻⁶ rad. Similarly, the mean torsional vibration of the cutterhead stabilizes at approximately 2.1×10⁻⁶ rad, with an amplitude of about 2.1×10⁻⁷ rad.
4.2. System vibration characteristics with tunneling penetration
During the actual tunneling process of TBM, its penetration is one of the main factors affecting the maximum external load of the main drive. Its set value directly determines the magnitude of the vibration of the main drive system [13, 14]. The penetration value is determined and adjusted by the main drive operator based on experience and actual surrounding rock conditions. The real-time torque data fed back by the main drive system is used as reference value. The operator cannot accurately know the vibration of the system while operating and controlling the main drive to achieve the desired penetration. Therefore, it is necessary to investigate the vibration of the system under different penetration levels of the main drive, in order to provide the operator with parameter selection reference. The variation of cutterhead torque with penetration under different geological conditions is shown in Fig. 9, which is obtained from the actual tunneling data of the main drive system.
Fig. 8Dynamic response of the main drive transmission system
a) Horizontal displacement of pinion
b) Vertical displacement of pinion
c) Torsional displacement of pinion
d) Torsional displacement change rule
Fig. 9Variation of cutterhead torque with penetration under different geological conditions
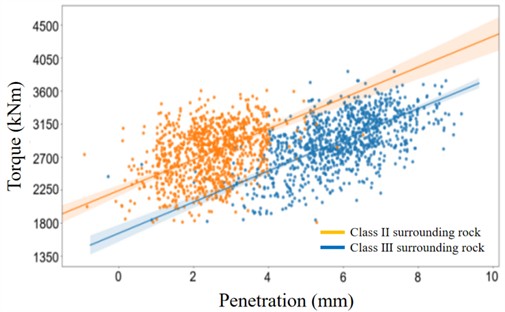
It is shown in Fig. 9, the impact of tunneling penetration on system load is significant. Under the condition of Class II surrounding rock, the penetration depth of field tunneling is generally selected within the range of 2 mm-7 mm. At the same time, as the penetration of the tunneling increases, the torque load of the system increases significantly. The relationship between the penetration rate and the torque load of the cutterhead is fitted using the quadratic programming method as follows:
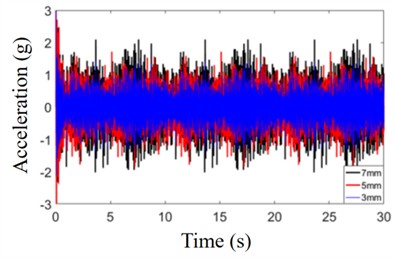
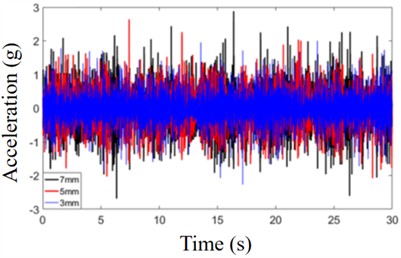
where, is the system tunneling penetration, and is the torque load the cutterhead. The equivalent load factor of the corresponding cutterhead equivalent load is determined based on the cutterhead torque loads at different penetration depths. The corresponding axial force, lateral and longitudinal imbalance force, and lateral and longitudinal overturning moment of the cutterhead are calculated according to the relevant calculation method for the cutterhead equivalent load, as shown in Table 4. According to the statistical data of the RMS value of the cutterhead vibration response, the variation law of the cutterhead acceleration response with the penetration value is obtained as shown in Fig. 10.
Fig. 10Acceleration response of cutterhead at different penetration depths
a) Axial acceleration of the cutterhead
b) Lateral acceleration of cutterhead
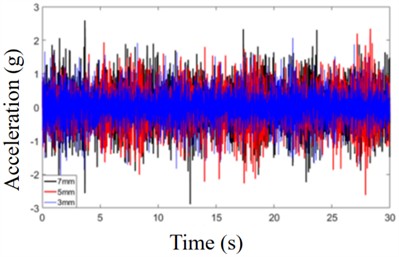
c) Longitudinal acceleration of cutterhead
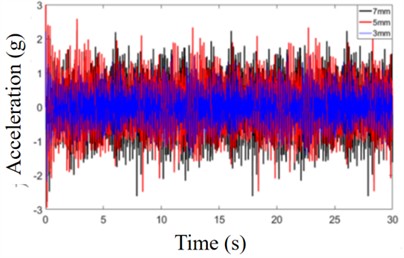
d) Lateral overturning acceleration of cutterhead
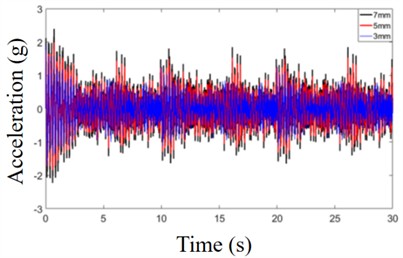
e) Longitudinal overturning acceleration of cutterhead
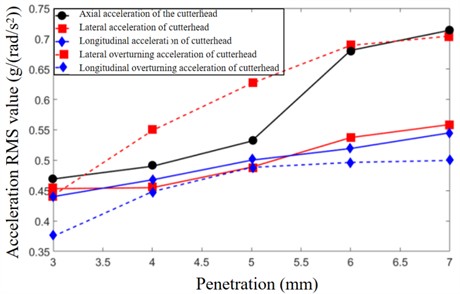
It can be seen from Fig. 11, with the increase in tunneling penetration, the RMS values of the vibration in all directions of the cutterhead showed a significant increasing trend. When the penetration increases from 3 mm to 5 mm, the average increase rate of its RMS value is 0.0311 g/mm. When the penetration increases from 5 mm to 6 mm, the average increase in vibration speed is the largest, reaching 0.1493 g/mm. When the penetration increases from 6 mm to 7 mm, the average increase rate of vibration decreases to 0.0331 g/mm. The RMS values of the cutterhead's lateral and longitudinal accelerations increase at a relatively consistent rate during the rise in penetration depth, reaching 0.0264 g/mm and 0.0262 g/mm, respectively. The RMS value of lateral and longitudinal overturning vibration increases rapidly at first and then slowly as the penetration increases. The RMS value of lateral overturning vibration increases at a rate of 0.0822 rad/s2/mm. When the penetration increases from 3 mm to 6 mm. After the penetration reaches 6mm, the RMS value of lateral overturning vibration increases slowly at a rate of 0.0153 rad/s2/mm. When the penetration increases from 3 mm to 5 mm, the RMS value of its longitudinal overturning vibration increases at a rate of 0.0567 rad/s2/mm, while after the penetration reaches 5 mm, the RMS value of its lateral overturning vibration increases slowly at a rate of 0.0057 rad/s2/mm.
Table 4RMS values of cutterhead load under different penetration depths in Class II surrounding rock
Penetration | Torque / kNm | Axial force / kN | Lateral force / kN | Longitudinal force / kN | Lateral overturning / kNm | Longitudinal overturning / kNm |
3 mm/rev | 2.28e3 | 4.49e3 | 110.53 | 135.74 | 1.39e3 | 1.39e3 |
4 mm/rev | 2.49e3 | 4.90e3 | 117.62 | 135.06 | 1.51e3 | 1.53e3 |
5 mm/rev | 2.71e3 | 5.31e3 | 121.68 | 138.04 | 1.63e3 | 1.66e3 |
6 mm/rev | 2.92e3 | 5.73e3 | 138.42 | 142.67 | 1.76e3 | 1.78e3 |
7 mm/rev | 3.13e3 | 6.15e3 | 140.24 | 155.72 | 1.89e3 | 1.93e3 |
Fig. 11Variation of RMS value of cutterhead vibration with penetration
4.3. Dynamic characteristic analysis under the boundary of soft and hard interlaced surrounding rock
TBM often encounters composite surrounding rock conditions of soft and hard rocks during tunneling. When encountering such surrounding rock conditions, if the TBM main drive is tunneling with conventional thrust, due to the uneven load on the cutterhead caused by different rock properties, the cutterhead often experiences more severe overturning moments and unbalanced loads. In order to study the dynamic characteristics of the TBM main drive system under the condition of soft and hard rock interlaced surrounding rock, the equivalent load is obtained according to the cutterhead load synthesizing method. Taking the case where the horizontal distance from the interface of soft and hard rock to the center of the cutterhead is 1 m as an example, the additional load coefficients and of the hard rock under the cutterhead are taken as 1.2438. The compressive strength of soft surrounding rock is about 60 MPa. Due to the fact that the changes in lateral overturning moment and lateral unbalanced load under composite formation conditions are significantly greater than longitudinal overturning moment and longitudinal unbalanced load, only a comparison diagram of the lateral overturning moment, lateral unbalanced load, and torque load of the cutterhead is provided. Due to the rotation of the cutterhead, the phase angle of the three-dimensional load of each cutter changes during the synthesis process, resulting in significant periodic variations in the overturning moment and unbalanced load of the cutterhead. In order to compare the difference in cutterhead load between composite geological conditions and homogeneous geological conditions, the load fluctuation component of about 0.1 Hz due to the rotation of the cutterhead in the overturning moment and unbalanced load of the cutterhead is filtered.
Because the soft surrounding rock is horizontally distributed, its primary impact is on the lateral unbalanced load and torque of the cutterhead. To investigate the influence of soft surrounding rock area on the vibration characteristics of the main drive system under composite geological conditions, the corresponding loads of the cutterhead under different areas of soft surrounding rock are calculated. As the proportion of soft surrounding rock increases, the lateral unbalanced load and torque of the cutterhead increase significantly. Moreover, the corresponding loads increases significantly with the increase of soft surrounding rock propotion. It can be seen that the increase lateral unbalanced load and lateral overturning moment will cause a significant increase in lateral unbalanced vibration. In order to study the variation law of the system's relevant responses, the lateral translational vibration and translational overturning vibration acceleration responses of the TBM main drive system under different sizes of soft surrounding rock areas are extracted as shown in Fig. 12.
From the above analysis, it can be seen that the increase lateral unbalanced load and lateral overturning moment will cause a significant increase in lateral unbalanced vibration.
Fig. 12Vibration of the cutterhead under different geological conditions
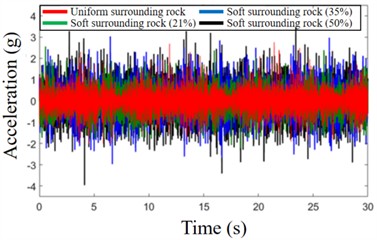
a) Lateral translation vibration of TBM main drive
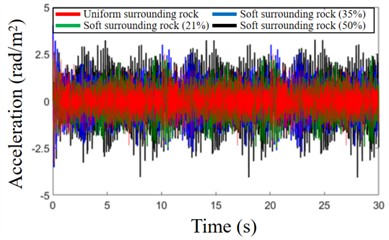
b) Lateral overturning vibration of TBM main drive
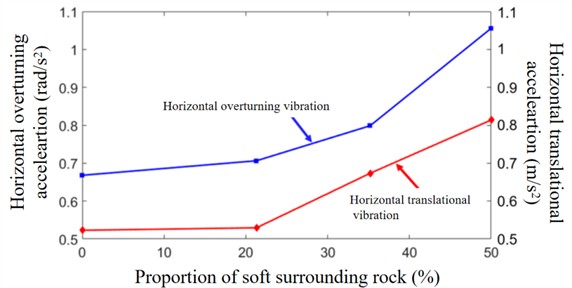
In order to study the variation law of the system's relevant responses, the lateral translational vibration and translational overturning vibration acceleration responses of the TBM main drive system under different sizes of soft surrounding rock areas are extracted as shown in Fig. 13. Due to the significant increase in the lateral unbalanced load of the cutterhead, the lateral unbalanced vibration also increases significantly as the proportion of soft surrounding rock increases. For its lateral overturning vibration, it increases significantly as the proportion of soft surrounding rock increases. When the proportion of soft surrounding rock is in the range of 0 %-21 %, the RMS value of lateral overturning vibration increases by 5.73 %, with an increase rate of 0.018 rad/s2/10 %. When the proportion of soft surrounding rock is in the range of 21 % to 35 %, the RMS value of lateral overturning vibration increased by 13.08 %, with an increase rate of 0.066 rad/s2/10 %. When the proportion of soft surrounding rock is in the range of 35 % to 50 %, the RMS value of lateral overturning vibration increased by 32.18 %, with an increase rate of 0.1713 rad/s2/10 %. When the proportion of soft surrounding rock is in the range of 21 %-50 %, the increasing rate of lateral translational vibration of the cutterhead remains basically unchanged, with an increase of 53.72 % and an increase rate of about 0.098 rad/s2/10 %.
Fig. 13The vibration of the cutterhead under various geological conditions
5. Conclusions
This research analyzes the coupling relationship between the bending and torsional axes of the main drive system, taking the structural characteristics of distributed support and multi-source input into account. It fully considers nonlinear internal excitation such as bearing dynamic stiffness, gear meshing error, and tooth backlash, and establishes a multi-degree-of-freedom coupled dynamic model for the main drive mechanical system. Based on the TBM scale test-bed, the modeling method and the vibration response of the main components were compared and verified. The experimental results show that the axial and radial acceleration calculation errors of the cutterhead and the front section of the main beam are less than 20 %.
Based on the coupled dynamic model of the TBM main drive system, the vibration characteristics of the system under different tunneling penetration depths and different soft-hard staggered surrounding rock boundaries were analyzed. The results show that the average vibration increase rate is the highest during the penetration process from 5 mm to 6 mm, reaching 0.1493 g/mm. As the proportion of soft surrounding rock increases, the lateral unbalanced load and torque of the cutterhead significantly increase. As the proportion of soft surrounding rock increases, the corresponding rate of load increase significantly increases. When the range of the proportion of soft surrounding rock is 0 %-21 %, the RMS value of lateral overturning vibration increases by 5.73 %. When the range of the proportion of soft surrounding rock is 21 % to 35 %, the RMS value of lateral overturning vibration increases by 13.08 %. When the range of the proportion of soft surrounding rock is 35 % to 50 %, the RMS value of lateral overturning vibration increases by 32.18 %.
References
-
H. Zhang, “Numerical simulation study on the tunneling performance of TBM,” (in Chinese), Suidao Jianshe, Vol. 26, pp. 1–7, 2006, https://doi.org/10.3969/j.issn.1672-741x.2006.z2.001
-
A. E. Samuel and L. P. Seow, “Disc force measurements on a full-face tunnelling machine,” International Journal of Rock Mechanics and Mining Sciences and Geomechanics Abstracts, Vol. 21, No. 2, pp. 83–96, Apr. 1984, https://doi.org/10.1016/0148-9062(84)91176-8
-
M. Entacher, S. Lorenz, and R. Galler, “Tunnel boring machine performance prediction with scaled rock cutting tests,” International Journal of Rock Mechanics and Mining Sciences, Vol. 70, No. 1, pp. 450–459, Sep. 2014, https://doi.org/10.1016/j.ijrmms.2014.04.021
-
M. Entacher, G. Winter, and R. Galler, “Cutter force measurement on tunnel boring machines – Implementation at Koralm tunnel,” Tunnelling and Underground Space Technology, Vol. 38, No. 9, pp. 487–496, Sep. 2013, https://doi.org/10.1016/j.tust.2013.08.010
-
R. Liu, J. Z. Sun, Y. Q. Luo, W. Sun, and W. D. Li, “Research on multi-motor synchronization control based on the ring coupling strategy for cutterhead driving system of shield machines,” Applied Mechanics and Materials, Vol. 52-54, pp. 65–72, Mar. 2011, https://doi.org/10.4028/www.scientific.net/amm.52-54.65
-
W. Sun, H. Ma, X. Song, L. Wang, and X. Ding, “Modeling and dynamic analysis of cutterhead driving system in tunnel boring machine,” Shock and Vibration, Vol. 2017, No. 2, pp. 1–12, Jan. 2017, https://doi.org/10.1155/2017/7156816
-
W. Sun, X. Ding, J. Wei, X. Wang, and A. Zhang, “Hierarchical modeling method and dynamic characteristics of cutter head driving system in tunneling boring machine,” Tunnelling and Underground Space Technology, Vol. 52, pp. 99–110, Feb. 2016, https://doi.org/10.1016/j.tust.2015.11.022
-
J. Huo, H. Wu, W. Sun, Z. Zhang, L. Wang, and J. Dong, “Electromechanical coupling dynamics of TBM main drive system,” Nonlinear Dynamics, Vol. 90, No. 4, pp. 2687–2710, Oct. 2017, https://doi.org/10.1007/s11071-017-3831-4
-
H. Wu, J. Huo, Z. Meng, L. Xue, L. Xie, and Z. Zhang, “Load characteristics study with a multi-coupling dynamic model for TBM supporting system based on a field strain test,” Tunnelling and Underground Space Technology, Vol. 91, p. 103016, Sep. 2019, https://doi.org/10.1016/j.tust.2019.103016
-
Y. Xia et al., “Vibration characteristics of the support and propulsion system of tunnel boring machines,” (in Chinese), Journal of Zhejiang University (Engineering Science Edition), Vol. 52, No. 2, pp. 32–38, 2018, https://doi.org/10.3785/j.issn.1008-973x.2018.02.004
-
P. Huan et al., “Structural parameter optimization of the propulsion hydraulic cylinder of the hard rock tunneling machine,” Jixie Gongcheng Xuebao, Vol. 50, No. 21, pp. 76–83, 2014.
-
G. Tang, H. Yu, and Q. Xie, “Dynamic characteristics and evaluation of hard rock tunneling machine under uncertain geological parameters,” (in Chinese), Journal of Shanghai Jiaotong University, Vol. 50, No. 11, pp. 1670–1675, 1711, https://doi.org/10.16183/j.cnki.jsjtu.2016.11.002
-
D. Li and Q. Yan, “Discussion on the TBM construction situation and problems of the Qinling Extra-long Tunnel on the Xikang Railway Line,” (in Chinese), Modern Tunnel Technology, Vol. 1, No. 1, pp. 31–35, 1999.
-
X. Wu, “Analysis of factors affecting the TBM tunneling efficiency in the Zhongtianshan Tunnel,” (in Chinese), Railway Construction Technology, Vol. 1, No. 11, pp. 40–42, 2009, https://doi.org/10.3969/j.issn.1009-4539.2009.11.009
-
E. Ye et al., “Research and analysis of vibration limit of TBM cutterhead under normal driving condition,” (in Chinese), Modular Machine Tool and Automatic Manufacturing Technique, Vol. 6, pp. 159–164, 2022, https://doi.org/10.13462/j.cnki.mmtamt.2022.06.036
About this article
This work was supported by the National Natural Science Foundation of China (Grant No. 51375001), Natural Science Foundation of Zhejiang Province (Grant No. LQN25E050021 and No. LTGY23E070001).
The datasets generated during and/or analyzed during the current study are available from the corresponding author on reasonable request.
Zhongyue Li: conceptualization, formal analysis, fundings acquisition, methodology. Yongjian Jiang: formal analysis, investigation, methodology. Wenjun Xu: investigation, writing-original draft preparation. Lijian Tang: investigation. Kai Fu: methodology, visualization. Shiju E: data curation, investigation. Hanyang Wu: supervision, software.
The authors declare that they have no conflict of interest.
