Abstract
Interior Permanent magnet synchronous motors (IPMSMs) have become the preferred powertrain solution for electric vehicles due to their exceptional performance characteristics. However, the high-frequency electromagnetic noise generated during motor operation poses a significant challenge to occupant comfort within the vehicle. This study provides a comprehensive analysis of the electromagnetic forces, modal characteristics, and vibration noise for a 12-pole, 36-slot IPMSM, incorporating theoretical and simulation-based approaches as well as modal tests. By innovatively combining orthogonal experimental design with nonparametric regression techniques, a response surface model is developed to accurately characterize and optimize the radial electromagnetic force harmonics of the motor. The optimization results reveal a significant 37.7 % reduction in the motor’s surface vibration velocity and an 8.5 % decrease in peak noise levels, successfully meeting the engineering objectives for vibration and noise attenuation. This study not only contributes to the advancement of noise control technologies in electric vehicle power systems but also provides novel insights and methodologies for motor design, offering significant practical value and engineering relevance.
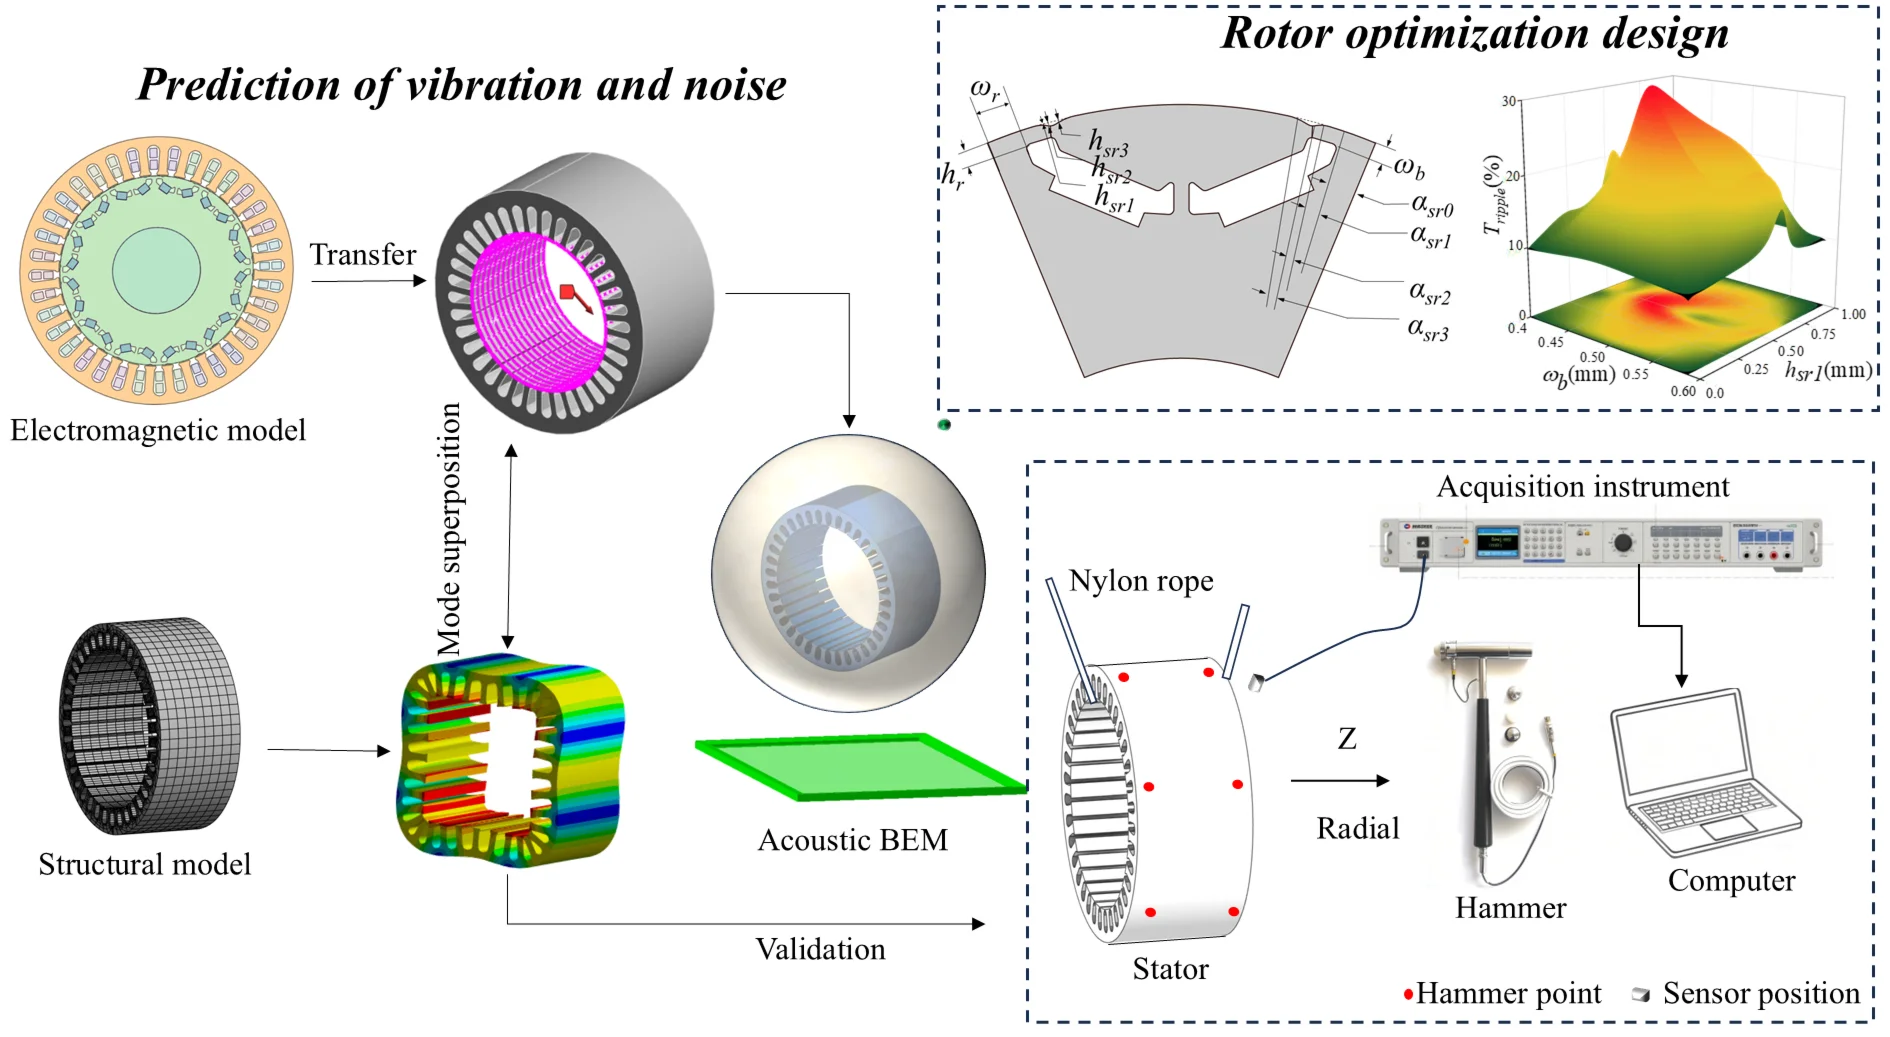
Highlights
- Orthogonal experiments integrated with non-parametric regression enable high-precision predictive modeling.
- Modal analysis yields <4.33% experiment-simulation discrepancy, with electromagnetic force-vibration noise mapping established.
- Strategy optimization reduces experimental load; non-parametric regression enhances accuracy to overcome high-dimensional modeling constraints.
1. Introduction
The IPMSM exhibits a pronounced convex pole effect, which, coupled with the increased reluctance torque, enhances both the torque output and power density of the motor, making it a preferred choice in high-performance applications [1]. In the context of new energy vehicles, motor-induced vibration and noise have become increasingly prominent, while consumer demand for enhanced vehicle comfort continues to rise. Consequently, it is essential to explore simple, efficient, and reliable strategies [2] to mitigate the vibration and noise generated by integrated permanent magnet motors [3].
The field of motor vibration and noise control has long faced challenges in addressing resonance and acoustic radiation coupling caused by insufficient structural stiffness. Traditional rib design methods relying on empirical trial-and-error approaches struggle to establish analytical correlations between rib parameters and acoustic performance. Addressing this bottleneck, Zarastvand et al. [4] proposed a groundbreaking periodic circumferential-longitudinal stiffened hyperbolic composite shell model. Their vibration-acoustic radiation coupling analytical model, based on the shear deformation shallow shell theory (SDSST), provides a universal theoretical framework for studying sound transmission characteristics in complex curved structures like cylindrical motor housings. The innovation lies in implementing genetic algorithm optimization to achieve simultaneous improvement in structural lightweighting and sound transmission loss (STL), with experimental verification showing effective suppression of electromagnetic excitation-induced high-frequency resonances (1000-4000 Hz). Further research [5] demonstrates that diffuse-field STL analysis combined with porous elastic interlayers significantly enhances high-frequency noise control through viscoelastic dissipation mechanisms, overcoming traditional metal structures' acoustic insulation limitations in high-frequency ranges.
Regarding modeling accuracy for thick-walled shells, Talebitooti et al. [6, 7] made significant progress through third-order shear deformation theory (TSDT). By employing cubic displacement field functions to modify interlaminar shear stress distribution, this approach reduces STL prediction errors by 37.4 % in high-frequency regimes (> 10 kHz), providing high-precision computational tools for analyzing vibration energy transmission paths in thick-walled components like integrated die-cast housings. For aerodynamic noise control, Zarastvand et al. [8] developed a fluid-structure coupling model that optimizes porosity and boundary stiffness parameters, achieving 12-18 dB reduction in high-speed motor aerodynamic noise (6000-10000 Hz) while maintaining thermal efficiency. This breakthrough opens new avenues for environmental adaptability design in electric vehicle drive motors.
In response to the electromagnetic force and its resulting torque pulsation which is the main cause of vibration and noise in PMSM [9]. Lin et al. [10] employed a two-dimensional finite element model to map the electromagnetic excitation onto the structural framework, utilizing the modal superposition method for vibration prediction. This approach enabled the establishment of a transfer function that links the electromagnetic force to the sound pressure. In a related study, Qian et al. [11] employed the Maxwell stress tensor method to determine the principal orders and frequencies of radial force waves in a motor operating without eccentricity and under sinusoidal current. This research further explored the characteristics of radial forces across various harmonic currents, integrating analysis with empirical current measurements. Kong et al. [12] details a study where the radial forces of the motor were computed using the finite element method (FEM). Analysis of these results employed two-dimensional fast Fourier transform (2D-FFT) techniques. The study’s findings were then rigorously validated through experimental isolation of the motor’s electromagnetic vibrations on a specialized vibration testing rig. Bailly et al. [13] investigates the design of stator slots, employing the global response surface method to optimize their geometry in pursuit of enhanced electromagnetic performance and noise reduction. This approach has proven effective in significantly mitigating the electromagnetic noise generated by motors. Sun et al. [14] rigorously assessed the impact of radial forces on motor vibrations by employing the equivalent magnetizing current method to compute localized forces. These calculations were integrated into mechanical finite element analyses. Subsequent experimental validation involving two motor types confirmed the accuracy of this analytical approach, affirming its effectiveness in characterizing vibration and noise. Lin et al. [15] demonstrated that substantial noise mitigation in permanent magnet motors can be achieved through the reduction of low spatial harmonics of radial forces. The study highlights magnet tilting as a more effective strategy than alterations in slotting width and magnet geometry, offering broad-spectrum noise reduction across a wider range of frequencies. Xu et al. [16] achieved a significant reduction in cogging torque pulsations between the stator and rotor by modifying the angle and shape of the motor rotor, notably diminishing the amplitude of the 48th order harmonics. Jun et al. [17] implemented a stepped deflection rotor design to diminish electromagnetic excitation forces, successfully mitigating vibration and noise while enhancing cost efficiency during the development phase.
In order to solve the problem that the empirical trial and error method is difficult to establish the analytical correlation between structural parameters and acoustic performance in traditional motor optimization design, a hybrid optimization strategy based on orthogonal experimental design and non-parametric regression is proposed in this paper, which breaks through the limitations of traditional response surface method in nonlinear high-dimensional data modeling. By constructing a multi-factor orthogonal experiment table, the number of experimental simulations is significantly reduced. At the same time, the complex nonlinear relationship between electromagnetic force harmonics and geometric parameters is flexibly captured by non-parametric regression algorithm, and the prediction accuracy of the response surface model is greatly improved (root mean square error is reduced by 54.7 %). On this basis, a multi-physical field coupling analysis framework is established, and the finite element model verified by modal testing is combined with the acoustic boundary element method for the first time to accurately reveal the mapping mechanism of the space-time distribution characteristics of the electromagnetic force and the acoustic radiation of the shell. The experimental results show that this method can reduce the surface vibration speed of the motor by 37.7 %, reduce the peak noise by 8.5 %, ensure the torque output is increased by 1.9 %, and successfully solve the problem of high frequency resonance caused by high order harmonics. This research provides a solution with both theoretical innovation and engineering practicability for multi-objective collaborative optimization of electric vehicle drive motors, and promotes the transformation of low noise design paradigm from experience-driven to data-driven.
2. Electromagnetic force analysis
When the core magnetic field saturation rotor eccentricity is ignored, the expression of air gap magnetic density of permanent magnet synchronous motor is as follows [18]:
where and are the air gap magnetomotive force and air gap permeability.
The air gap magnetomotive force of the rotor permanent magnet can be expressed:
where is the magnetomotive force of the permanent magnet field; is the number of harmonic components of the rotor permanent magnet field, , where 0, 1, 2, ...; is the amplitude of the V-degree permanent magnet's homogeneous harmonic magnetomotive force. is the rotor angle; is the number of motor poles; is the rotor angular speed.
The magnetomotive force of the motor stator winding can be expressed as:
where: is the magnetomotive force generated by the stator armature current; is the amplitude of harmonic magnetomotive force generated by point current. is the initial angle of the magnetomotive force. is the number of harmonic components of the stator armature magnetic field, , where 0, ±1, ±2, ...; is the harmonic number of the time current.
When considering the influence of stator slotting, the air gap permeability of permanent magnet synchronous motor can be expressed as:
where is the mean permeability of the air gap; is the harmonic permeability of order air gap teeth caused by slot, 1, 2, 3,....
Radial air gap flux density can be obtained by multiplying the air gap flux density without considering the slot with the relative permeability of the air gap. The expression is as follows:
where and are the harmonic components of the air gap density of the permanent magnet field and the u harmonic components of the armature field, respectively. and are respectively the amplitude of the air gap density of the harmonic magnetic field generated by the v-order permanent magnetic potential acting on the -order air gap tooth permeability and the amplitude of the air gap density generated by the -order armature magnetic field harmonic magnetic motive force acting on the -order air gap tooth permeability.
When calculating the magnetic force of permanent magnet synchronous electromechanical system, since the tangential air gap magnetic density is much smaller than the radial air gap magnetic density, it is assumed that the radial electromagnetic force is only proportional to the square of the radial air gap magnetic density, and the radial electromagnetic force density can be approximated as follows:
where is the radial electromagnetic force density of the motor; is the radial air gap magnetic density.
There are three main sources of radial electromagnetic force in the motor: first, the electromagnetic force harmonics caused by the air-gap magnetic density interaction generated by the rotor permanent magnet; The second is the electromagnetic force harmonics caused by the air-gap magnetic density interaction of armature winding. Finally, the electromagnetic force harmonics are generated by the interaction of the air gap magnetic density between the permanent magnet and the armature winding. Thus, the expression for the radial electromagnetic force can be written as follows:
By substituting Eq. (5) and Eq. (7) into Eq. (8), the order and frequency of the radial electromagnetic force can be obtained.
In this paper, a 12-pole 36-slot permanent magnet synchronous motor is used as a prototype for finite element analysis, and its main structural parameters and main performance parameters are summarized in Table 1.
Based on theoretical analysis and motor pole groove matching parameters, the main order of the motor harmonic magnetic field in Table 2 is calculated.
Table 1The main performance indicators of the motor
Parameter | Value(units) |
Number of slots/poles | 36/12 |
Rated speed | 3000 r/min |
Rated torque | 90.5 Nm |
Rated power | 30/kW |
Permanent magnet internal setting mode | Type V |
Maximum speed of revolution | 7000 r/min |
Table 2Major order of radial electromagnetic wave
Harmonic frequency of rotor permanent magnet field | |||||||
1 | 3 | 5 | 7 | 9 | 11 | ||
Armature reaction field harmonic degree | 1 | (0/6) | (6/2) | (12/4) | (18/6) | (24/8) | (30/10) |
(6/2) | (12/4) | (16/6) | (18/8) | (24/10) | (30/12) | ||
–5 | (24/0) | (30/2) | (36/4) | (40/6) | (44/8) | (48/10) | |
(12/2) | (6/4) | (0/6) | (6/8) | (12/10) | (18/12) | ||
7 | (18/0) | (12/2) | (6/4) | (0/6) | (6/8) | (12/10) | |
(24/2) | (30/4) | 36/6) | (42/8) | (48/10) | (52/12) | ||
–11 | (52/0) | (58/2) | (60/4) | (66/6) | (72/8) | (78/10) | |
(48/2) | (42/4) | (36/6) | (30/8) | (24/10) | (18/12) | ||
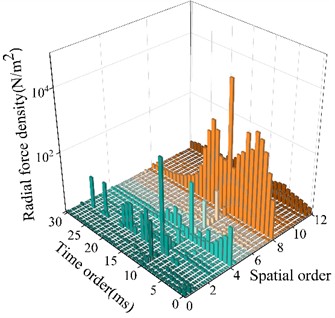
The finite element simulation software is used to solve the distribution of the electromagnetic force in the air gap of the motor and perform Fourier decomposition. The space-time distribution of the electromagnetic force is obtained, as shown in Fig. 1. In Fig. 1, it is observed that the amplitude of electromagnetic force harmonics is large mainly at (0, 0), (6, 2), (12, 4), (18, 6), (24, 8), (30, 2), (32, 10), which is consistent with the main harmonic order in Table 2.
Fig. 1Characteristics of radial electromagnetic force density spatial-temporal distribution
3. Modal analysis
The modal finite element simulation of the stator core is carried out by means of free mode calculation without any constraint and external excitation. The analysis only focuses on the radial modes related to the radial electromagnetic force, ignoring the rotational modes and axial modes, and obtains the modulus, frequency and mode diagram of each order.
Modal testing is conducted on a 36-slot stator, with the experimental setup configuration detailed in Table 3. Fig. 2 and Fig. 3 illustrate the standardized operational workflow and system architecture diagram of the modal testing, respectively. A dedicated stator modal testing platform is constructed, as shown in Fig. 4. During data acquisition, dynamic signal acquisition protocols are strictly adhered to, ensuring that the coherence coefficients at all measurement points exceeded 0.8 (see Fig. 5). To validate the accuracy of the analytical and numerical models, a comparative study is performed between experimental modal analysis (EMA) and finite element (FE) simulations, focusing on the stator’s radial modal characteristics. The validity of the stator radial modal model and the FE model is comparatively verified, with specific quantitative results summarized in the model validation comparison table (Table 4).
As shown in Table 4, the first seven natural vibration characteristics of the structure are obtained through modal analysis. The modes of each order and their corresponding natural frequencies are: zero-order rigid body mode (5953 Hz), second-order elliptical mode (6550 Hz), third-order triangular mode (1578 Hz), fourth-order quadrilateral mode (315 Hz), fifth-order pentagonal mode (4263 Hz) and sixth-order hexagonal mode (5785 Hz). It is worth noting that the fourth order quadrilateral mode presents the lowest natural frequency (315 Hz), which may be due to the high flexibility characteristic of the structural weak region corresponding to the fourth order mode.
Table 3Experimental equipment parameter table
Device name | Model | Key parameter |
Acceleration sensor | PCB 356A16 | Sensitivity: 100 mV/g, Range: ±50 g |
Hammer | Dytran 5800B | Range: 0-5000 N, Sensitivity: 0.23 mV/N |
Data acquisition system | NI PXIe-4499 | Sampling frequency: 204.8 kHz, 24-bit resolution |
Modal analysis software | LMS Test.Lab | Frequency response function estimation method: / |
Vibration measurement with laser | Polytec PSV-500 | Non-contact measurement, frequency range: 0-25 kHz |
Fig. 2Modal experiment flow
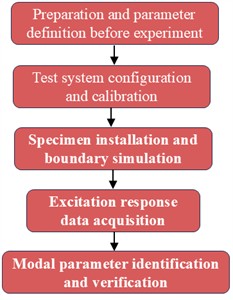
Fig. 3Modal test setup
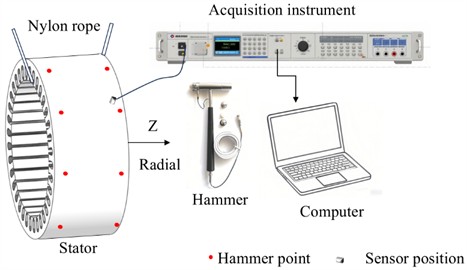
Fig. 4Modal experiment of stator
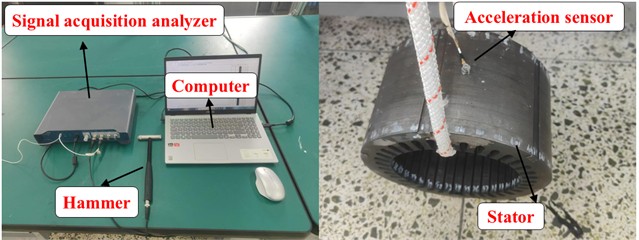
Table 4Comparison of modal shapes and frequencies from simulation and test
Mode order | Tested mode shape and frequency | Calculated mode shape and frequency | Relative error |
0 |  5879 Hz | 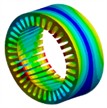 5953 Hz | 1.26 % |
2 |  643 Hz |  650 Hz | 1.08 % |
3 | 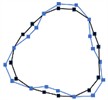 1603 Hz |  1578 Hz | 1.58 % |
4 |  3298 Hz | 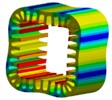 3155 Hz | 4.33 % |
5 | 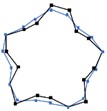 4348 Hz | 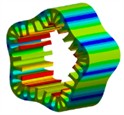 4263 Hz | 1.95 % |
6 | 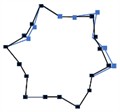 5943 Hz | 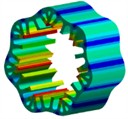 5785 Hz | 3.11 % |
The modal analysis of the stator system shows that interference assembly is used between the stator and the casing. The connection mode of each component is set as bonded, that is, the contact area is set as bonded and no relative sliding or separation between wires or surfaces is allowed. The main modal shapes and frequencies of the stator system are shown in Table 4.
Fig. 5Transfer function
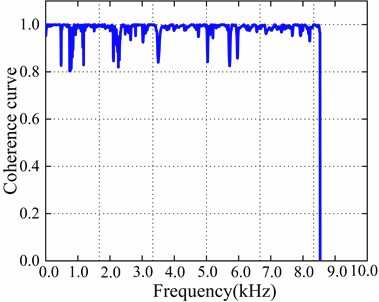
Fig. 6Main modal shapes and corresponding frequencies of the stator with housing
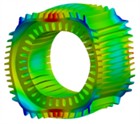
a) 0 order (5879 Hz)
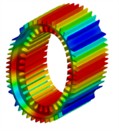
b) 2 order (758 Hz)
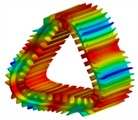
c) 3 order (2456 Hz)
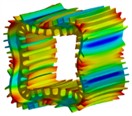
d) 4 order (4659 Hz)
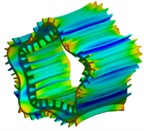
e) 5 order (5789 Hz)
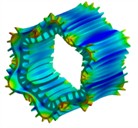
f) 6 order (6725 Hz)
Through the modal analysis of the stator and stator system, it can be found that the modal frequency of the motor increases with the increase of the modal order. Compared with the modal frequency of the stator, the free modal frequency of the stator system of the same order is higher, and the deformation amplitude decreases. This is mainly due to the fact that the casing increases the mass and stiffness of the motor structure, which has a greater suppression effect on the free modes, and the modal frequencies are staggered with the same-order electromagnetic force frequencies to avoid resonance.
4. Vibration and noise analysis
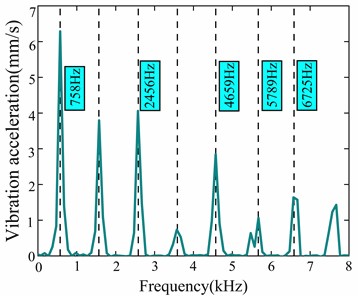
Harmonic Response Analysis (HRA), as a typical dynamic response analysis method, is widely used to study the dynamic characteristics of systems under periodic excitation [19,20]. In this paper, the vibration response characteristics of the motor surface are analyzed by coupling the electromagnetic excitation load to the stator tooth surface of the motor. The numerical simulation results show that the peak frequency of the vibration acceleration spectrum revealed in Fig. 8 is significantly close to the modal natural frequency represented in Fig. 3, and the coupling characteristics in the frequency domain will cause significant resonance amplification effect. In addition, a complete motor noise prediction system has been established in this study, and its technical route is shown in Fig. 7, which provides a methodological basis for quantitative evaluation of motor vibration noise.
Fig. 7Flow chart of motor vibration and noise prediction
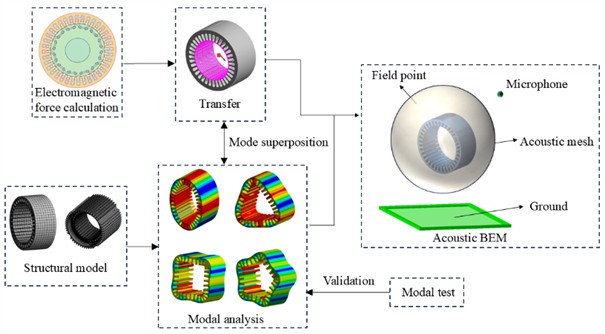
Fig. 8Introduction of electromagnetic joint force
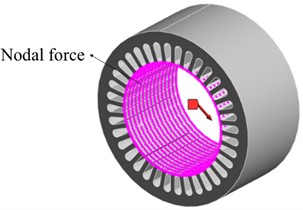
Fig. 9Radial vibration velocity spectrum diagram
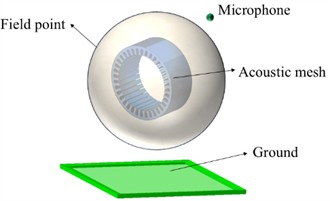
In motor noise analysis, a spherical or hemispherical air packet is usually used as the solution domain. The calculated electromagnetic vibration data are accurately loaded onto the inner surface of the air domain in contact with the motor. At the same time, the power absorption boundary is set on the inner surface of the air packet to simulate the real noise transfer situation, and the surface noise curve of the enclosure is shown in Fig. 10.
Fig. 10Acoustic boundary element model
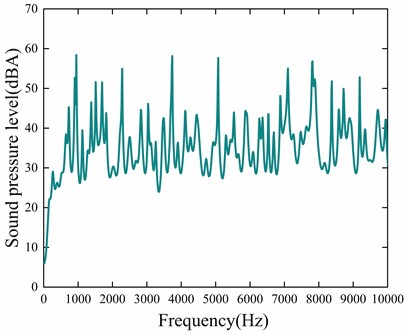
As can be seen in Fig. 11, the peaks of electromagnetic noise mainly occur at even multiples of the electromechanical frequency. Especially at 5000 Hz, the noise spike reaches 58.8 dB(A), which further verifies that the motor vibration driven by electromagnetic force is the main source of noise, and the frequency of electromagnetic force determines the frequency of noise. Therefore, the noise suppression can be achieved by optimizing the harmonic characteristics of the electromagnetic force.
Fig. 11Electromagnetic noise spectrum of the motor at rated speed
5. Response surface optimization based on orthogonal tables
Response surface optimization is a statistical technique used to optimize multi-factor experiments, the main objective of which is to improve the performance of a system by fitting an approximate mathematical model through the design of experiments to find an optimal solution.
5.1. Experimental design
Common experimental design methods include: full factorial design, central composite design (CCD) and Box-Behnken design (BBD) [21], [22].
Orthogonal table is a statistical tool used to reduce the number of tests in the experimental design, orthogonal table test needs to ensure that each factor in each test factor level occurs the same number of times, its orthogonality is reflected in the analysis of a single factor, the influence of the other factors is uniformly distributed, and the change of any one factor will not affect the other factors, so that the results have independence and reliability. The optimization scheme uses orthogonal table instead of traditional CCD design to simplify the process of response surface construction, and the structural parameters are shown in Fig. 6.
Fig. 12Electromagnetic model of V-rotor and design variables of the rotor
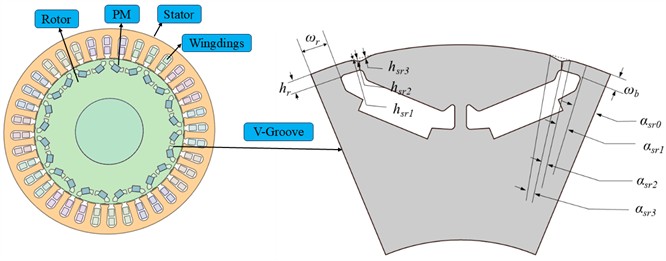
Minitab software was used to establish the orthogonal table of three factors and four levels, as shown in Table 3, and then finite element simulation was carried out for 16 combinations, and the torque, torque pulsation and electromagnetic force density are obtained as shown in Table 5.
Table 5Parameters and ranges to be optimized
Parameter | Description | Range (unit) |
Width of rid | 0.4-0.6 (mm) | |
Width of bridge | 0.4-0.6 (mm) | |
Height of rib | 1.2-1.6 (mm) | |
Heights of control points for spline curve fitting | 0-1.0 (mm) | |
0-1.5 (mm) | ||
0-1.5 (mm) | ||
Angles of control points for spline curve fitting | 5-15 (°) | |
0-10 (°) | ||
0-10 (°) | ||
0-10 (°) |
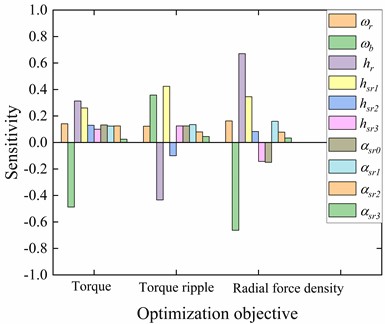
Fig. 13Sensitivity analysis of design variables
5.2. Response surface design
This paper adopts the response surface optimization module in ANSYS Workbench, and takes orthogonal table data as input parameters. Response surface types include: full second-order polynomial, Kriging, non-parametric regression, neural network and sparse matrix.
The full second-order polynomials are able to capture the nonlinear relationship between the input variables [23], [24] and their squared terms allow the curves to take a concave-convex shape, while the interaction terms reflect the interactions between different variables. In addition, second-order polynomials are able to exhibit local extremes (maximum or minimum values), which helps in the identification of optimization points and the characterization of peaks and valleys of the system. Nonparametric regression is a regression method that does not rely on a specific functional form [15], and constructs the model by locally fitting the data points. Although nonparametric regression has a high computational complexity and the model is not easy to be interpreted in high-dimensional data processing, it is able to flexibly adapt to the actual distributional characteristics of the data to provide a more accurate prediction.
The data in Table 4 are used to generate response surface models using second-order polynomial and nonparametric regression algorithms, and the response surface quality was examined by the goodness-of-fit, and the results are shown in Table 6. The results are shown in Table 5. From Table 5, it can be seen that the root-mean-square errors of the full second-order polynomials in the radial electromagnetic force density and torque pulsation are 0.289 N/m2 and 0.256 %, which are larger than those of the nonparametric regression algorithm, and the relative maximum absolute errors of the radial electromagnetic force density and torque pulsation are 22.03 N/m2 and 22.821 %, which are far better than that of the nonparametric regression algorithm, and thus the response surfaces are fitted with the nonparametric regression algorithm this time [25], [26]. Therefore, the non-parametric regression algorithm is used to fit the response surface.
Table 6The goodness of fit test of regression algorithm for all second-order polynomials and non-parameters
Fully second-order polynomial | Nonparametric regression | |||||
(N/m2) | (Nm) | (N/m2) | (Nm) | |||
Determination coefficient | 0.993 | 0.998 | 0.986 | 0.999 | 0.998 | 0.999 |
Root-mean-square error | 0.289 | 0.047 | 0.256 % | 0.131 | 0.087 | 0.075 % |
Relative maximum error | 21.03 | 3.668 | 22.374 % | 3.879 | 3.562 | 2.598 % |
5.3. Parameter interaction
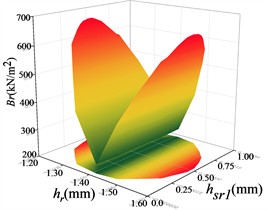
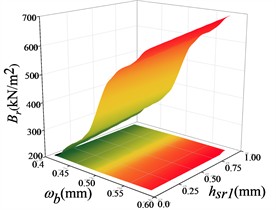
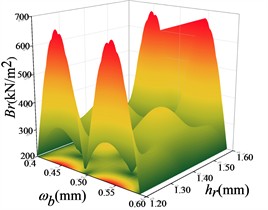
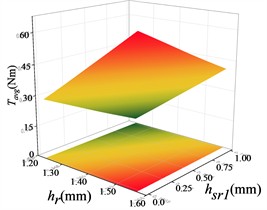
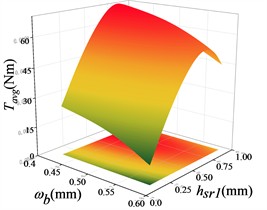
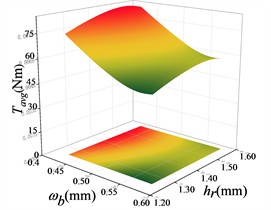
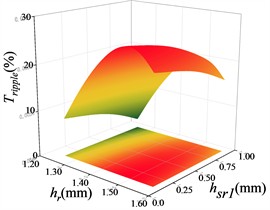
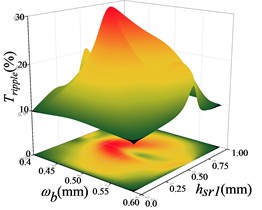
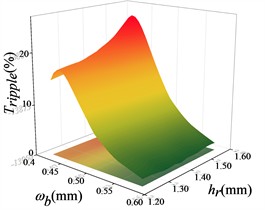
The analysis of the interaction between various factors is a key step in response surface optimization, and it is crucial to understand the influence of each factor on the response value and the interaction between each factor. It can be seen from the longitudinal sensitivity analysis in Fig. 13 that , and have high sensitivity, so they have great influence on each optimization objective. In the following paper, these three structural parameters are mainly analyzed when the response surface model is established.
Fig. 14Response surface modelling of the radial electromagnetic force Br with hr, hsr1 and ωb
a)
b)
c)
Fig. 15Response surface modelling of the average torque Tavg with hr, hsr1 and ωb
a)
b)
c)
Fig. 16Response surface modelling of the torque ripple Tripple with hr, hsr1 and ωb
a)
b)
c)
The response surface optimization module in ANSYS Workbench software is used to solve the optimization, and the solution ranges of , and are set to be 0.4-0.6 mm, 1.2-1.6 mm and 0-1.0 mm. The constraints are set to be the minimum of the radial electromagnetic force, the maximum of the torque and the minimum of the torque pulsation, and the weights of the radial electromagnetic force parameters are set to be the heaviest, and the remaining two parameters are set as defaults. Set the constraints as minimum radial electromagnetic force, maximum torque, minimum torque pulsation, and set the weight of radial electromagnetic force parameter as the most important, and the remaining two as the default to obtain the optimized points: is 0.4375 mm, is 1.3750 mm, and is 0.8473 mm. Substitute the optimized points of the response surface back to Maxwell to re-simulate, and get the optimized performance of the motor and the predicted values of the model, which is summarized in Table 7, and the errors are kept under 0.7 %, proving that the non-parametric regression response surface optimized points are the most suitable for the motor and the model predicted values, which is the best solution for the optimized points of the response surface. This proves that the nonparametric regression response surface is well fitted.
Table 7Predicted and observed values after response surface optimization
(N/m2) | (Nm) | ||
Predicted value | 65290 | 45.756 | 18.453 |
Observed value | 64582 | 44.783 | 18.258 |
Error (%) | 1.08 % | 2.12 % | 1.05 % |
5.4. Motor performance comparison
Table 8 shows the comparison of motor performance parameters before and after optimization. The results show that the radial electromagnetic force density is reduced by 9.9 %, and the torque is increased by 1.9 %, which realizes the motor performance is improved while the electromagnetic force density is reduced.
Table 8Comparison of electromagnetic motor performance before and after optimization
(N/m2) | (Nm) | ||
Original design | 700543 | 40.546 | 23.256 % |
Optimized design | 676450 | 48.750 | 18.770 % |
Fig. 17Comparison of motor vibration speed before and after optimization
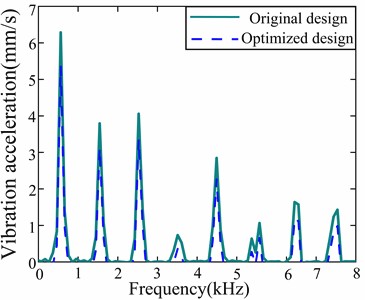
Fig. 18Comparison of motor noise at 7000 r/ min before and after optimization
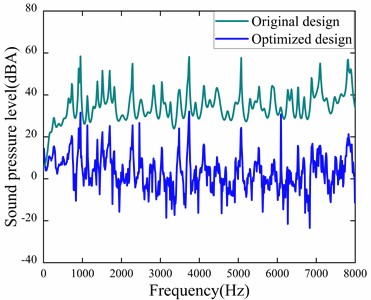
The optimal parameter set from the response surface optimization was then re-simulated using Maxwell and Workbench. As shown in Fig. 17 and Fig. 18, the vibration velocity was reduced from 6.4 mm/s to 5.2 mm/s. In addition, the motor noise levels at critical frequencies (758 Hz, 2456 Hz, 4659 Hz, 5789 Hz, and 6725 Hz) were reduced to 26.2 dB(A), 28.5 dB(A), 29.48 dB(A), 18.4 dB(A), and 13.4 dB(A), respectively. 13.4 dB(A), both vibration and noise on the casing surface were effectively suppressed, proving the success of the optimization method. The success of the optimization method.
6. Conclusions
This study presents a systematic investigation into the vibration and noise reduction of a 12-pole, 36-slot IPMSM through integrated electromagnetic force analysis, modal testing, and response surface optimization. By employing theoretical modeling, finite element simulations, and experimental modal analysis, the radial electromagnetic force harmonics and structural modal characteristics were rigorously characterized. The electromagnetic force spatial-temporal distribution revealed dominant harmonic orders (e.g., 6th, 12th, and 18th) consistent with theoretical predictions, while modal testing validated the finite element model’s accuracy, with frequency errors below 4.33 % across key radial modes (0th-6th orders). A novel optimization framework combining orthogonal experimental design with nonparametric regression techniques was developed to construct high-fidelity response surface models, enabling precise tuning of rotor geometric parameters (e.g., rib width, bridge height). The optimized design achieved a 9.9 % reduction in radial electromagnetic force density, a 1.9 % increase in average torque, and an 18.8 % decrease in torque ripple. Experimental validation demonstrated significant improvements in vibration and noise performance, with surface vibration velocity reduced by 37.7 % and peak noise levels attenuated by 8.5 %, effectively suppressing resonance-induced acoustic radiation. These results underscore the efficacy of the proposed methodology in decoupling electromagnetic-structural-acoustic interactions and mitigating high-frequency noise sources. The study advances IPMSM design paradigms by providing a data-driven, multidisciplinary optimization strategy, offering practical insights for enhancing the efficiency and acoustic comfort of electric vehicle powertrains. Future work should explore dynamic operating conditions and manufacturing tolerances to further refine robustness in real-world applications
References
-
K. Qian, J. Wang, Y. Gao, Q. Sun, and J. Liang, “Interior noise and vibration prediction of permanent magnet synchronous motor,” Journal of Vibroengineering, Vol. 20, No. 5, pp. 2225–2236, Aug. 2018, https://doi.org/10.21595/jve.2018.18605
-
S. Čorović and D. Miljavec, “Modal analysis and rotor-dynamics of an interior permanent magnet synchronous motor: an experimental and theoretical study,” Applied Sciences, Vol. 10, No. 17, p. 5881, Aug. 2020, https://doi.org/10.3390/app10175881
-
Z. Xing, X. Wang, W. Zhao, X. Li, L. Xiong, and X. Zhang, “Optimization design of interior permanent magnet synchronous motor with U-shaped rotor for low-level torque ripple and electromagnetic vibration,” IEEE Transactions on Transportation Electrification, Vol. 10, No. 1, pp. 1995–2007, Mar. 2024, https://doi.org/10.1109/tte.2023.3288892
-
M. R. Zarastvand, M. H. Asadijafari, and R. Talebitooti, “Acoustic wave transmission characteristics of stiffened composite shell systems with double curvature,” Composite Structures, Vol. 292, p. 115688, Jul. 2022, https://doi.org/10.1016/j.compstruct.2022.115688
-
R. Talebitooti, M. Zarastvand, and H. Darvishgohari, “Multi-objective optimization approach on diffuse sound transmission through poroelastic composite sandwich structure,” Journal of Sandwich Structures and Materials, Vol. 23, No. 4, pp. 1221–1252, Jun. 2019, https://doi.org/10.1177/1099636219854748
-
R. Talebitooti and M. R. Zarastvand, “The effect of nature of porous material on diffuse field acoustic transmission of the sandwich aerospace composite doubly curved shell,” Aerospace Science and Technology, Vol. 78, pp. 157–170, Jul. 2018, https://doi.org/10.1016/j.ast.2018.03.010
-
R. Talebitooti and M. R. Zarastvand, “Vibroacoustic behavior of orthotropic aerospace composite structure in the subsonic flow considering the Third order Shear Deformation Theory,” Aerospace Science and Technology, Vol. 75, pp. 227–236, Apr. 2018, https://doi.org/10.1016/j.ast.2018.01.011
-
M. Zarastvand, M. Ghassabi, and R. Talebitooti, “Prediction of acoustic wave transmission features of the multilayered plate constructions: A review,” Journal of Sandwich Structures and Materials, Vol. 24, No. 1, pp. 218–293, Feb. 2021, https://doi.org/10.1177/1099636221993891
-
N. Remus et al., “Electromagnetic noise and vibration in PMSM and their sources: an overview,” in 2020 IEEE Canadian Conference on Electrical and Computer Engineering (CCECE), pp. 1–4, Aug. 2020, https://doi.org/10.1109/ccece47787.2020.9255787
-
F. Lin, S. Zuo, W. Deng, and S. Wu, “Noise prediction and sound quality analysis of variable-speed permanent magnet synchronous motor,” IEEE Transactions on Energy Conversion, Vol. 32, No. 2, pp. 698–706, Jun. 2017, https://doi.org/10.1109/tec.2017.2651034
-
Z. Qian, L. Qi, G. Li, W. Deng, Z. Sun, and Q. Chen, “Analysis of vibration and noise in electric drive system under resolver and motor rotor coupling eccentricity,” IEEE Transactions on Transportation Electrification, Vol. 10, No. 1, pp. 1827–1836, Mar. 2024, https://doi.org/10.1109/tte.2023.3282045
-
D. Kong, Z. Shuai, W. Li, and D. Wang, “Electromagnetic vibration characteristics analysis of a squirrel-cage induction motor under different loading conditions,” IEEE Access, Vol. 7, pp. 173240–173248, Jan. 2019, https://doi.org/10.1109/access.2019.2956950
-
C. Bailly, G. Guilly, D. Mavrudieva, and P. Lombard, “Multi-physics noise optimization in fuel pump PM motor,” International Journal of Applied Electromagnetics and Mechanics, Vol. 59, No. 3, pp. 873–880, Mar. 2019, https://doi.org/10.3233/jae-171115
-
Tao Sun, Yong-Ho Kim, Wan-Jin Cho, Liang Fang, and Jung-Pyo Hong, “Effect of pole and slot combination on noise and vibration in permanent magnet synchronous motor,” 14th Biennial IEEE Conference on Electromagnetic Field Computation (CEFC 2010), Vol. 47, No. 5, pp. 1–1, May 2010, https://doi.org/10.1109/cefc.2010.5481875
-
F. Lin, S.-G. Zuo, W.-Z. Deng, and S.-L. Wu, “Reduction of vibration and acoustic noise in permanent magnet synchronous motor by optimizing magnetic forces,” Journal of Sound and Vibration, Vol. 429, pp. 193–205, Sep. 2018, https://doi.org/10.1016/j.jsv.2018.05.018
-
J. Xu, L. Zhang, D. Meng, and H. Su, “Simulation, verification and optimization design of electromagnetic vibration and noise of permanent magnet synchronous motor for vehicle,” Energies, Vol. 15, No. 16, p. 5808, Aug. 2022, https://doi.org/10.3390/en15165808
-
J.-W. Jung, D.-J. Kim, J.-P. Hong, G.-H. Lee, and S.-M. Jeon, “Experimental verification and effects of step skewed rotor type IPMSM on vibration and noise,” IEEE Transactions on Magnetics, Vol. 47, No. 10, pp. 3661–3664, Oct. 2011, https://doi.org/10.1109/tmag.2011.2150739
-
S. Zuo, F. Lin, and X. Wu, “Noise analysis, calculation, and reduction of external rotor permanent-magnet synchronous motor,” IEEE Transactions on Industrial Electronics, Vol. 62, No. 10, pp. 6204–6212, Oct. 2015, https://doi.org/10.1109/tie.2015.2426135
-
W. Tangsopa and J. Thongsri, “Development of an industrial ultrasonic cleaning tank based on harmonic response analysis,” Ultrasonics, Vol. 91, pp. 68–76, Jan. 2019, https://doi.org/10.1016/j.ultras.2018.07.013
-
K. Srathonghuam, B. Wonganu, W. Busayaporn, and J. Thongsri, “Vibration analysis and development of a submersible ultrasonic transducer for an application in the inhibitory activity of pathogenic bacteria,” IEEE Access, Vol. 9, pp. 142362–142373, Jan. 2021, https://doi.org/10.1109/access.2021.3120136
-
T. Rakić, I. Kasagić-Vujanović, M. Jovanović, B. Jančić-Stojanović, and D. Ivanović, “Comparison of full factorial design, central composite design, and Box-Behnken design in chromatographic method development for the determination of fluconazole and its impurities,” Analytical Letters, Vol. 47, No. 8, pp. 1334–1347, May 2014, https://doi.org/10.1080/00032719.2013.867503
-
N. Szpisják-Gulyás, A. N. Al-Tayawi, Z. H. Horváth, Z. László, S. Kertész, and C. Hodúr, “Methods for experimental design, central composite design and the Box-Behnken design, to optimise operational parameters: A review,” Acta Alimentaria, Vol. 52, No. 4, pp. 521–537, Dec. 2023, https://doi.org/10.1556/066.2023.00235
-
R. Erdahl, “A cone of inhomogeneous second-order polynomials,” Discrete and Computational Geometry, Vol. 8, No. 4, pp. 387–416, Dec. 1992, https://doi.org/10.1007/bf02293055
-
Y. J. Kim, K. H. Kwon, and J. K. Lee, “Orthogonal polynomials in two variables and second-order partial differential equations,” Journal of Computational and Applied Mathematics, Vol. 82, No. 1-2, pp. 239–260, Sep. 1997, https://doi.org/10.1016/s0377-0427(97)00082-4
-
Y. Song, C. Cai, D. Ma, and C. Li, “Modelling and forecasting high-frequency data with jumps based on a hybrid nonparametric regression and LSTM model,” Expert Systems with Applications, Vol. 237, p. 121527, Mar. 2024, https://doi.org/10.1016/j.eswa.2023.121527
-
Y. Yang and D. Zhou, “Nonparametric regression using over-parameterized shallow ReLU neural networks,” Journal of Machine Learning Research, Vol. 25, pp. 1–35, 2024.
Cited by
About this article
All authors would like to thank the National Natural Science Foundation of China for financial support under Grant 52405136, partly supported by the Zhejiang Provincial Natural Science Foundation of China under Grant LQ23E050018.
The datasets generated during and/or analyzed during the current study are available from the corresponding author on reasonable request.
Dawei Gu: conceptualization, investigation, methodology, writing-original draft, writing-review and editing, validation, funding acquisition. Dashuai Shi: conceptualization, supervision, project administration, formal analysis, data curation. Zhengqing Liu: supervision, project administration. Zhuo Xu: conceptualization, funding acquisition, supervision. Baisong Pan: conceptualization, project administration. Tie Geng: supervision, project administration. Bangchun Wen: conceptualization, supervision.
The authors declare that they have no conflict of interest.
