Abstract
Paralysis is defined as the complete loss of mobility and inability to perform movement in a specific area of body. In facial paralysis, muscles exhibit lost of mobility or muscular hypotonia, which may be accompanied by decreased salivar flow and impairment of the perioral jugal muscles. The objective of this study was to diagnose oral health status of patients using Decayed, Missing and filled teeth index, and to evaluate whether there is an association between the side of facial paralysis and a higher rate of plaque dental. We compared the paralysis side with the healthy side. Patients from the Facial Nerve Sector of the Otology and Otoneurology Disciplines at the Federal University of São Paulo were screened. Based on the inclusion and exclusion criteria, 15 patients were analyzed. Dental plaque was evaluated using the O’Leary index, and overall oral health was assessed via the DMFT index. The majority of the sample was female (53.3 %), with a traumatic etiology (60.0 %), right-sided facial paralysis (53.3 %), and grade V severity (53.3 %). The mean age was 37 years. The average O'Leary index score was 16.1 %, ranging from 0 % (lowest) to 28.6 % (highest). When analyzing the sides separately, the right side showed a slightly higher average plaque accumulation (16.8 %) compared to the left side (15.2 %). The mean DMFT index value was 13.6. The correlation between the side with greater plaque accumulation and the side of facial paralysis resulted in a poor Kappa concordance coefficient of 0.071. The association test between the side with a higher O'Leary index and the side of facial paralysis was not statistically significant ( 0.999), indicating that these two variables are not associated.In conclusion, dental plaque accumulation is independent of the side of facial paralysis presented by the patient.
Highlights
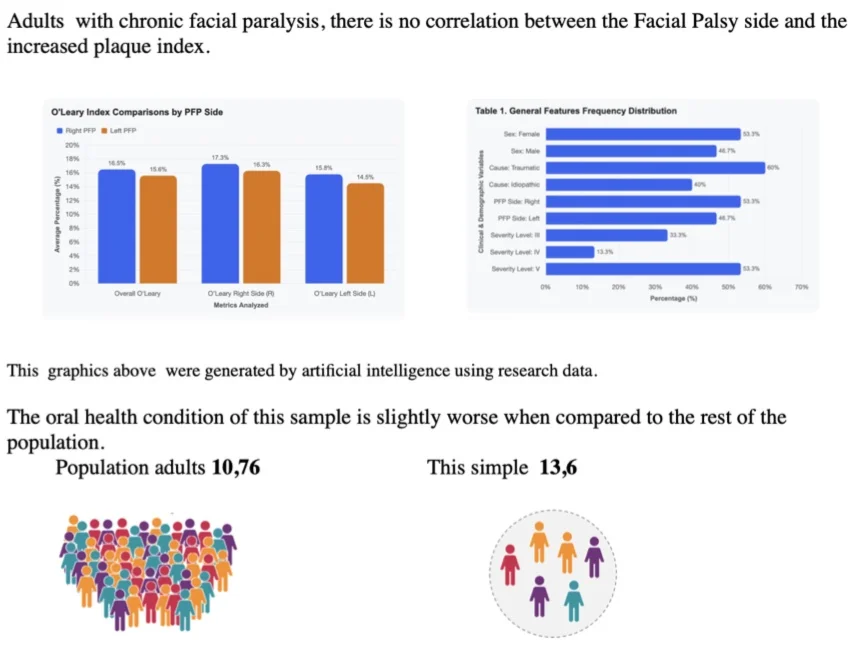
- Dental caries is a multifactorial disease, and paralysis did not contribute to an increase in the caries index on the paralyzed side
- The oral health index in the sample proved to be worse than that of the rest of the population.
1. Introduction
Knowing a disease and how far it reaches, its sequelae, makes a seemingly basic treatment in a treatment of excellence, preventing associated factors.
Paralysis is the complete abolition of mobility, the ability to make a movement in a given territory of the body [1]. In clinical terms, there are two types of facial paralysis, the central paralysis and the peripheral paralysis, both require specialized treatment.
Central Facial Paralysis is a medical emergency, may result from a stroke, may involve the lower third of the hemiface and the arms and legs on the opposite side.
Peripheral FP (PFP) results from the interruption of the nerve influx of any of the facial nerve segments, the entire hemiface is involved. Approximately 50 % of the population impacted by PFP, the etiology is unknown, being diagnosed as idiopathic or Bell’s and the second cause is traumatic FP.
In the literature, treatment, depending on the etiology, is with the use of drugs, surgical maneuver of nerve decompression, grafts [2], anastomoses, physiotherapy, speech therapy [3], botulinum toxin on the healthy side [4].
In the treatment of PFP, factors such as the time elapsed before the initial consultation, sex, electrical excitability, physical examination findings, and the course of recovery are crucial for determining the prognosis [5].
Current studies indicate that patients with congenital or childhood-acquired facial paralysis exhibit marked differences in the development of the facial framework [6], but the incidence of caries in these patients has not yet been studied.
Many studies have shown the importance of saliva in the protection of oral tissues. The protective function of saliva is not limited to lubrication of tissues and the removal of microorganisms. It is also observed that the variations of the flow and the chemical composition of it can considerably alter the state of oral health [7].
The part that saliva plays in protecting teeth from caries can be summarised under four aspects: diluting and eliminating sugars and other substances, buffer capacity, balancing demineralisation/remineralisation and antimicrobial action, volume and flow are important factors for oral health [8].
Bacterial plaque disclosure brings knowledge about the area where the patient is not doing appropriate oral hygiene.
Dental plaque, also called plaque, is a biofilm, generally of light yellow to white colour, that forms on teeth. If plaque is not removed regularly, it can lead to cavities or periodontal problems such as gingivitis, periodontal disease and dental loss.
The microorganisms that form dental plaque are almost all, bacteria with the composition varying according to the location in the mouth, are naturally present and are usually harmless. However, by forming plaque, these microorganisms can cause demineralization of the surface of teeth and cavities.
Saliva is not able to penetrate the plaque and thus cannot act to neutralize the acids produced by bacteria and remineralize the surface of the teeth. Dental plaque can also mineralize and form tartar. The frequency and correct toothbrushing technique is important for plaque removal.
According to Level and Clark, the disclosure of plaque acts in the first level of disease prevention, diagnosing the need or not of targeted intervention and oral hygiene education maneuvers. For the evaluation we used the Oleary index.
Disclosing bacterial plaque makes it possible to identify areas where the patient is not maintaining adequate oral hygiene. Bacterial plaque – also simply called plaque – is a biofilm (usually ranging in color from pale yellow to white) that forms on the teeth. If not removed regularly, plaque can lead to the development of caries or periodontal problems, such as gingivitis, periodontal disease, and tooth loss.One way to assess a population's dental health is by counting decayed, missing, and filled teeth – known as the DMFT index.
The microorganisms that make up bacterial plaque are almost entirely bacteria – with a composition that varies depending on their location in the mouth – which are naturally present and generally harmless. However, when they form plaque, these microorganisms can cause demineralization of the tooth surface and the development of caries.
1.1. The Oleary index
To obtain the index, it is applied to the teeth, fuchsin-based dye and we mark the stained dental surfaces. Dental surfaces are divided into four.
For the study, O’Leary index scores were calculated for the right side, the left side, and the whole mouth. This index is determined by using a chart to mark and count the tooth surfaces stained by the plaque-disclosing agent (Fig. 1). The count of stained surfaces is applied to the formula below (Eq. (1)):
The index classifies the patient's oral health – acceptable, questionable, or insufficient (indicating poor oral health) – based on the following scores:Acceptable score – 0-12 %, questionable – 13-23 %, insufficient – 24-100 %.
Eq. (1) formula of the O’Leary index: 64×100/128 = 50 %.
Fig. 1To mark and count the tooth surfaces stained by the plaque

1.2. Decayed, missing, and filled teeth index (DMFT)
Formulated by Klein and Palmer in 1937, it is used by the World Health Organization (WHO) so far to evaluate the prevalence of dental caries in several countries.
The abbreviation DMFT comes from the words “decayed”, “missed” and “filled”, and indicates that the unit of measure is the tooth. DMFT index = Total number of decayed permanent dents, missing filled investigated in the sampling/Number of patients examined.
In facial paralysis occurs a decrease in salivary flow, in patients without pathology this fact may reflect in the oral environment because self-cleaning is compromised. The flaccidity of facial mimicry muscles can also affect oral hygiene care, resulting in increased dental plaque and consequently the number of cavities and periodontal lesions.
Regarding this, there are no studies in the literature, specifically about this group of patients.
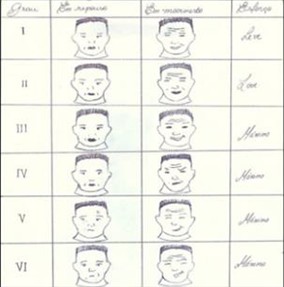
The degree of impairment of the face affected by PFP is evaluated according to the House and Brackmann scale (Fig. 2).
Fig. 2House and Brackmann scale
There is no consensus about the predisposition of these patients to the development of dental caries, what is known is that the presence of plaque without control can lead to it.
What is known and has been proven is that the higher the number of effective dental contacts, the less uncomfortable it is for the patient to chew [7].
1.3. Objective
To diagnose the oral health conditions of patients through the DMFT index, and to verify if there is an association between the side of facial paralysis and the corresponding high rate of bacterial plaque.
2. Methodology
Examine the Plaque Index on the right side, left and whole mouth and the DMFT index of a group of patients with chronic peripheral facial paralysis from the Otorhinolaryngology Discipline of Unifesp – EPM, with the following criteria.
Inclusion criteria: Adult patient (18-70 years), with chronic unilateral peripheral facial paralysis (over six months of evolution), dentate, with partial fixed and removable prostheses, and/or dental implants.
Exclusion criteria: Patients who already had other pathologies in the maxilla and mandible region before facial paralysis was installed, edentulous, using total prosthesis.
Performing analysis of panoramic radiography and disclosure of bacterial plaque by Oleary plaque index.
Material used:
– Previous medical history
– Panoramic teleradiography in standard position.
– Mirror flat tweezer explorer.
– Basic 2 % fuchsin tablet for plaque disclosure.
– The protocol will be dental evaluation through the Oleary index.
Initially, a descriptive analysis of the variables was performed, in which the absolute frequency () and relative (%) distributions are presented for the qualitative variables and the main summary measures such as mean, standard deviation, median, minimum and maximum values for the quantitative variables.
To evaluate the association between qualitative variables, the chi-square test or the Fisher’s exact test was used, when appropriate, while to compare the distribution of quantitative variables, the Mann-Whitney non-parametric test or the Kruskal-Wallis test was used. The first is used when we have the comparison of two groups and the second when we have three or more.
To evaluate the agreement between the side of facial paralysis and the side with more Oleary, the Kappa coefficient was calculated.
The level of significance adopted was 5 % in all tests of the study, and statistical analysis were performed using IBM SPSS version 25.
3. Results
3.1. Descriptive analysis
Regarding the general characteristics of the patients, we observed in Tables 1 and 2 that the majority is female (53.3 %), with traumatic cause (60.0 %), with facial paralysis of the right side (53.3 %) and grade V (53.3 %). The average age of patients is 37 years, ranging from 22 to 55 years.
We observed in Table 2 that the average amount of Oleary is 16.1 %, since the patient with the highest amount has 28.6 % and the one with the lowest amount has nothing. Analyzing the left and right sides separately, we have that the right side has a slightly higher average amount of oleary (16.8 %) when compared to the left side (15.2 %). As for the DMFT, the average value was 13.6.
Table 1General features frequency
Variable | Category | N (%) |
Sex | Female | 8 (53, 3) |
Male | 7 (46, 7) | |
Cause | Traumátic | 9 (60, 0) |
Idiopatic | 6 (40, 0) | |
Side PFP | Right | 8 (53, 3) |
Left | 7 (46, 7) | |
Level | III | 5 (33, 3) |
IV | 2 (13, 3) | |
V | 8 (53, 3) |
Table 2Summary measurements
N | Mínium | Mean | Median | Maximum | Standard deviation | |
Age | 15 | 22 | 37 | 36 | 55 | 10,637 |
oleary | 15 | 0.00 % | 16.10 % | 17.70 % | 28.60 % | 7.30 % |
oleary R | 15 | 0.00 % | 16.80 % | 17.00 % | 42.90 % | 9.70 % |
oleary L | 15 | 0.00 % | 15.20 % | 17.90 % | 34.60 % | 8.40 % |
3.2. Correlation
Table 3 shows the cross between the side with greater Oleary and the side of FP. We can note that of the 13 patients, in 7 of them the side with greater Oleary was in agreement with the side of PF. This crossing resulted in a Kappa concordance coefficient of 0.071, which characterizes a poor concordance according to the criteria presented in Table 4. We also observed that the association test between the side with greater Oleary and the side of FP was not significant (0.999), which indicates that the two variables are not associated.
Table 3Agreement between the greater Oleary side and the PFP side
Side PFP | Total | Kappa coefficient (p-valor) | p-valor (Chi Square) | |||
Right | Left | |||||
Greater oleary | Right | 4 (57, 1) | 3 (50) | 7 (53, 8) | 0,071 (0, 797) | > 0,999 |
Left | 3 (42, 9) | 3 (50) | 6 (46, 2) | |||
Table 4Ratings of the Kappa arrangement
Kappa | Agreement |
< 0.00 | None |
0.00-0.20 | Poor |
0.21-0.40 | Weak |
0.41-0.60 | Moderate |
0.61-0.80 | Substantial |
0.81-0.99 | Almost perfect |
1 | Perfect |
3.3. Crossings
When comparing the amount of Oleary with the sex of the patients (Table 5), we observed that the average value in females was 18.4 %, ranging from 8 % to 28.6 %, while in males the average value was 13.5 %, ranging from 0 % to 21.5 %. The same pattern remains when we evaluate the Oleary on the left and right sides separately. However, we have no significant difference between Oleary values in relation to sex.
Table 6 shows the descriptive measures of the Oleary according to the cause. We observed that the traumatic cause presents higher mean Oleary values, both in general (17.4 %) and when analyzing the sides separately (17.9 % on the right side and 16.3 % on the left side). However, in analyzing the tests, we noted that these differences were not statistically signific.
Table 5Crossings between Oleary and Sex
N | Mínimum | Average | Median | Máximum | Standard deviation | P-value | ||
oleary | Female | 8 | 8.00 % | 18.40 % | 19.20 % | 28.60 % | 6.90 % | 0.281 |
Male | 7 | 0.00 % | 13.50 % | 14.20 % | 21.50 % | 7.20 % | ||
Total | 15 | 0.00 % | 16.10 % | 17.70 % | 28.60 % | 7.30 % | ||
oleary R | Femele | 8 | 3.80 % | 18.10 % | 16.80 % | 42.90 % | 11.30 % | 0.779 |
Male | 7 | 0.00 % | 15.30 % | 18.30 % | 23.30 % | 7.90 % | ||
Total | 15 | 0.00 % | 16.80 % | 17.00 % | 42.90 % | 9.70 % | ||
oleary L | Femele | 8 | 11.50 % | 18.20 % | 16.10 % | 34.60 % | 7.50 % | 0.397 |
Male | 7 | 0.00 % | 11.80 % | 18.30 % | 18.80 % | 8.60 % | ||
Total | 15 | 0.00 % | 15.20 % | 17.90 % | 34.60 % | 8.40 % | ||
Table 6Crossings between Oleary and Cause
N | Mínimum | Average | Median | Máximum | Standard deviation | P-value | ||
oleary | Traumátic | 9 | 0.00 % | 17.40 % | 18.80 % | 28.60 % | 8.60 % | 0.328 |
Idiopátic | 6 | 8.00 % | 14.20 % | 14.00 % | 19.60 % | 4.70 % | ||
Total | 15 | 0.00 % | 16.10 % | 17.70 % | 28.60 % | 7.30 % | ||
oleary R | Traumátic | 9 | 0.00 % | 17.90 % | 16.70 % | 42.90 % | 11.40 % | 0.864 |
Idiopátic | 6 | 3.80 % | 15.20 % | 17.80 % | 21.40 % | 6.90 % | ||
Total | 15 | 0.00 % | 16.80 % | 17.00 % | 42.90 % | 9.70 % | ||
oleary L | Traumátic | 9 | 0.00 % | 16.30 % | 18.30 % | 34.60 % | 9.70 % | 0.456 |
Idiopátic | 6 | 1.90 % | 13.50 % | 15.20 % | 18.80 % | 6.50 % | ||
Total | 15 | 0.00 % | 15.20 % | 17.90 % | 34.60 % | 8.40 % | ||
In Table 7 we evaluated whether the amount of Oleary is different according to the FP side. In this case, we observed that the amount of Oleary (both general and separating the sides) is not related to the FP side since we observed mean and median values very close between the two sides and the p-values showed no significant differences.
Table 7Crossings between Oleary and side
N | Mínimum | Average | Median | Maximum | Standart deviation | P-value | ||
oleary | 8 | 0.00 % | 16.50 % | 19.00 % | 28.60 % | 9.50 % | 0.867 | |
Left | 7 | 10.00 % | 15.60 % | 14.20 % | 21.50 % | 4.30 % | ||
Total | 15 | 0.00 % | 16.10 % | 17.70 % | 28.60 % | 7.30 % | ||
oleary R | Right | 8 | 0.00 % | 17.30 % | 17.00 % | 42.90 % | 12.90 % | > 0.999 |
Left | 7 | 10.00 % | 16.30 % | 17.00 % | 23.30 % | 4.80 % | ||
Total | 15 | 0.00 % | 16.80 % | 17.00 % | 42.90 % | 9.70 % | ||
oleary L | Rigt | 8 | 0.00 % | 15.80 % | 16.10 % | 34.60 % | 10.30 % | 0.955 |
Left | 7 | 1.90 % | 14.50 % | 18.30 % | 19.60 % | 6.30 % | ||
Total | 15 | 0.00 % | 15.20 % | 17.90 % | 34.60 % | 8.40 % | ||
Table 8Crossings between Oleary and grade
N | Mínimum | Average | Median | Máximum | Standart deviation | P-value | ||
oleary | III | 5 | 10.00 % | 14.30 % | 13.80 % | 21.50 % | 4.40 % | – |
IV | 2 | 8.00 % | 14.10 % | 14.10 % | 20.20 % | 8.60 % | ||
V | 8 | 0.00 % | 17.70 % | 19.00 % | 28.60 % | 8.80 % | ||
Total | 15 | 0.00 % | 16.10 % | 17.70 % | 28.60 % | 7.30 % | ||
oleary R | III | 5 | 10.00 % | 15.80 % | 17.00 % | 23.30 % | 5.80 % | – |
IV | 2 | 3.80 % | 10.20 % | 10.20 % | 16.60 % | 9.00 % | ||
V | 8 | 0.00 % | 19.10 % | 17.80 % | 42.90 % | 11.70 % | ||
Total | 15 | 0.00 % | 16.80 % | 17.00 % | 42.90 % | 9.70 % | ||
oleary L | III | 5 | 1.90 % | 12.70 % | 13.60 % | 18.30 % | 6.80 % | – |
IV | 2 | 12.50 % | 16.10 % | 16.10 % | 19.60 % | 5.00 % | ||
V | 8 | 0.00 % | 16.50 % | 18.10 % | 34.60 % | 10.30 % | ||
Total | 15 | 0.00 % | 15.20 % | 17.90 % | 34.60 % | 8.40 % | ||
Finally, comparing the variables with respect to grade (Table 8) we have that grade V has slightly higher mean values of Oleary (17.7 %) when compared to grade IV (14.1 %) and grade II (14.3 %). The same behavior is observed evaluating Oleary separately for the right and left sides.
4. Discussion
Caries is a multifactorial disease and the need for attention to oral health should be present uninterruptedly. The proper brushing technique ensures oral health, regardless of pathology.
Patients suffering from caries and periodontal diseases initiate a masticatory preference on the healthy side, this fact over time may lead to facial asymmetry [9].
According to the sample, patients with higher plaque index, and more correspondence between the paralysis side and increased plaque, were those who had grade V traumatic facial paralysis, but the rates were not efficient when compared to the entire sample.
According to federal government health programs, last conducted in 2023, in adults aged 35 to 44, the numbers presented were a DMFT index of 10.74 [10]. The DMFT index of the sample was 13.6, therefore close to the rest of the population.
Regardless of this fact, special attention should be given to patients with facial paralysis because they have the same ease of having cavities as the rest of the population, with the aggravating factor of having a difference in muscle tone on the paralyzed side.
5. Conclusions
There is no correlation between the Facial Palsy side and the increased plaque index. The oral health condition of this sample is slightly worse when compared to the rest of the population.
References
-
www.paralisia.com/paralisia-facial/paralisia-facial.html.
-
A. S. Hazan, F. Nahas, R. Faria, R. Sender, and L. Ferreira, “Muscle subunit transplants in facial reanimation,” Acta Cirúrgica Brasileira, Vol. 21, No. 2, pp. 61–65, Mar. 2006.
-
A. Tessitore, L. N. Pfeilsticker, and J. R. Paschoal, “Aspectos neurofisiológicos da musculatura facial visando a reabilitação na paralisia facial,” Revista CEFAC, Vol. 10, No. 1, pp. 68–75, Mar. 2008, https://doi.org/10.1590/s1516-18462008000100010
-
Domingos and Mauricio de Maio, “The use of botulinum toxin in patients with facial muscle hyperkinesia contralateral to facial paralysis,” (in Portuguese), University of São Paulo, São Paulo, 2006, https://doi.org/10.11606/t.5.2006.tde-17082006-104941
-
J. R. G. Testa and Y. Fukuda, “Peripheral idiopathic facial paralysis: incidence and prognostic factors,” ACTA AWHO, Vol. 12, No. 1, pp. 9–18, Jan. 1993.
-
R. de Queiroz, H. K. Yamashita, M. N. Gribel, and J. R. G. Testa, “Influence of the facial nerve on facial bone growth and development in patients with congenital or acquired facial paralysis during childhood: a tomographic study,” Journal of Plastic, Reconstructive and Aesthetic Surgery, Vol. 116, pp. 185–194, May 2026, https://doi.org/10.1016/j.bjps.2026.03.043
-
L. S. Cornejo, M. Brunotto, and E. Hilas, “Salivary factors associated with prevalence and increase of dental caries in rural schoolchildren,” (in Spanish), Revista De Saúde Pública, Vol. 42, No. 1, pp. 19–25, Feb. 2008, https://doi.org/10.1590/s0034-89102008000100003
-
G. B. Proctor, “The physiology of salivary secretion,” Periodontology 2000, Vol. 70, No. 1, pp. 11–25, Feb. 2015, https://doi.org/10.1111/prd.12116
-
S. Silveira, P. Valerio, and A. J. Machado Júnior, “The law of minimum vertical dimension: evidence for improvement of dental occlusion,” European Journal of Dentistry, Vol. 16, No. 2, pp. 241–250, May 2021, https://doi.org/10.1055/s-0041-1732950
-
Brazil, Ministry of Health, Secretariat of Primary Health Care, Department of Community Health Strategies and Policies, SB Brasil 2023: National Oral Health Survey – Final Report [Online]. Brasília, Brazil, 2024, https://www.gov.br/saude/pt-br/composicao/saps/brasil-sorridente/sb-brasil/dados
About this article

The authors have not disclosed any funding.
The datasets generated during and/or analyzed during the current study are available from the corresponding author on reasonable request.
Rosana de Queiroz- conceptualization, data curation, formal analysis, investigation, methodology, project administration, writing-original, draft preparation-original, review and editing, resources. Raquel Guimaraes Lang: visualization. Fabiana A Borgh: visualization, investigation. José Ricardo Gurgel Testa: conceptualization, data curation, formal analysis, investigation, methodology, project administration, supervision, validation.
The authors declare that they have no conflict of interest.
This study was approved by the ethics and research committee of the São Paulo Hospital under number 1940/09.

