Abstract
Warming and wetting on the Qinghai-Tibet Plateau (QTP), together with increasing engineering disturbance, have accelerated permafrost degradation along the Qinghai-Tibet Engineering Corridor (QTEC), inducing surface deformation that threatens infrastructure stability and environmental safety. Interferometric synthetic aperture radar (InSAR) has become an effective tool for large-scale deformation monitoring; however, conventional single-orbit ascending or descending observations measure only one-dimensional line-of-sight (LOS) displacement. Because LOS deformation represents a projection of actual ground motion, it cannot always be directly interpreted as vertical uplift or subsidence, especially where horizontal displacement is significant. In this study, ascending and descending Sentinel-1 InSAR observations from 25 February 2017 to 31 March 2022 were integrated to decompose two-dimensional deformation components, namely east-west and vertical displacement, in the permafrost zone of the QTEC. Based on the decomposed results, surface-deformation types were discriminated, and the interpretation applicability of conventional single-orbit LOS observations was quantitatively evaluated using vertical deformation as a reference. The results show that single-orbit LOS deformation can reasonably represent vertical deformation in 52.84 % of the study area, whereas the remaining 47.16 % is dominated by horizontal displacement and is therefore unsuitable for direct interpretation as uplift or subsidence. These findings highlight the necessity of distinguishing deformation types before interpreting LOS deformation and provide practical guidance for improving the reliability of InSAR-based deformation monitoring and engineering-risk assessment in permafrost corridors.
Highlights
- Ascending and descending Sentinel-1 LOS data were jointly analyzed for QTEC.
- A practical rule set discriminates vertical and horizontal deformation types.
- 2-D UD and E-W deformation fields revealed substantial horizontal motion.
- Single-orbit LOS interpretation was suitable for 52.84% of the area.
- Horizontal motion made LOS uplift/subsidence interpretation unsuitable in 47.16%.
1. Introduction
Permafrost refers to ground materials, including soil, sediment, and bedrock, that remain at or below 0 °C for at least two consecutive years [1-2]. It is widely distributed across the Qinghai-Tibet Plateau (QTP), a region often referred to as the Roof of the World and the Third Pole. Under the influence of global climate change, the QTP has experienced pronounced warming, with a warming rate approximately twice the global average [3-4]. Owing to its high elevation, extensive cryospheric components, and strong land–atmosphere interactions, the QTP has also been regarded as an important indicator and amplifier of global climate change [5]. Permafrost on the plateau is highly sensitive to climatic warming because its thermal state is often close to the thawing threshold. Continued warming weakens the thermal stability of permafrost, increases active-layer thickness, and promotes the thawing of near-surface ground ice [6-9]. These processes can accelerate permafrost degradation and induce a range of freeze-thaw-related geohazards and engineering problems [7]. Common permafrost-related hazards include thaw subsidence [10], retrogressive thaw slumps [11], slope instability, active-layer thickening, thaw-induced mudflows, and the development of thermokarst lakes or ponds [12]. Many of these processes are accompanied by measurable surface deformation, which can be detected and monitored using satellite remote sensing techniques.
Freeze–thaw hazards along the Qinghai-Tibet Engineering Corridor (QTEC) mainly include thaw-related hazards, such as thaw slumps, thermokarst lakes, thermokarst gully erosion, and thaw subsidence, as well as frost-heave-related hazards, including pingos, frost mounds, ice cones, and ice curtains [7]. Thaw-related hazards generally result from the long-term thawing and degradation of ice-rich permafrost, during which soil compression, consolidation, deformation, and displacement occur as excess ground ice melts [13]. These processes can reshape surface morphology, reduce the mechanical stability of rock and soil masses, and promote instability in associated geomorphic units. When such deformation processes directly or indirectly affect engineering structures or the ecological environment, they may develop into permafrost-related geological hazards [14].
Frost-heave-related hazards are mainly controlled by water migration toward freezing fronts and by the in situ freezing of pore water within soils. The associated volumetric expansion produces upward or lateral deformation during the freezing process [6]. These hazards may be expressed not only as frost-heave damage to engineering structures but also as the formation of ice-rich landforms or icing features, such as frost mounds, ice cones, and ice curtains [15]. In engineering corridors, construction and maintenance activities can disturb the natural hydrothermal regime and alter groundwater flow paths, thereby enhancing local ice accumulation and inducing secondary hazards such as subgrade uplift, pavement deformation, lateral compression, and surface icing [7, 14, 16]. The rapid development and spatial expansion of freeze-thaw hazards can substantially affect permafrost ecosystems by promoting terrain fragmentation, landscape degradation, soil erosion, and disturbance of cold-region hydrological systems [17]. More importantly, these processes pose direct and indirect threats to major infrastructure distributed across the QTEC. Surface deformation is therefore a fundamental surface expression of both thaw-related and frost-heave-related processes and provides a key observable indicator for the early identification and assessment of permafrost-related geological hazards [14]. Systematic monitoring and quantitative analysis of surface deformation are thus essential for hazard characterization, risk evaluation, and engineering protection in the permafrost regions of the QTEC.
Traditional investigations of surface deformation in permafrost regions have mainly relied on in-situ monitoring, laboratory experiments, and numerical modeling [18]. These approaches have provided important insights into localized deformation processes and mechanisms along the QTEC, particularly regarding the factors that control deformation in permafrost environments [19-20]. Existing studies indicate that surface deformation in permafrost regions is a complex thermos-hydro-mechanical process [21-22], which can be understood from two closely related perspectives: natural ground-deformation mechanisms and engineering-subgrade deformation responses.
For natural ground deformation, the evolution of surface displacement is mainly governed by seasonal freeze–thaw processes in the active layer and long-term thermal degradation of the underlying permafrost [23]. Active-layer deformation is controlled by lithology, physical and mechanical properties of near-surface materials, and the spatiotemporal variability of the ground thermal regime. In contrast, long-term permafrost deformation is strongly influenced by ground-ice content, mean annual ground temperature, and stress conditions [24]. The deformation response is often nonlinear under changing environmental and engineering conditions. Under certain thermal conditions, embankment loading may reduce thaw depth and produce the characteristic pattern of greater embankment height accompanied by smaller deformation [7]. Conversely, in warm and ice-rich permafrost, deformation may increase with rising ground temperature and applied loads. From the perspective of engineering-subgrade response, total settlement can generally be decomposed into four components, i.e., compaction of fill materials, seasonal deformation of the active layer, thaw settlement of permafrost, and creep compression of warm frozen soils [25]. Among these components, thaw settlement is commonly the dominant contributor to differential deformation and is mainly controlled by embankment height, ground-ice content, and ground temperature. Creep deformation of warm permafrost is further affected by soil compressibility and the in-situ stress state.
Engineering activities can further modify the natural thermal and hydrological conditions of permafrost. For example, asphalt pavement changes the surface thermal boundary condition, promotes downward migration of the artificial permafrost table, and induces thawing of subsurface ice [6]. This process can generate interlayer displacement and nonuniform deformation characterized primarily by thaw settlement, with secondary effects of frost heave. Under ongoing climate warming, deep permafrost with high temperature and high ice content has become an important source of long-term settlement due to thermal softening and compressive deformation [5, 8, 26]. Even when the permafrost table is elevated through engineering measures, continued warming of deeper frozen soils may still generate substantial long-term settlement. Numerical simulations have suggested that cumulative settlement in several key sections of the corridor may exceed 30 cm over the next 50 years [7, 14], posing serious challenges to the long-term stability and serviceability of permafrost infrastructure.
With the development of synthetic aperture radar (SAR) remote sensing, interferometric SAR (InSAR) has become an important technique for monitoring surface deformation over large areas [10, 14]. Gabriel et al. first demonstrated the application of differential InSAR (D-InSAR) for deformation monitoring in Imperial Valley, California, USA, using SeaSat data [27]. Their study showed that InSAR could detect surface deformation at the centimeter level, thereby promoting its application in geodetic and geological hazard monitoring. However, conventional D-InSAR is limited in its ability to characterize continuous deformation because it generally reflects deformation over a single interferometric period and is vulnerable to temporal decorrelation, spatial decorrelation, atmospheric delay, and topographic residual errors [14, 28]. To overcome these limitations, multi-temporal InSAR (MT-InSAR) techniques, including small baseline subset InSAR (SBAS-InSAR) [10] and persistent scatterer InSAR (PS-InSAR) [29], have been developed to retrieve time-series deformation. By exploiting multiple SAR acquisitions, MT-InSAR can reduce the influence of atmospheric disturbances, decorrelation, terrain inaccuracies, and other error sources, thereby improving the reliability of deformation monitoring.
MT-InSAR has been widely applied to urban deformation [30], infrastructure deformation [31], mining-induced deformation [32], earthquake deformation [29], volcanic deformation [33], landslide monitoring [34], glacier motion [35], and permafrost process monitoring [36]. In permafrost regions of the QTP and QTEC, previous studies have used InSAR to map large-scale deformation patterns, analyze long-term deformation along engineering corridors, incorporate climatic factors into deformation modeling, and monitor permafrost-related displacement processes [23, 25, 28, 36]. These studies have significantly improved the understanding of permafrost deformation and its environmental and engineering implications.
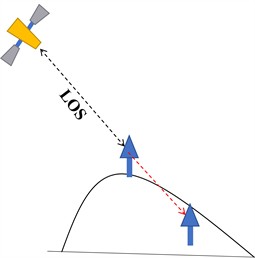
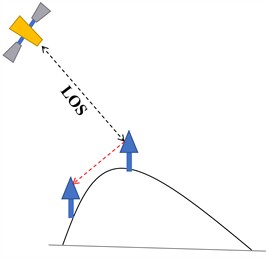
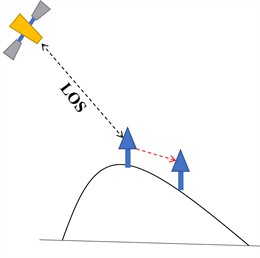
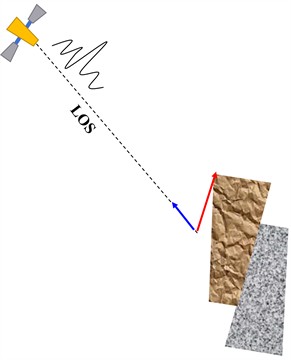
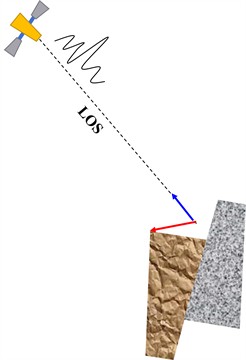
Despite these advances, InSAR deformation measurements derived from a single satellite orbit represent only one-dimensional line-of-sight (LOS) displacement (Fig. 1). LOS deformation is a projection of the actual three-dimensional surface deformation onto the radar viewing direction [14]. Positive and negative LOS values indicate motion toward or away from the satellite, respectively, and therefore cannot be directly interpreted as surface uplift or subsidence in all cases [32, 37]. This limitation is particularly important in permafrost regions, where deformation may include both movements, i.e., the vertical movement associated with thaw settlement or frost heave and horizontal movement related to slope processes, lateral soil displacement, or terrain instability. If single-orbit LOS deformation is directly treated as vertical deformation, deformation patterns may be misinterpreted or important deformation components may be overlooked (Fig. 2).
Fig. 1Schematic illustration of InSAR line-of-sight (LOS) sensitivity under different displacement geometries: a) displacement parallel to the LOS; b) displacement perpendicular to the LOS; and c) displacement oriented at an arbitrary angle to the LOS
a) Consistent
b) Vertical
c) Arbitrary
Fig. 2Schematic illustration of the ambiguity inherent in InSAR line-of-sight (LOS) measurements: different ground-deformation vectors can produce the same LOS displacement, as exemplified by a) uplift and b) subsidence
a) Uplift
b) Subsidence
Some studies have attempted to reconstruct three-dimensional surface deformation by combining InSAR with multiple-aperture interferometry (MAI) or pixel offset tracking (POT) techniques [29]. However, these approaches are often constrained by data quality, coherence requirements, measurement accuracy, and the numerical stability of three-dimensional inversion [37]. In principle, integrating SAR observations from multiple platforms and viewing geometries provides a more robust solution for three-dimensional deformation retrieval and can reduce reliance on MAI or POT measurements [29]. Nevertheless, limitations in SAR data availability and acquisition geometry still restrict comprehensive three-dimensional deformation analysis over large areas and long-time spans. These limitations may be partially alleviated with the future availability of additional satellite datasets, such as the NASA-ISRO Synthetic Aperture Radar (NISAR) mission [38].
Because SAR satellites have limited sensitivity to north-south deformation, a practical approach is to assume that north-south motion is negligible and then combine ascending and descending LOS observations to decompose two-dimensional deformation components, namely vertical up-down (UD) deformation and horizontal east-west (E-W) deformation. This approach is particularly useful for evaluating whether conventional single-orbit LOS observations can reliably represent vertical deformation. Existing studies of the QTEC have mainly focused on LOS or vertical deformation monitoring. In many cases, the positive and negative signs of LOS deformation have been directly interpreted as uplift and subsidence, single-orbit LOS measurements have been projected into the vertical direction, or ascending and descending observations have been combined primarily to solve the vertical component [25, 36]. These approaches are useful where vertical motion dominates, but their applicability may be limited in areas where horizontal deformation is substantial.
At present, a comprehensive and systematic evaluation is still lacking regarding the differences between conventional one-dimensional ascending or descending LOS deformation and jointly decomposed two-dimensional UD and E-W deformation in the QTEC. In particular, it remains unclear where single-orbit LOS deformation can reasonably represent vertical deformation and where it may lead to misleading interpretations. To address this gap, this study integrates ascending and descending LOS deformation results from the QTEC from 25 February 2017 to 31 March 2022 and derives the corresponding E–W and UD deformation components. Based on these results, we analyze the differences and correlations among InSAR-derived deformation measurements under different dominant deformation types and quantitatively evaluate the interpretation applicability of conventional one-dimensional LOS monitoring. This evaluation is important for improving the reliability of InSAR-based permafrost deformation monitoring and for supporting engineering-risk assessment along highways, railways, and other major infrastructure in the QTEC.
2. Overview of the study area
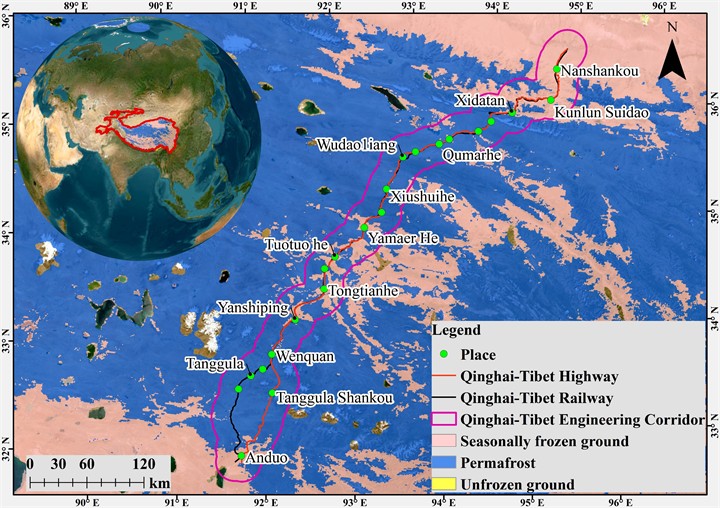
The QTEC is located in the central-eastern part of the QTP and forms an important north-south engineering corridor between Golmud City in the north and Lhasa City in the south. It is one of the highest-altitude and most environmentally challenging engineering corridors in the world. Major linear infrastructure systems, including the Qinghai–Tibet Railway (QTR), Qinghai-Tibet Highway (QTH), Golmud–Lhasa Oil Pipeline, high-voltage power transmission lines, and fiber-optic communications cable have been constructed progressively within this corridor [24, 39]. The permafrost regions (from Xidatan to Anduo, Fig. 3) crossed by the QTR and QTH span three major climatic zones, i.e., the arid climate zone north of the Kunlun Mountains, the plateau cold–dry climate zone between the Kunlun and Tanggula Mountains, and the semi-arid climate zone south of the Tanggula Mountains [22]. These regions show marked spatial variations in climate, with typical cold and dry plateau conditions, pronounced altitudinal zonation, and an evident tendency toward warming and wetting [1].
The permafrost region of the QTEC is characterized by a cold and arid environment, strong climatic variability, weak seasonal differentiation, thin air, low atmospheric pressure, and a long freezing period lasting approximately 7-8 months each year [7]. The mean annual air temperature ranges from –6.9 to –2.0 °C. July is the warmest month, with mean temperatures of approximately 6.5-8.1 °C, whereas January is the coldest month, with mean temperatures of approximately –17.4 to –14.5 °C [14]. The annual temperature range is generally 15-26 °C, and the extreme annual range is usually less than 50 °C. Mean diurnal temperature variation ranges from 10 to 19 °C, with extreme daily fluctuations reaching up to 35 °C. Air temperature is strongly controlled by elevation and decreases markedly with increasing altitude. The mean annual air temperature has increased at a rate of approximately 0.029-0.081 °C yr−1, with higher warming rates in the southern part of the corridor than in the northern part.
Annual precipitation in the QTEC permafrost region is generally 200-500 mm, with a reported increasing rate of up to 5.1 mm yr−1 [5]. The rate of precipitation increase tends to decrease southward, and evaporation substantially exceeds precipitation across much of the corridor. In high mountain areas, precipitation mainly occurs as snow and hail, whereas rainfall dominates across the extensive plateau plains. Approximately 60 %-90 % of annual precipitation is concentrated in the warm season, while winter snowfall is relatively limited. Except in some high mountain areas, snow cover is generally thin, discontinuous, and unstable. Prevailing winds are mainly from the northwest and west, and strong winds occur most frequently from October to April of the following year. These climatic and environmental conditions strongly influence the thermal regime of permafrost and provide the background for freeze–thaw-related surface deformation along the corridor. The deformation analysis in this study covers the period from 25 February 2017 to 31 March 2022.
Fig. 3Geographical location and permafrost distribution in the Qinghai-Tibet Engineering Corridor
3. Data and methods
This section introduces the ground-deformation dataset, the ascending- and descending-orbit decomposition strategy, and the criteria used to identify dominant surface-deformation types.
3.1. Ground deformation dataset
The surface deformation rate data used in this study are derived from the InSAR time-series deformation dataset for the permafrost region of the QTEC. This dataset is based on imagery from the European Space Agency’s Sentinel-1 satellite and is generated using the LiCSAR (Looking Into Continents from Space with Synthetic Aperture Radar) data product [40], produced and provided by NERC COMET (https://comet.nerc.ac.uk/) in the UK. Temporal deformation inversion processing was performed using the open-source LiCSBAS toolkit [41] and NSBAS (New Small Baseline Subset InSAR) technology [42]. The dataset has a spatial resolution of approximately ~100 meters and covers the entire permafrost region of the QTEC [43]. To ensure consistent comparison among the ascending, descending, UD, and E-W results, all analyses in this study use the common period from 25 February 2017 to 31 March 2022.
The dataset includes the LOS time series, cumulative deformation, and average deformation rate in both ascending and descending observation directions. Based on these data, it is assumed that north-south deformation can be neglected. 2-D deformation information in the vertical (UD) and horizontal (E-W) directions is obtained by jointly solving the ascending and descending orbit data [14,43] (see Eq. (1)). During data processing, products from the Generic Atmospheric Correction Online Service for InSAR (GACOS, http://www.gacos.net/) are used to correct atmospheric phase delays [44-45]. The correction reduces topography-correlated and long-wavelength tropospheric delays and thereby improves the signal-to-noise ratio of the deformation estimates. The small-baseline connection network is optimized through phase closure, and the Bootstrap algorithm is employed to estimate the variance of the deformation rate [40-41]. Residual atmospheric phase is separated from the true deformation signal using spatiotemporal filtering, ensuring data reliability. Overlapping areas of each subregion are adjusted using an averaging algorithm for regional network adjustment to further reduce fusion errors:
where and denote the LOS deformation observations from the ascending and descending orbits, respectively; and denote the radar incidence and heading angles, respectively; and and are the vertical and E-W deformation components to be solved. By solving this system of equations, the E-W and vertical deformation rates, as well as the cumulative deformation values, are obtained simultaneously for the same epoch.
This dataset has been validated through comparison with related research findings and on-site monitoring data. The results demonstrate high consistency and accuracy, with a deformation rate standard deviation of no more than 0.5 millimeters per year in most areas [14, 43]. The dataset is freely available and open-source, providing scientific support for engineering maintenance, operations, and ecological environment protection in the permafrost region of the QTEC. Additionally, it can serve as input data for research on active layer thickness inversion, quantitative analysis of surface retrogressive thaw slump and thaw landslides, and identification of thermokarst lakes and ponds.
3.2. Discrimination of surface deformation types
The deformation information in the LOS direction includes geometric position parameters related to the satellite. Due to the complexity of actual surface deformation, where vertical and horizontal movements may occur simultaneously. Therefore, deformation monitoring results obtained from a single ascending or descending orbit SAR dataset often differ for the same observation area and cannot fully represent the true surface deformation. The reference point for LOS deformation rate is the SAR satellite. For the Sentinel-1 satellite, a positive LOS deformation rate indicates that the target object is moving closer to the satellite along the LOS direction, while a negative value indicates that the target is moving away from the satellite [29, 32, 46]. The absolute value represents the magnitude of this movement. It is important to note that positive or negative values do not directly correspond to surface uplift or subsidence. Considering that the flight paths of SAR satellites in ascending and descending orbits are approximately north-south, and the radar wave emission direction is primarily east-west, InSAR measurements are insensitive to north-south deformation and typically assume it to be zero – that is, no north-south surface deformation. Based on this assumption, the type of surface deformation can be inferred from the positive and negative differences in LOS deformation rates between ascending and descending passes, as illustrated in Fig. 4.
Specifically, as shown in Fig. 4, the type of surface deformation can be qualitatively determined based on the difference in LOS deformation rates between ascending and descending orbits. However, when surface deformation is not primarily vertical and significant horizontal displacement is present, especially in the east-west direction, one-dimensional LOS deformation from a single ascending or descending orbit cannot adequately represent the actual deformation field. The detailed criteria for judgment are presented in Table 1. When the deformation rates from both orbits are negative simultaneously, indicating movement away from the satellite, the surface is primarily subsiding. Conversely, when both deformation rates are positive, indicating movement toward the satellite, the surface is mainly uplifting. If the trends of the two measurements are inconsistent, this suggests significant E-W deformation on the surface, with possible north-south displacement, indicating that the surface deformation at that location is predominantly horizontal. Specifically, if the LOS deformation rate during the ascending pass is positive while the descending pass rate is negative, the surface is primarily moving horizontally westward. Conversely, if the ascending orbit shows a negative LOS deformation rate and the descending orbit shows a positive rate, the surface displacement is mainly eastward. It is important to note that this interpretation is only a preliminary qualitative assessment. For accurate determination of actual surface deformation types, especially for small-area deformation results, it is necessary to consider the specific context and consult the accumulated deformation results over a time series.
Fig. 4Schematic diagram and comparative analysis of SAR data monitoring for ascending and descending orbits
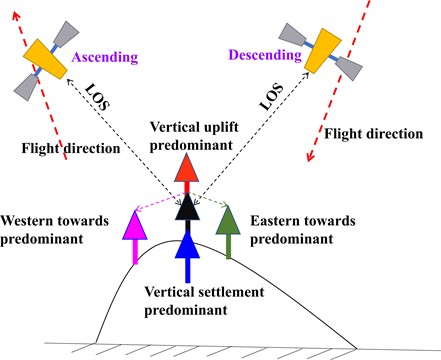
Table 1Preliminary applicability assessment of surface deformation types based on line-of-sight deformation rates from ascending and descending data
Rules | Settlement type | Applicability |
< 0, < 0 | Vertical subsidence dominated | Suitable |
> 0, > 0 | Vertical uplift dominated | Suitable |
< 0, > 0 | Horizontal eastward movement dominated | Unsuitable |
> 0, < 0 | Horizontal westward movement dominated | Unsuitable |
Note: and represent the line-of-sight deformation rates from ascending and descending orbits, respectively, measured over the same or similar time periods | ||
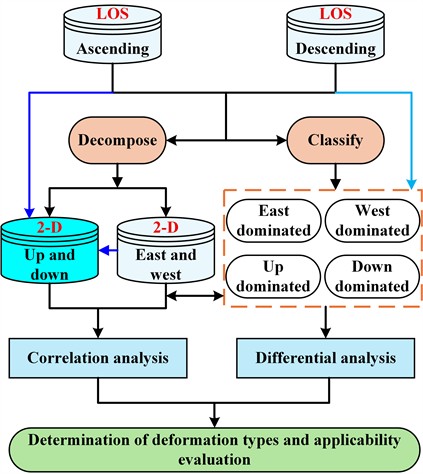
To further understand the surface deformation characteristics of the permafrost region within the engineering corridor, this study analyzes the differences and correlations among InSAR measurement results corresponding to various deformation types. It also quantitatively characterizes the distinctions across different InSAR deformation monitoring outcomes. The primary surface deformation types are identified based on discrepancies in joint ascending and descending orbit deformation rates. Subsequently, the correlations and statistical significance between ascending LOS deformation rate, descending LOS deformation rate, vertical (UD) deformation rate, and horizontal (EW) deformation rate are calculated for each deformation type. Pairwise Pearson product-moment correlation coefficients (Eq. (2)) were calculated in R for each deformation type. The overall technical workflow employed in this study is illustrated in Fig. 5.
The Pearson correlation coefficient was calculated as follows:
where and are paired deformation-rate observations, and are their means, and n is the number of paired observations. The corresponding -values were calculated for each pair, and < 0.01 was considered highly significant.
Fig. 5Overall technical workflow
4. Results and discussion
This section presents the 1-D LOS and decomposed 2-D deformation characteristics, evaluates the interpretation applicability of single-orbit LOS observations, and discusses correlations among the different deformation measurements.
4.1. Deformation characteristics of one-dimensional ascending and descending orbits
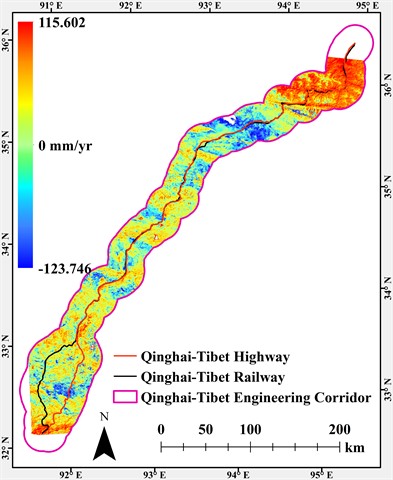
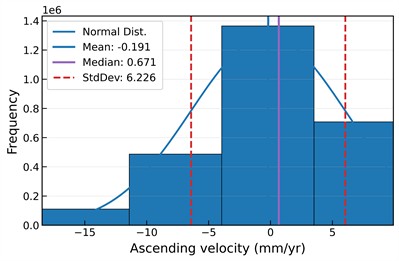
As shown in Fig. 6(a), the temporal processing results based on ascending orbit Sentinel-1 data perform well, exhibiting good coherence throughout the entire processing range, with no obvious incoherent phenomena except in lakes and surrounding areas. The cool blue color represents displacement of the Earth’s surface away from the satellite along the LOS direction, corresponding to negative values. Conversely, the warm red color indicates surface displacement approaching the satellite along the LOS direction, corresponding to positive values. Generally, negative values are interpreted as surface subsidence, while positive values indicate ground uplift. Although this interpretation has notable limitations, it is used here for convenience in describing the deformation results along the 1-D LOS direction of ascending and descending orbits. The absolute range of surface deformation rates within the engineering corridor (–123.746 mm/yr to 115.602 mm/yr) is smaller than that of the entire data processing area (–156.946 mm/yr to 127.193 mm/yr). Specifically, the maximum positive value is lower by 11.591 mm/yr, and the minimum negative value is higher by 33.200 mm/yr, indicating that the degree of deformation in the corridor is less severe than in the overall study area. Notably, regarding settlement, the minimum deformation value in the engineering corridor is significantly greater than that of the entire study area, suggesting that the region experiencing the most severe settlement lies outside the engineering corridor. According to the statistical analysis of deformation rates within the engineering corridor (Fig. 6(c)), the minimum deformation rate is –123.746 mm/yr, the maximum is 115.602 mm/yr, the average is –0.191 mm/yr, the median is 0.671 mm/yr, and the standard deviation is 6.226 mm/yr. Surface deformation in permafrost areas within the engineering corridor mostly ranges from –26.511 mm/yr to 18.367 mm/yr.
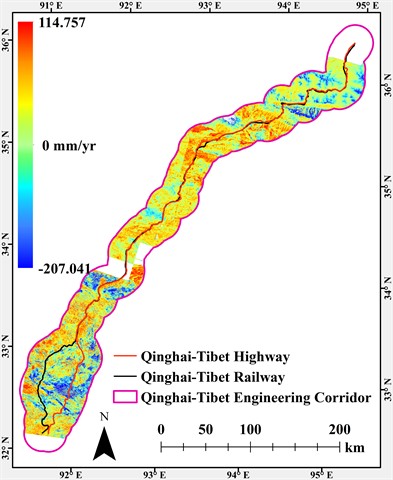
Fig. 6Sentinel-1 line-of-sight deformation along the QTEC: a), b) ascending- and descending-orbit spatial distributions, respectively, and c), d) corresponding histograms
a) Ascending velocity
b) Descending velocity
c) Histogram of ascending velocity
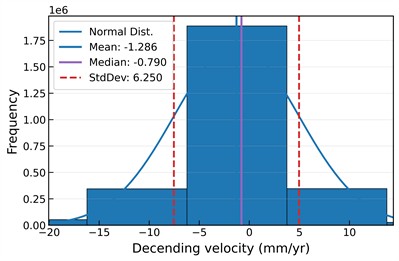
d) Histogram of descending velocity
According to the spatial distribution of the deformation rate (Fig. 6(b)), some missing values are present in the descending orbit data. Upon investigation, these missing values were found to be primarily caused by phase-unwrapping errors, which may result from decorrelation or data-processing issues. In permafrost environments, decorrelation can be associated with water bodies, seasonal snow or glacier cover, changes in surface cover, and steep terrain; elevation-related geometric distortion, including shadow and layover, may also contribute locally. The deformation rates for the permafrost region within the engineering corridor range from –207.041 mm/yr to 114.757 mm/yr, exhibiting a distribution similar to that of the entire data processing area. This indicates that the settlement or uplift areas inferred from the LOS deformation data obtained from the descending orbit are located within the QTEC. This finding contrasts with the conclusions drawn from the ascending orbit deformation results. The histogram of results within the engineering corridor (Fig. 6(d)) shows a strong consistency with the results across the entire data processing range. A slight difference is observed: there are more areas with deformation rates between –15.973 mm/yr and –5.917 mm/yr than areas with rates between 4.139 mm/yr and 14.195 mm/yr, indicating that the QTEC is predominantly characterized by settlement. This is supported by the negative mean (–1.286 mm/yr) and median (–0.790 mm/yr) values. The standard deviation is 6.250 mm/yr, which is slightly larger than that of the entire data processing range but remains comparable to deformation rates in most areas (–5.973 mm/yr to –4.139 mm/yr). Therefore, the spatial variability of deformation is not significant.
4.2. Two-dimensional east-west and vertical deformation characteristics
Fig. 7 presents the spatial distribution map and the statistical results of the 2-D (E-W and UD) deformation rate within the QTEC. For E-W deformation velocity, a positive value for the E-W deformation rate indicates eastward deformation, while a negative value indicates westward deformation. The magnitude of the value corresponds to the extent of the deformation. According to the distribution map and statistical analysis of the E-W deformation rate, from February 25, 2017, to March 31, 2022, the deformation rate across the entire data processing range varied between -123.319 mm/yr and 126.168 mm/yr, with most values concentrated between –29.761 mm/yr and 24.814 mm/yr. The majority of deformation rates in different regions ranged from –6.372 mm/yr to 9.221 mm/yr. The average, median, and standard deviation of the deformation rate were –0.374 mm/yr, 0.323 mm/yr, and 6.251 mm/yr, respectively, indicating that the overall distribution is close to balanced. Most locations show limited E-W motion, whereas localized high-magnitude westward movement shifts the mean slightly below zero.
The spatial distribution map of the E-W deformation rate along the engineering corridor (Fig. 7(a)) reveals that the surface of the Nanshankou to Kunlun Tunnel to Xidatan section exhibits a horizontal westward displacement, with absolute displacement rates ranging from 1.681 mm/yr to 15.196 mm/yr. Some areas show westward displacement intensities exceeding 21.954 mm/yr, primarily concentrated in high-altitude mountainous regions with glacier coverage, such as Yuzhu Peak, and the Kunlun Mountains. In other regions, most surfaces display slight westward deformation, with absolute rates not exceeding 8.439 mm/yr. Conversely, the section from Kunlun Mountain Pass through Budongquan Town and Suonandajie Protection Station to the Chumar River demonstrates a significant horizontal eastward displacement trend, with deformation velocities exceeding 18.592 mm/yr, indicating notable horizontal movement in these areas. Additionally, a large area on the north side of the Yanshiping Town to Wenquan Town section exhibits horizontal eastward displacement rates above 18.592 mm/yr. Similar eastward displacement trends are also observed in the Tanggula Mountains.
The statistical analysis of the east-west deformation rates within the engineering corridor (Fig. 7(a) and (c)) indicates that the deformation rate ranges from –123.319 mm/yr to 92.926 mm/yr, with most values concentrated between –28.712 mm/yr and 25.349 mm/yr. The majority of regions exhibit deformation rates between –8.439 mm/yr and 5.076 mm/yr, followed by ranges of –15.196 mm/yr to –8.439 mm/yr and 5.076 mm/yr to 11.834 mm/yr. The average, median, and standard deviation of the deformation rates are –0.969 mm/yr, –0.781 mm/yr, and 6.440 mm/yr, respectively. These results indicate that, across the entire engineering corridor in the east-west direction, most areas experience a slight horizontal westward displacement, with displacement intensity comparable to that observed across the full data processing range.
Fig. 7Sentinel-1-derived east-west and vertical surface deformation rates: a), b) spatial distributions, respectively, and c), d) corresponding histograms
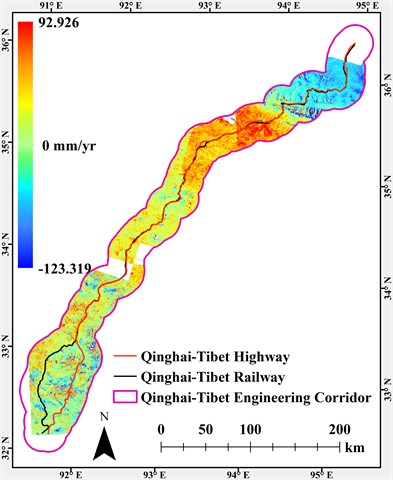
a) East-west velocity
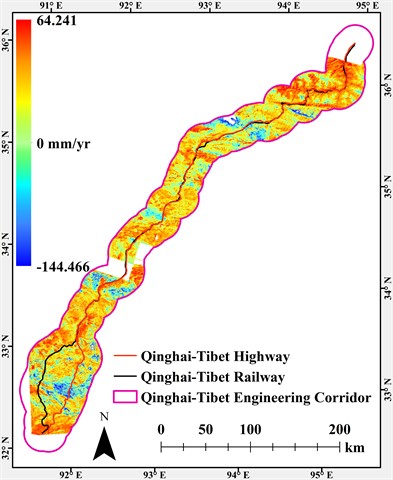
b) Vertical velocity
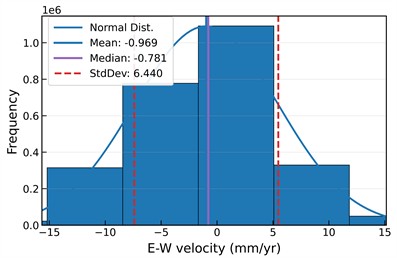
c) Histogram of east–west velocity
d) Histogram of vertical velocity
For the UD component (see Fig. 7(b)), due to low data coherence near the Tongtian River in the descending-orbit observations, there is a data gap in the surrounding area. This may be associated with water bodies, changing surface-cover conditions, and local terrain effects. Significant subsidence along the QTH and QTR occurs in the section from Budongquan Town to Suonandajie Protection Station to Chumar River, which is adjacent to the Salt Lake in Hoh Xil. Following the 2012 Zhuonai Lake breach, the downstream Salt Lake area experienced a sharp increase in water volume, altering the original surface thermal conditions and causing severe degradation of underground ice and permafrost. Additionally, the construction of diversion channels led to notable surface subsidence due to excavation. Significant subsidence is also observed along the QTH in the Tanggula Mountain section, where the subsidence rate exceeds 27.068 mm/yr. Some areas exhibit settlement velocities exceeding 20 mm/yr. Large continuous areas exhibiting obvious uplift are located along the Tongtian River to Yanshiping Town to Wenquan Town regions, with uplift rates ranging from 0 to 12.064 mm/yr.
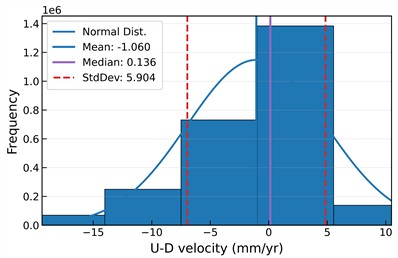
The statistical results for the UD component of the QTEC, shown in Fig. 7(d), indicate that the vertical deformation rate ranges from –27.068 mm/yr to 18.586 mm/yr. Most deformation rates fall between –7.502 mm/yr and 5.542 mm/yr, followed by ranges of –14.024 mm/yr to –7.502 mm/yr and 5.524 mm/yr to 12.064 mm/yr. A small portion of the area experiences relatively severe subsidence, with rates exceeding –20 mm/yr, while a very small portion shows uplift rates greater than 12.07 mm/yr. The average vertical deformation rate is –1.060 mm/yr, with a median of 0.136 mm/yr and a standard deviation of 5.904 mm/yr. These results suggest that the surface deformation of the QTEC generally falls within the expected data range, with most areas exhibiting slight uplift or stability, and a few areas experiencing significant uplift or subsidence. However, the settlement rate in subsiding areas is relatively high and warrants close attention, especially near permafrost engineering sites. Excessive vertical settlement can severely impact the normal operation of roads and may even cause traffic accidents.
4.3. Applicability analysis of one-dimensional line-of-sight deformation
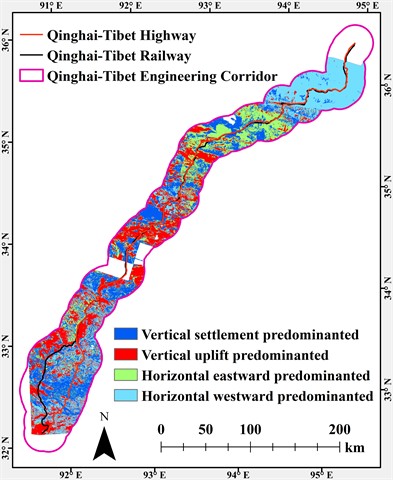
Fig. 8 illustrates the spatial distribution characteristics of surface deformation types in the permafrost region of the QTEC. Based on the results of two-dimensional deformation decomposition, surface deformation in the study area can be classified into four typical types: vertical subsidence, vertical uplift, horizontal eastward displacement, and horizontal westward displacement (Fig. 8(a)).
Fig. 8Surface deformation along engineering corridors: a) deformation types; b) applicability of individual ascending- and descending-orbit line-of-sight measurements; and c) spatial distribution and statistical characteristics of the deformation types
a) Spatial distribution of deformation types
b) Spatial distribution of applicability
c) Statistics of different deformation types
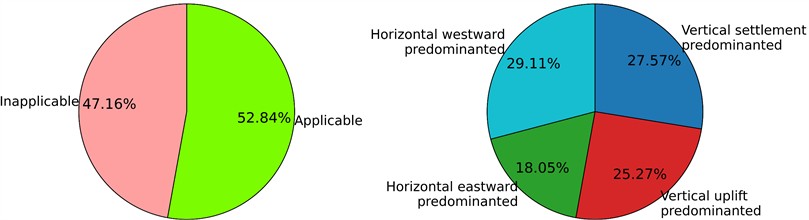
Among these (Fig. 8(a) and (c)), the area dominated by horizontal westward displacement accounts for the largest proportion of the total area, at 29.11 %, indicating that the permafrost active layer and shallow surface in the study area exhibit strong spatial heterogeneity and directional characteristics in lateral deformation. The second largest area is dominated by vertical settlement, comprising 27.57 %, which reflects the widespread occurrence of freeze-thaw settlement processes along the engineering corridor amid long-term permafrost degradation. Areas dominated by vertical uplift account for 25.27 %, likely related to seasonal frost heave, groundwater recharge, and changes in surface thermal conditions. The proportion of areas characterized mainly by horizontal eastward displacement is relatively small, at 18.05 % (Fig. 8(b) and (c)). Spatially, regions with significant horizontal westward movement are primarily concentrated north of Xidatan, where the terrain is undulating, and surface runoff is well-developed. The frozen soil structure is strongly influenced by slope orientation, making it susceptible to lateral deformation along the slope under the combined effects of gravity and freeze-thaw cycles. Areas dominated by horizontal eastward displacement are mainly distributed around north Xidatan to Salt Lake, near Wudaoliang, and in some scattered patches. These areas are often affected by converging surface water, uneven frozen soil thawing, and local engineering disturbances, resulting in pronounced directional horizontal surface migration.
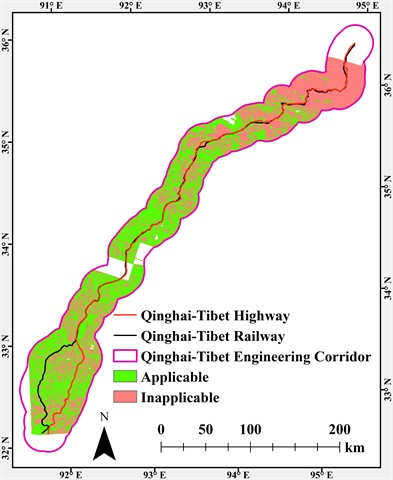
Furthermore, relying solely on a single ascending or descending LOS deformation rate to identify surface subsidence or uplift processes significantly limits applicability in areas with substantial horizontal displacement components, as demonstrated by the spatial distribution results in Fig. 8(b). Statistical analysis indicates that only 52.84 % of the total area can reasonably reflect the vertical deformation characteristics of the surface based on a single LOS observation, while the unsuitable area accounts for as much as 47.16 %, nearly half of the study area. These unsuitable areas are primarily concentrated in the northern part of Xidatan and along the Xidatan to Salt Lake to Wudaoliang region, with a significant amount of horizontal deformation present. These zones exhibit pronounced terrain slope variations, significant spatial differences in permafrost degradation, intense surface runoff development, and a considerable proportion of horizontal displacement within the overall deformation field. In such regions, LOS observations often include substantial horizontal motion components. Directly interpreting these measurements as vertical settlement or uplift can lead to overestimation or misinterpretation of deformation magnitude, thereby affecting assessments of permafrost degradation rates and engineering risk evaluations.
Therefore, in the context of complex terrain and heterogeneous freeze-thaw effects in permafrost regions, relying exclusively on single-orbit InSAR observations is insufficient to fully characterize actual surface motion patterns. It is thus essential to perform multi-dimensional deformation field reconstruction through joint inversion of ascending and descending orbits, and ideally to obtain three-dimensional deformation components – east-west, north-south, and vertical. The optimal approach involves joint MT-InSAR analysis using data from multiple satellite platforms, which holds great potential for future applications based on NISAR satellite data. This methodology will enable accurate characterization of dynamic processes in permafrost regions and their impacts on the stability of engineering structures.
4.4. Analysis of differences among InSAR measurements under different types of deformation
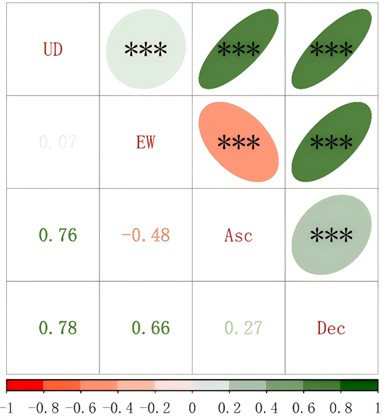
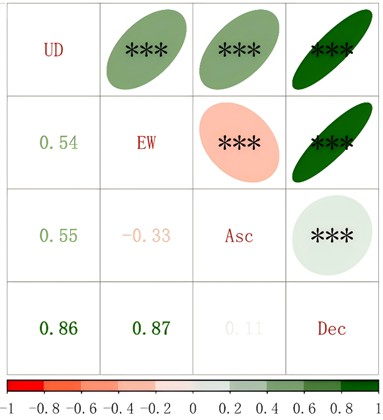
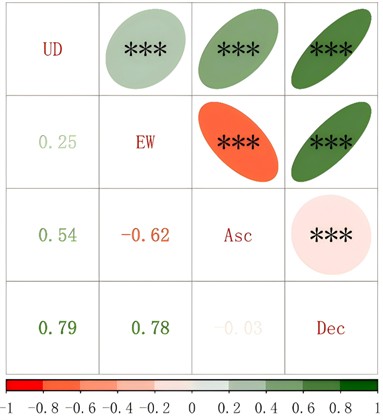
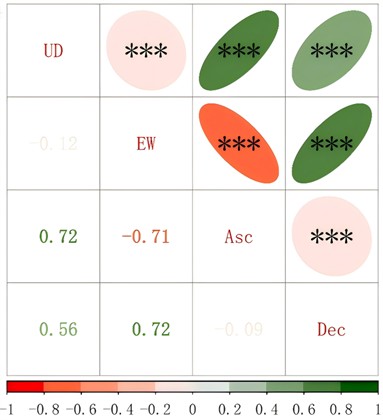
To further understand the surface deformation characteristics of the permafrost region within the QTEC, this study analyzes the differences and correlations among InSAR measurement results across various deformation types and quantitatively characterizes the distinctions among different InSAR deformation monitoring outcomes. Pearson product-moment correlation was used. The results are presented in Fig. 9, where the magnitude of the correlation coefficients is indicated by different colors, and the diagonal line represents each deformation rate type. The numbers in the lower triangular matrix denote the correlation coefficients between the two deformation rate types corresponding to the row and column positions (aligned with the diagonal), with the color of each number reflecting the correlation magnitude interval. The ellipses in the upper triangular matrix provide an alternative visualization of the correlation coefficients: their eccentricity corresponds to the absolute value of the correlation coefficient, the orientation of the long axis indicates the correlation direction (northeast-southwest for positive correlation; northwest-southeast for negative correlation), and asterisks denote the significance level. Three asterisks indicate 0.01, representing a highly significant correlation.
Fig. 9Correlations between ascending- and descending-orbit InSAR line-of-sight measurements in areas dominated by a) vertical subsidence, b) vertical uplift, c) westward horizontal displacement, and d) eastward horizontal displacement
a) Vertical subsidence dominated
b) Vertical uplift dominated
c) Westward horizontal dominated
d) Eastward horizontal dominated
Fig. 9 shows that in regions dominated by different types of deformation, there is a significant correlation between the four deformation-rate variables, all of which pass the significance test ( 0.01). The correlation between vertical deformation and ascending or descending orbit deformation exceeds 0.54, indicating a strong positive relationship. This suggests that using only the 1-D LOS deformation rate from either the ascending or descending orbit can partially represent the vertical deformation of the land surface. However, the correlation with E-W deformation differs significantly. In areas dominated by vertical settlement, the correlation coefficient is only 0.07, indicating a weak relationship. In regions dominated by horizontal eastward displacement, vertical deformation is negatively correlated with a coefficient of –0.12, demonstrating no strong spatial relationship between vertical and E-W deformation at the same surface location. Regarding E-W deformation, there is a negative correlation with LOS deformation from the ascending orbit, with correlation coefficients ranging from –0.33 to –0.71, while the correlation coefficients with descending orbit LOS deformation are all greater than 0.66, indicating a positive correlation. This suggests that, compared to ascending orbit deformation rates, InSAR monitoring results based on descending orbit SAR data better characterize the true horizontal east-west displacement of the surface. The correlation between ascending and descending orbit results is low, with a maximum correlation coefficient of only 0.27. It is positively correlated in regions dominated by vertical deformation but negatively correlated in regions dominated by horizontal east-west displacement.
Specifically, in the region dominated by vertical subsidence (Fig. 9(a)), there is a strong positive correlation between the vertical deformation rate and the LOS deformation rate during the same period for both ascending and descending orbits, with correlation coefficients of 0.76 and 0.78, respectively. This indicates that the surface subsidence can be effectively characterized using only a single LOS deformation rate. The correlation coefficient between vertical deformation and east-west deformation is only 0.07, suggesting that in areas dominated by settlement, the influence of horizontal east-west displacement is minimal. In this context, the true east-west displacement can be represented by the LOS deformation rate from the descending orbit, with a correlation coefficient of 0.66, whereas the correlation with the LOS deformation rate from the ascending orbit is less than 0.5 and negatively correlated. Furthermore, the correlation between the LOS deformation rates of ascending and descending orbits is low, at only 0.27, indicating the complexity of actual surface deformation. This also indirectly implies that significant discrepancies arise when comparing LOS deformation results based solely on either ascending or descending orbits, as the two show almost no correlation.
In the area dominated by vertical uplift (Fig. 9(b)), compared to the area dominated by vertical subsidence, the correlation between the vertical deformation rate and the LOS deformation results from the ascending orbit has decreased, with a correlation coefficient of 0.55. In contrast, the correlation coefficient with the descending orbit deformation rate is 0.86. This indicates that descending orbit SAR data is more suitable for monitoring surface deformation in this category, although results based on ascending orbit SAR data can still partially reflect vertical surface uplift. The correlation with the E-W deformation rate is 0.54, suggesting significant horizontal surface displacement during uplift. This horizontal displacement rate can be characterized by LOS results from the descending orbit, with a correlation coefficient of 0.87. However, the overall correlation coefficient between the ascending and descending LOS results is only 0.11.
In the region dominated by horizontal westward displacement (Fig. 9(c)), there is a strong correlation between the deformation rate and the LOS deformation rate from the descending orbit, with a correlation coefficient of 0.78. In contrast, the correlation coefficient with the ascending orbit result is –0.62. The positive or negative correlation reflects the applicability and accuracy of the method used to determine the type of surface deformation. At this point, either single-orbit LOS measurement responds strongly to horizontal displacement but should not be directly interpreted as vertical uplift or subsidence. The correlation coefficients between the vertical displacement rate and the LOS results from the ascending and descending orbits are 0.54 and 0.79, respectively, while the correlation with the E-W deformation rate is only 0.25. Additionally, the overall correlation between the deformation results from the ascending and descending orbits is very low, with a correlation coefficient of –0.03.
In the region dominated by horizontal eastward displacement (Fig. 9(d)), the horizontal displacement rate shows a strong correlation with the LOS deformation results from both ascending and descending orbits, with correlation coefficients of –0.71 and 0.72, respectively. In contrast, the correlation with the vertical deformation rate is much weaker, at only –0.12. The correlation coefficients between the vertical deformation rate and the LOS deformation rates for the ascending and descending orbits are 0.72 and 0.56, respectively. This suggests that a single ascending or descending LOS result responds to horizontal movement but should not be directly interpreted as vertical uplift or subsidence. The correlation between vertical and E-W deformation is very low. Additionally, the overall correlation coefficient between the ascending and descending orbits remains very low, at only –0.09, indicating a weak correlation between the two and suggesting that they represent heterogeneous source monitoring results.
These findings refine previous InSAR studies in the QTEC and surrounding permafrost regions, which commonly focused on LOS or vertical deformation [25, 36]. Such interpretations remain useful in vertically dominated areas, which account for 52.84 % of the present study area. However, horizontally dominated deformation accounts for 47.16 %, showing that direct LOS-to-vertical interpretation may be unreliable across a substantial part of the corridor. Field observations of a QTP thaw slump have documented shallow slope creep under annual freeze-thaw cycles [47], and a recent InSAR study revealed downslope solifluction associated with permafrost degradation in the northeastern QTP [48]. Consistent with these studies, gravity-driven slope creep under freeze-thaw cycling may contribute to the horizontal movements observed in areas with complex terrain. Hydrological redistribution and local engineering disturbance may also contribute and should be assessed further using field observations and higher-resolution topographic data.
5. Conclusions
1) The ascending-orbit 1-D LOS deformation rates within the engineering corridor from 25 February 2017 to 31 March 2022 range from -26.511 mm/yr to 18.367 mm/yr, with an average of –0.191 mm/yr and a median of 0.671 mm/yr, indicating an overall uplift trend, although significant settlement is observed in certain areas. The descending-orbit LOS deformation rates range from –26.029 mm/yr to 24.251 mm/yr, with an average of –1.286 mm/yr and a median of –0.790 mm/yr, indicating an overall settlement trend.
2) For the two-dimensional deformation results, the UD deformation rate of the QTEC surface primarily ranged from –27.068 to 18.586 mm/yr, with an average of –1.060 mm/yr and a median of 0.136 mm/yr. These values indicate that the corridor is generally close to vertically stable, although localized subsidence and uplift are evident. The E-W deformation rate ranged from –21.954 mm/yr to 24.814 mm/yr, with an average of –0.969 mm/yr and a median of -0.718 mm/yr. Because both statistics are negative, most areas of the engineering corridor show a slight overall westward displacement tendency, although localized eastward movement is evident.
3) Large areas within the QTEC exhibit significant horizontal displacement, accounting for 47.16 % of the total area. In these areas, relying solely on a single LOS measurement to characterize surface deformation as uplift or subsidence is inappropriate. The remaining 52.84 % is dominated by vertical deformation, including 27.57 % vertical subsidence and 25.27 % vertical uplift. Therefore, when using InSAR technology to monitor surface deformation in the QTEC, integrating multi-source SAR data for multi-dimensional deformation decomposition is recommended.
4) The LOS deformation observed from a single ascending or descending orbit can partially characterize actual surface deformation, with correlations generally below 0.8. The ascending and descending LOS results should be treated as complementary monitoring sources because their correlations are low. Joint two-dimensional inversion reduces the risk of LOS misinterpretation, although the assumption of negligible north-south motion remains a limitation.
References
-
B. K. Biskaborn et al., “Permafrost is warming at a global scale,” Nature Communications, Vol. 10, No. 1, p. 264, Jan. 2019, https://doi.org/10.1038/s41467-018-08240-4
-
Q. Du et al., “Bibliometric analysis of the permafrost research: developments, impacts, and trends,” Remote Sensing, Vol. 15, No. 1, p. 234, Jan. 2022, https://doi.org/10.3390/rs15010234
-
B. Cao, T. Zhang, Q. Wu, Y. Sheng, L. Zhao, and D. Zou, “Brief communication: evaluation and inter-comparisons of Qinghai-Tibet Plateau permafrost maps based on a new inventory of field evidence,” The Cryosphere, Vol. 13, No. 2, pp. 511–519, Feb. 2019, https://doi.org/10.5194/tc-13-511-2019
-
D. Zou et al., “A new map of permafrost distribution on the Tibetan Plateau,” The Cryosphere, Vol. 11, No. 6, pp. 2527–2542, Nov. 2017, https://doi.org/10.5194/tc-11-2527-2017
-
X. Cao et al., “Climate change threatens water resources over the Qinghai-Tibetan plateau,” Scientific Reports, Vol. 15, No. 1, p. 21996, Jul. 2025, https://doi.org/10.1038/s41598-025-05925-x
-
M. Chai, Y. Mu, J. Zhang, W. Ma, G. Liu, and J. Chen, “Characteristics of asphalt pavement damage in degrading permafrost regions: case study of the Qinghai-Tibet Highway, China,” Journal of Cold Regions Engineering, Vol. 32, No. 2, p. 05018003, Jun. 2018, https://doi.org/10.1061/(asce)cr.1943-5495.0000165
-
G. Li, W. Ma, D. Chen, and Q. Du, “Engineering distresses along the major permafrost engineering on the Qinghai-Tibetan Plateau,” in Cold Regions Engineering 2024, pp. 60–66, May 2024, https://doi.org/10.1061/9780784485460.006
-
Y. Yang et al., “The Qinghai-Tibet Plateau: climate change, human activity, and plant diversity,” Plant Diversity, Vol. 47, No. 6, pp. 852–865, Nov. 2025, https://doi.org/10.1016/j.pld.2025.10.007
-
F. Zhou, M. Yao, X. Fan, G. Yin, X. Meng, and Z. Lin, “Evidence of warming from long-term records of climate and permafrost in the hinterland of the Qinghai-Tibet Plateau,” Frontiers in Environmental Science, Vol. 10, Feb. 2022, https://doi.org/10.3389/fenvs.2022.836085
-
H. Deng, Z. Zhang, and Y. Wu, “Accelerated permafrost degradation in thermokarst landforms in Qilian Mountains from 2007 to 2020 observed by SBAS-InSAR,” Ecological Indicators, Vol. 159, p. 111724, Feb. 2024, https://doi.org/10.1016/j.ecolind.2024.111724
-
B. Hu et al., “Monitoring the thaw slump-derived thermokarst in the Qinghai-Tibet Plateau using satellite SAR interferometry,” Journal of Sensors, Vol. 2019, pp. 1–8, Apr. 2019, https://doi.org/10.1155/2019/1698432
-
M. Mu et al., “Thermokarst lake changes along the Qinghai-Tibet Highway during 1991-2020,” Geomorphology, Vol. 441, p. 108895, Sep. 2023, https://doi.org/10.1016/j.geomorph.2023.108895
-
J. Chen et al., “Activity and kinematics of two adjacent freeze-thaw-related landslides revealed by multisource remote sensing of Qilian Mountain,” Remote Sensing, Vol. 14, No. 19, p. 5059, Oct. 2022, https://doi.org/10.3390/rs14195059
-
Q. Du et al., “Preliminary study on InSAR-based uplift or subsidence monitoring and stability evaluation of ground surface in the permafrost zone of the Qinghai-Tibet Engineering Corridor, China,” Remote Sensing, Vol. 15, No. 15, p. 3728, Jul. 2023, https://doi.org/10.3390/rs15153728
-
S. Daout, B. Dini, W. Haeberli, M.-P. Doin, and B. Parsons, “Ice loss in the Northeastern Tibetan Plateau permafrost as seen by 16 yr of ESA SAR missions,” Earth and Planetary Science Letters, Vol. 545, p. 116404, Jun. 2020, https://doi.org/10.1016/j.epsl.2020.116404
-
Q. Wu, Y. Sheng, Q. Yu, J. Chen, and W. Ma, “Engineering in the rugged permafrost terrain on the roof of the world under a warming climate,” Permafrost and Periglacial Processes, Vol. 31, No. 3, pp. 417–428, May 2020, https://doi.org/10.1002/ppp.2059
-
Y. Miao, T. Dai, X. Yang, and J. Song, “Landscape fragmentation associated with the Qingzang Highway and its influencing factors-a comparison study on road sections and buffers,” Geography and Sustainability, Vol. 2, No. 1, pp. 59–67, 2021, https://doi.org/10.1016/j.geosus.2021.03.001
-
X.-J. Chai and F.-Q. Jiang, “Deformation characteristics of ventiduct embankment on Qinghai-Tibet Railway,” Journal of Cold Regions Engineering, Vol. 22, No. 4, pp. 124–133, Dec. 2008, https://doi.org/10.1061/(asce)0887-381x(2008)22:4(124)
-
Q. Du, A. Xu, F. Wang, H. Luo, and S. Qi, “Analysis of environmental driving mechanisms for vertical surface deformation in the permafrost section of the Qinghai-Tibet engineering corridor, China,” Journal of Measurements in Engineering, Vol. 14, No. 2, pp. 236–249, Jun. 2026, https://doi.org/10.21595/jme.2025.25486
-
L. M. Farquharson, V. E. Romanovsky, W. L. Cable, D. A. Walker, S. V. Kokelj, and D. Nicolsky, “Climate change drives widespread and rapid thermokarst development in very cold permafrost in the Canadian High Arctic,” Geophysical Research Letters, Vol. 46, No. 12, pp. 6681–6689, Jun. 2019, https://doi.org/10.1029/2019gl082187
-
P. P. Permyakov, A. F. Zhirkov, and M. N. Zheleznyak, “Account for the process of underground condensation in modeling heat and moisture exchange in frozen soils,” Journal of Engineering Physics and Thermophysics, Vol. 94, No. 5, pp. 1232–1241, Sep. 2021, https://doi.org/10.1007/s10891-021-02404-8
-
G.-A. Yin, F.-J. Niu, Z.-J. Lin, J. Luo, and M.-H. Liu, “Data-driven spatiotemporal projections of shallow permafrost based on CMIP6 across the Qinghai-Tibet Plateau at 1 km2 scale,” Advances in Climate Change Research, Vol. 12, No. 6, pp. 814–827, Dec. 2021, https://doi.org/10.1016/j.accre.2021.08.009
-
J. Chen et al., “Magnitudes and patterns of large-scale permafrost ground deformation revealed by Sentinel-1 InSAR on the central Qinghai-Tibet Plateau,” Remote Sensing of Environment, Vol. 268, p. 112778, Nov. 2021, https://doi.org/10.1016/j.rse.2021.112778
-
C. Mu et al., “The status and stability of permafrost carbon on the Tibetan Plateau,” Earth-science Reviews, Vol. 211, p. 103433, Nov. 2020, https://doi.org/10.1016/j.earscirev.2020.103433
-
Z. Zhang, M. Wang, Z. Wu, and X. Liu, “Permafrost deformation monitoring along the Qinghai-Tibet Plateau Engineering Corridor using InSAR observations with multi-sensor SAR datasets from 1997-2018,” Sensors, Vol. 19, No. 23, p. 5306, Dec. 2019, https://doi.org/10.3390/s19235306
-
B. Abrahms et al., “Climate change as a global amplifier of human-wildlife conflict,” Nature Climate Change, Vol. 13, No. 3, pp. 224–234, Mar. 2023, https://doi.org/10.1038/s41558-023-01608-5
-
A. K. Gabriel, R. M. Goldstein, and H. A. Zebker, “Mapping small elevation changes over large areas: differential radar interferometry,” Journal of Geophysical Research: Solid Earth, Vol. 94, No. B7, pp. 9183–9191, Jul. 1989, https://doi.org/10.1029/jb094ib07p09183
-
R. Zhao, Z.-W. Li, G.-C. Feng, Q.-J. Wang, and J. Hu, “Monitoring surface deformation over permafrost with an improved SBAS-InSAR algorithm: with emphasis on climatic factors modeling,” Remote Sensing of Environment, Vol. 184, pp. 276–287, Oct. 2016, https://doi.org/10.1016/j.rse.2016.07.019
-
L. Xu, Q. Chen, J.-J. Zhao, X.-W. Liu, Q. Xu, and Y.-H. Yang, “An integrated approach for mapping three-dimensional coseismic displacement fields from Sentinel-1 TOPS data based on DInSAR, POT, MAI and BOI techniques: application to the 2021 Mw 7.4 Maduo earthquake,” Remote Sensing, Vol. 13, No. 23, p. 4847, Nov. 2021, https://doi.org/10.3390/rs13234847
-
A. Kumar, Manisha, P. Lal, A. Prasad, P. Tripathy, and P. Saikia, “Analyzing urban damage and surface deformation based hazard-risk in Kathmandu city occurred during Nepal earthquake (2015) using SAR interferometry,” Advances in Space Research, Vol. 70, No. 12, pp. 3892–3904, Dec. 2022, https://doi.org/10.1016/j.asr.2022.02.003
-
F. Chen, H. Lin, Z. Li, Q. Chen, and J. Zhou, “Interaction between permafrost and infrastructure along the Qinghai-Tibet Railway detected via jointly analysis of C – and L-band small baseline SAR interferometry,” Remote Sensing of Environment, Vol. 123, pp. 532–540, Aug. 2012, https://doi.org/10.1016/j.rse.2012.04.020
-
Q. Du et al., “Deformation monitoring in an alpine mining area in the Tianshan Mountains based on SBAS-InSAR technology,” Advances in Materials Science and Engineering, Vol. 2021, No. 1, p. 9988017, Apr. 2021, https://doi.org/10.1155/2021/9988017
-
F. Albino, J. Biggs, M. Lazecký, and Y. Maghsoudi, “Routine processing and automatic detection of volcanic ground deformation using Sentinel-1 InSAR data: insights from African volcanoes,” Remote Sensing, Vol. 14, No. 22, p. 5703, Nov. 2022, https://doi.org/10.3390/rs14225703
-
M. Chang, W. Sun, H. Xu, and L. Tang, “Identification and deformation analysis of potential landslides after the Jiuzhaigou earthquake by SBAS-InSAR,” Environmental Science and Pollution Research, Vol. 30, No. 13, pp. 39093–39106, Jan. 2023, https://doi.org/10.1007/s11356-022-25055-5
-
Y.-K. Ding et al., “Monitoring glaciers in the Chenab basin with SBAS InSAR technology,” Journal of Mountain Science, Vol. 19, No. 9, pp. 2622–2633, Sep. 2022, https://doi.org/10.1007/s11629-021-7266-5
-
C. Xie, Z. Li, J. Xu, and X. Li, “Analysis of deformation over permafrost regions of Qinghai-Tibet plateau based on permanent scatterers,” International Journal of Remote Sensing, Vol. 31, No. 8, pp. 1995–2008, 2010, https://doi.org/10.1080/01431160902929255
-
H. S. Jung, Z. Lu, J. S. Won, M. P. Poland, and A. Miklius, “Mapping three-dimensional surface deformation by combining multiple-aperture interferometry and conventional interferometry: application to the June 2007 eruption of Kilauea Volcano, Hawaii,” IEEE Geoscience and Remote Sensing Letters, Vol. 8, No. 1, pp. 34–38, Jul. 2010, https://doi.org/10.1109/lgrs.2010.2051793
-
P. Arora et al., “Updates on Nisar data products by ISRO,” in 2024 IEEE India Geoscience and Remote Sensing Symposium (InGARSS), pp. 1–4, Dec. 2024, https://doi.org/10.1109/ingarss61818.2024.10984376
-
W. Ma, J. Qi, and Q. Wu, “Analysis of the deformation of embankments on the Qinghai-Tibet Railway,” Journal of Geotechnical and Geoenvironmental Engineering, Vol. 134, No. 11, pp. 1645–1654, Nov. 2008, https://doi.org/10.1061/(asce)1090-0241(2008)134:11(1645)
-
M. Lazecký et al., “LiCSAR: an automatic InSAR tool for measuring and monitoring tectonic and volcanic activity,” Remote Sensing, Vol. 12, No. 15, p. 2430, Jul. 2020, https://doi.org/10.3390/rs12152430
-
Y. Morishita, M. Lazecky, T. Wright, J. Weiss, J. Elliott, and A. Hooper, “LiCSBAS: an open-source InSAR time series analysis package integrated with the LiCSAR automated Sentinel-1 InSAR processor,” Remote Sensing, Vol. 12, No. 3, p. 424, Jan. 2020, https://doi.org/10.3390/rs12030424
-
M.-P. Doin et al., “Presentation of the small baseline NSBAS processing chain on a case example: the Etna deformation monitoring from 2003 to 2010 using Envisat data,” in Proceedings of Fringe, 2011.
-
Q. Du, G. Li, T. Che, Y. Mu, and W. Ma, “A dataset of InSAR-derived ground deformation in permafrost zone of the Qinghai-Tibet Engineering Corridor, China (2017-2022),” China Scientific Data, Vol. 10, No. 4, pp. 1–20, Dec. 2025, https://doi.org/10.11922/11-6035.ncdc.2024.0176.zh
-
C. Yu, Z. Li, and N. T. Penna, “Interferometric synthetic aperture radar atmospheric correction using a GPS-based iterative tropospheric decomposition model,” Remote Sensing of Environment, Vol. 204, pp. 109–121, Oct. 2017, https://doi.org/10.1016/j.rse.2017.10.038
-
C. Yu, Z. Li, and N. T. Penna, “Triggered afterslip on the southern Hikurangi subduction interface following the 2016 Kaikōura earthquake from InSAR time series with atmospheric corrections,” Remote Sensing of Environment, Vol. 251, p. 112097, Sep. 2020, https://doi.org/10.1016/j.rse.2020.112097
-
Z. Wang et al., “Integration of ground-based and space-borne radar observations for three-dimensional deformations reconstruction: application to Luanchuan mining area, China,” Geomatics, Natural Hazards and Risk, Vol. 13, No. 1, pp. 2819–2839, Dec. 2022, https://doi.org/10.1080/19475705.2022.2134828
-
Z. Sun, Y. Wang, Y. Sun, F. Niu, Guoyuli, and Z. Gao, “Creep characteristics and process analyses of a thaw slump in the permafrost region of the Qinghai-Tibet Plateau, China,” Geomorphology, Vol. 293, pp. 1–10, May 2017, https://doi.org/10.1016/j.geomorph.2017.04.045
-
H. Watine, S. Daout, J. Lavé, and M.-P. Doin, “Downslope solifluction movements and permafrost degradation in the northeastern Qinghai-Tibetan Plateau revealed by InSAR,” Remote Sensing of Environment, Vol. 329, p. 114926, Aug. 2025, https://doi.org/10.1016/j.rse.2025.114926
About this article

This study was supported by the Science and Technology Program of Xizang Autonomous Region (Grant No. XZ202401ZY0040), the Program of the Gansu Province Science and Technology Foundation for Youths (Grant No. 25JRRA515), the Research Project of the Qinghai Provincial Key Laboratory of Tibet Plateau Highway Construction and Maintenance Technology (Grant No. 2024-JY-D-03), the Science and Technology Program of Gansu Province (Grant No. 23ZDFA017), and the Research Project of the Heilongjiang Provincial Hydraulic Research Institute (Grant No. DT2024B01).
The InSAR-derived ground-deformation dataset analyzed in this study is publicly available through the China Scientific Data publication “A dataset of InSAR-derived ground deformation in permafrost zone of the Qinghai-Tibet Engineering Corridor, China (2017–2022)” [43], https://doi.org/10.11922/11-6035.ncdc.2024.0176.zh (you can access the detailed landing page to download at: https://www.sciengine.com/doi/10.11922/11-6035.ncdc.2024.0176.zh).
Qingsong Du was responsible for data processing, study design, mapping, and manuscript preparation. Qingsong Du, Guoyu Li, Fei Wang, and Shunshun Qi revised the manuscript. Qingsong Du, Anhua Xu, Guoyu Li, and Huimin Luo acquired funding.
The authors declare that they have no conflict of interest.