Abstract
To address challenges associated with the stability assessment and engineering control of buckling failure in steeply inclined rock slopes, this study takes the southern slope of the Longyu Open-Pit Mine as a case study and adopts an integrated approach combining theoretical modeling, field monitoring, and numerical simulation. First, under the assumptions of coordinated deformation and small strain, a differential equation governing the behavior of the surface rock layer is derived. This leads to the formulation of a safety factor defined as the ratio of the critical to the actual slope length. The analysis indicates that the slope remains stable when the thickness of the rock layer exceeds 10 m and the elastic modulus is greater than 32 GPa, thereby establishing a robust mechanical model for buckling failure. Second, based on field monitoring data of displacement and strain, orthogonal testing and factor sensitivity analyses are conducted. The results reveal the following ranking of influential factors: rock layer thickness ( 0.38+39.8 %) is an exceptionally sensitive positive factor; cohesion ( 0.25) is a highly sensitive positive factor; unit weight and groundwater level are significantly sensitive negative factors; whereas the influence of elastic modulus is negligible ( 0.03). These insights provide a clear priority hierarchy for monitoring and stability control measures. Finally, by incorporating real-time rainfall intensity data, FLAC3D simulations demonstrate a strong negative correlation between rainfall intensity and slope stability. Heavy rainfall is identified as a critical threshold triggering stability failure. Under such conditions, the maximum slope displacement increases by 175 %, reaching 5.5 m, and the shear strain increment develops into an arc-shaped sliding surface. The slope interval between 1360-1390 m is identified as the core risk zone, while the interval from 1290-1310 m acts as a key shear outlet. This clarifies the evolutionary pathway and key focus areas for preventing rainfall-induced instability. The findings of this study offer a solid theoretical foundation and practical technical support for the monitoring, risk warning, and engineering management of similar steeply inclined slopes.
Highlights
- Under coordinated deformation and small strain, a governing equation is derived. Safety factor is defined as critical-to-actual slope length ratio. The slope is stable when rock layer thickness > 10 m and elastic modulus > 32 GPa.
- Factor sensitivity ranking: rock layer thickness (R = 0.38, +39.8%) and cohesion (R = 0.25) are positive factors; unit weight and groundwater level are negative; elastic modulus is negligible (R = 0.03).
- FLAC3D simulations show strong negative correlation between rainfall intensity and slope stability. Heavy rainfall triggers failure, increasing displacement by 175% to 5.5 m, with an arc-shaped sliding surface.
1. Introduction
Slope stability in open-pit mines is a critical issue in mining safety, particularly for high and steep slopes composed of steeply dipping rock strata. These slopes often exhibit complex instability modes and are influenced by diverse triggering factors, frequently leading to major engineering disasters. In recent years, with the increasing depth and scale of open-pit mining, issues such as buckling failure in steeply inclined rock slopes and rainfall-induced instability have become more prominent. Key scientific challenges in both engineering practice and academic research include: (1) understanding the deformation coordination characteristics of surface rock strata, (2) elucidating the sensitivity mechanisms under multi-factor coupling, and (3) quantifying the relationship between rainfall intensity and the evolution of slope instability. A systematic investigation of these issues holds significant theoretical and applied value for advancing slope stability evaluation theories and optimizing engineering prevention and control strategies.
In terms of modeling approaches, Qu et al. [1] investigated fractured rock slopes using a numerical manifold method (NMM) based on a seepage-deformation coupling model. Through validation with case studies and collapse simulations, they analyzed the coupled effects of groundwater flow, seepage pressure, and rock deformation. Their findings confirmed the effectiveness of the proposed model, demonstrated that excessive hydraulic pressure can induce vertical fracture opening, increased deformation, and eventual failure, and highlighted the model’s potential for large-scale engineering applications. Guo et al. [2] developed a finite element stability analysis model for unsaturated slope seepage, proposing a fluid-solid coupling-based stability analysis method and conducting sensitivity analyses of unsaturated seepage parameters. Their work clarified the direct effects of unsaturated parameters on slope stability and their coupled interaction mechanisms. Xu et al. [3] established a rock elastoplastic damage-seepage coupling model based on the Mohr-Coulomb criterion. They derived a stress return algorithm to address the singularity problem under damage effects, developed a coupled finite element program, and integrated it with the centrifugal loading method to evaluate the slope safety factor under multi-field coupling. The model was shown to effectively characterize macroscopic rock failure under combined stress, seepage, and damage. Liu et al. [4] addressed limitations in hydraulic analysis models that fail to account for the superposition of low stress levels and hydraulic actions. Their study on the stability of bimodal slopes revealed that hydrostatic pressure on fracture surfaces and uplift pressure at the bedrock-overburden interface significantly influence stability. The stability coefficient decreases by 31.8 % under superposition effects, and neglecting strength parameters of stress zones may lead to overestimated stability. Wang et al. [5] combined laboratory direct shear tests with numerical simulations to examine the macro- and meso-scale shear behavior of non-persistent jointed rock masses under varying joint apertures, connectivity, and normal stresses. The shear stress-displacement curves exhibited distinct peak and post-peak behaviors, including compaction, crack propagation, post-peak failure, and residual friction. Based on curve morphology, three types were classified: pre-peak ascending & post-peak climbing (Type I), pre-peak ascending & post-peak stepped (Type II), and pre-peak stepped & post-peak climbing (Type III). Huang et al. [6] focused on coal seam group mining, where cyclic mining alters coal-rock permeability and restricts gas extraction. Through cyclic loading-unloading permeability tests on fractured sandstone with various dip angles, they revealed an evolution pattern of “attenuation-slow increase-sudden increase” in permeability. Within individual cycles, the permeability change transitions from “decrease-increase-decrease” to “increase-increase-decrease” during the loading-unloading-stress recovery phase.
Regarding the influence of environmental factors on slope stability, Zhou et al. [7] used Geo-Studio to analyze effective stress and pore water pressure in unsaturated soil slopes under seepage-stress coupling. They evaluated the effects of different rainfall intensities, durations, and types, finding that coupling accelerates the rise of surface pore water pressure and dissipation of matric suction, thereby reducing soil strength. The coupled analysis yielded lower safety factors than uncoupled analyses, with front-type rainfall causing the most rapid decline, followed by uniform and rear-type rainfall. Wang et al. [8], based on unsaturated soil theory, designed four numerical cases considering rainfall intensity and permeability coefficient. Geo-Studio simulations showed that matric suction benefits slope stability and neglecting it leads to significant underestimation. Rainfall intensity has a minor effect on low-permeability models but strongly affects high-permeability ones, with stress concentration typically occurring at the slope crest and toe where strength is lower. Guo et al. [9] investigated typhoon- and rainstorm-induced landslides in residual soil slopes of northern Fujian. They found that rainfall most strongly affects the surface soil layer, with deeper infiltration responding more slowly. Infiltration is initially dominated by vertical surface flow but transitions to deeper vertical flow later. Landslide areas are elliptical, with arc-shaped sliding surfaces extending from crown to toe. Hong et al. [10] studied rainfall infiltration under unsaturated conditions at a spoil dump in Yunnan. They found that rainfall intensity has little initial effect on the safety factor. After 6 h, surface pore water pressure and saturation increase, forming a transient saturated zone; greater rainfall accelerates safety factors decline. After 12 h, the surface layer becomes nearly saturated, forming surface runoff, with matric suction decreasing. In the later stage, permeability and matric suction stabilize, and the safety factor decline rate levels off, suggesting marginal stability. Wang et al. [11] analyzed saturated-unsaturated slope stability in heap leaching fields under sprayed solution action using Geo-Studio. The safety factor decreases with heap height, and a height of 120 m meets acceptable safety criteria. Sprayed solutions create a downward seepage field that reaches the base after ~35 days. Increasing heap height reduces the impact of solutions on some materials. Peng et al. [12] investigated the right bank slope of the Simashan Flood Diversion Project and concluded that water seepage and softening are key factors inducing landslides.
In studies focusing on slope stability under specific engineering contexts, Yang et al. [13] analyzed the Fushun West Open-Pit Mine using Geo-Studio. The limit equilibrium method combined with steady-state seepage simulation identified potential sliding risks in localized weak interlayers or seepage-concentrated zones, recommending seepage control and reinforcement. Wang [14] assessed the south-end slope of an open-pit coal mine. SEEP/W modeled groundwater seepage under mining disturbance, and Slope/W evaluated stability. Results showed that stability declines under the combined influence of mining and groundwater, with groundwater playing a dominant role. This influence remains stable with depth but increases with slope angle. Yang et al. [15] studied the slope of the Huangshan Limestone Mine in Sichuan, investigating the impact of weak interlayer parameters on stability under fluid-solid coupling. Results indicated that greater interlayer thickness or cohesion does not necessarily improve stability, whereas smaller dip angles and higher friction angles enhance stability. F. Wang et al. [16] modeled a manganese mine in Guizhou using Rhino-FLAC3D to simulate mining stages, analyzing displacement, stress, and plastic zone evolution to reveal the impact of adjacent shaft mining on shaft structure stability. S. Liu et al. [17] examined sliding surface characteristics of backfill behind rigid retaining walls (TT model). Model tests and numerical simulations explored the influence of aspect ratio and friction angle on surface morphology. He et al. [18] investigated rainy-season instability of a soft-interlayered slope in Zhejiang. A seepage-stress coupling model combined with strength reduction revealed rainfall as the dominant factor, with soft interlayers accelerating shallow saturation. A prestressed anchor framework was proposed and validated in situ, offering reliable guidance for similar scenarios. Huang et al. [19] addressed tunnel resilience post-earthquake, emphasizing restoration quantification over vulnerability. Via expert surveys, they developed probabilistic damage-level models for traffic and structural capacity restoration, creating deterministic and scalable probabilistic models. Case studies confirmed their precision for infrastructure resilience assessment. Zhang et al. [20] investigated rainfall infiltration in open-pit rock slopes considering spatially heterogeneous saturated hydraulic conductivity. Using unsaturated seepage and random field theories, they modified parameter models via FISH scripting and stochastic methods, developing a saturated-unsaturated seepage random field model. This systematically analyzed how rainfall intensity, duration, and hydraulic conductivity variability affect infiltration and slope stability. Results showed that rainfall mainly impacts shallow seepage, with distinct effects on infiltration depth and safety factor. When rainfall intensity exceeds infiltration capacity, conductivity variability sensitivity increases, aiding risk assessment for rainfall-induced geological hazards.
This study focuses on the southern slope of the Longyu Large Open-Pit Mine. A systematic investigation is conducted using theoretical modeling, experimental analysis, and numerical simulation to address key challenges in the stability assessment and engineering control of buckling failure in steeply inclined rock slopes.
2. Mechanical model and safety factor derivation for slope buckling failure
2.1. Failure characteristics and mechanical model generalization of the slope
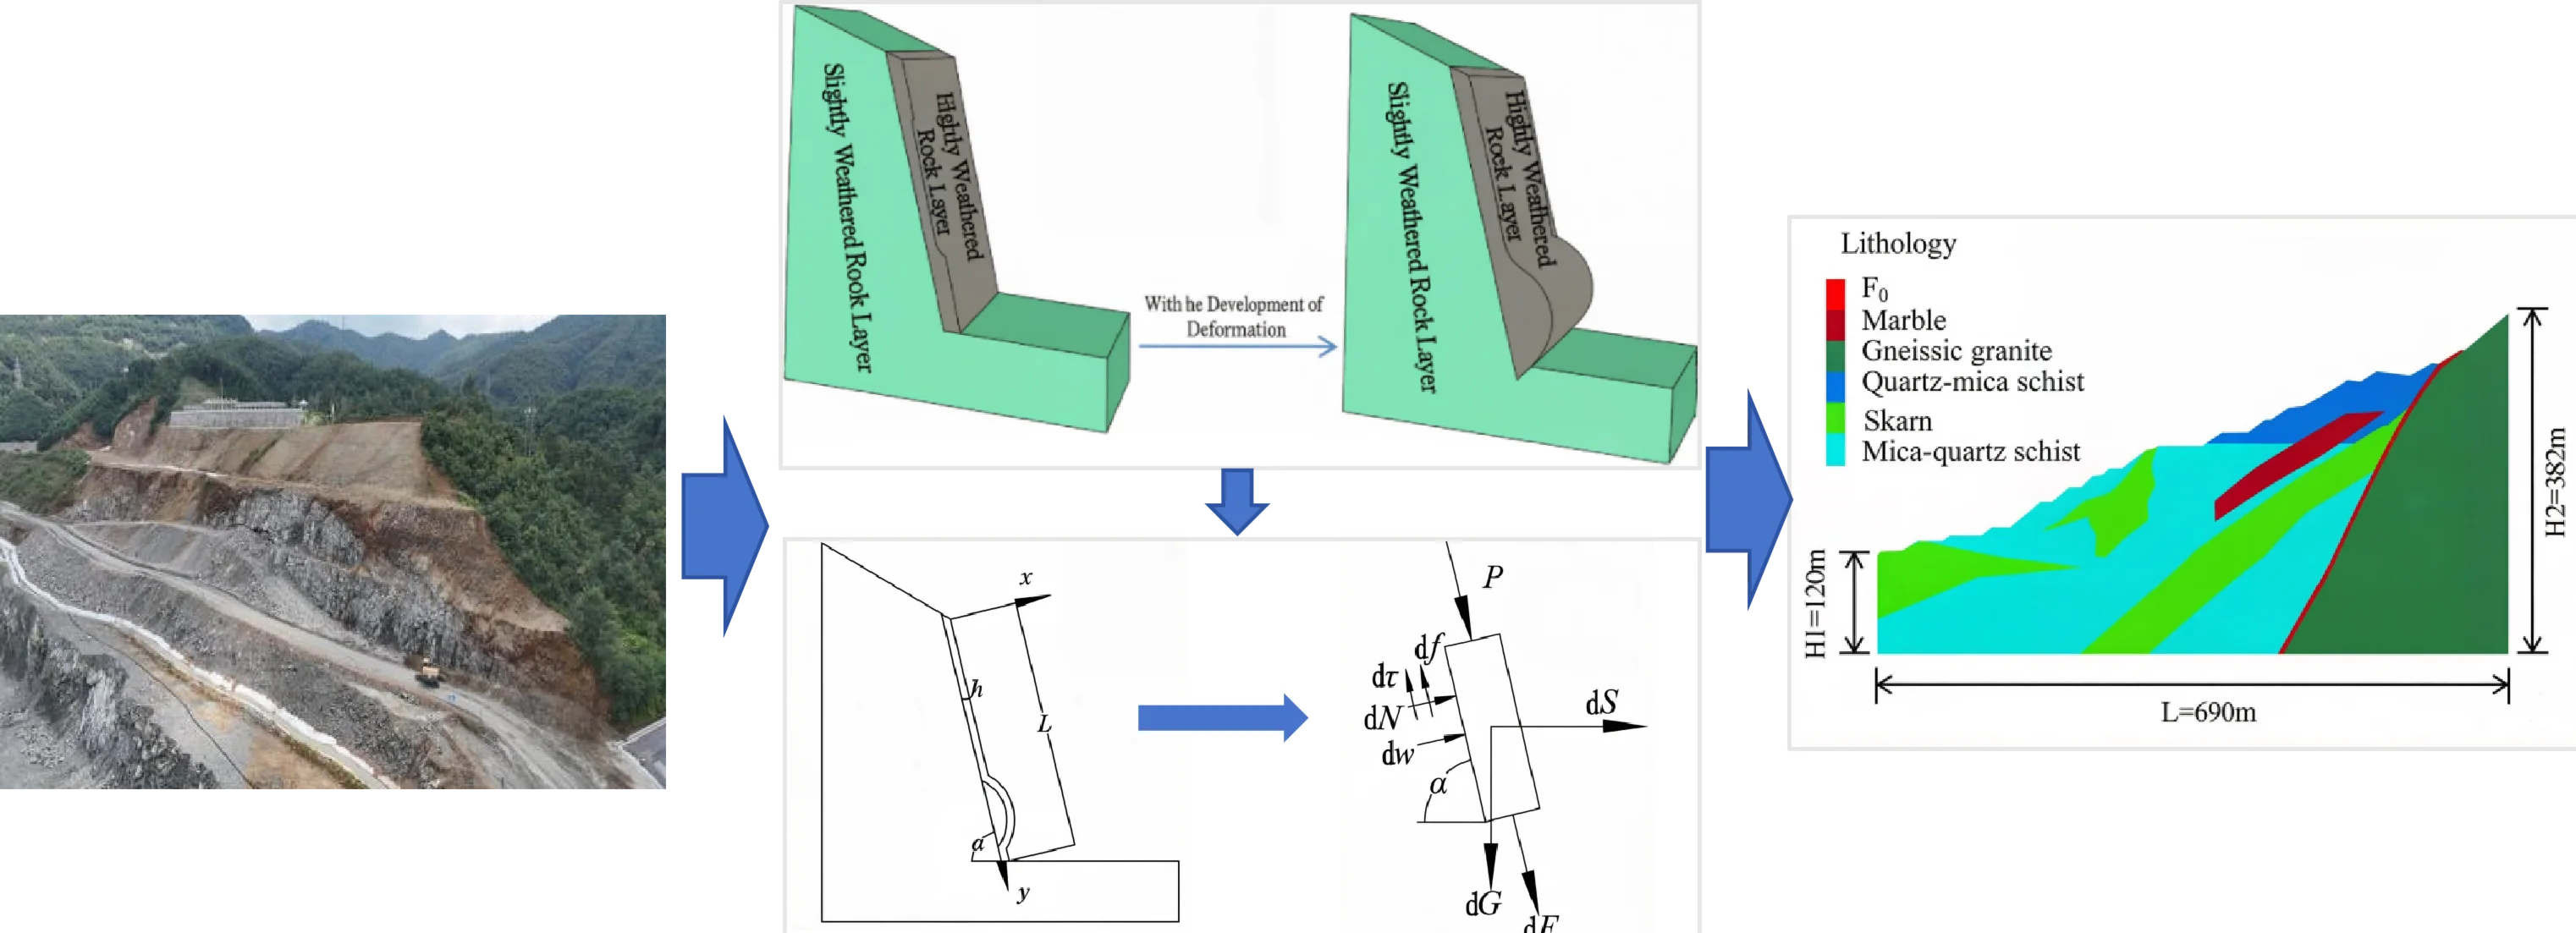
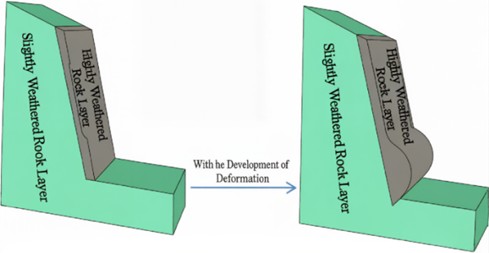
Field investigations indicate that the southern slope is a steeply inclined rock mass with a dip angle ranging from 72° to 80°. The failure mechanism exhibits typical buckling characteristics (Fig. 1): initial bending deformation occurs at the slope toe, leading to tensile fissures at the arc crown. As deformation progresses, these cracks propagate along the rock stratum strike. Ultimately, the slope fails via bending-shear instability governed by the tensile and shear strength of the fractures.
Fig. 1Diagram of slope failure modes
2.2. Differential equation for surface rock layers
A generalized mechanical model of the southern slope is established (Fig. 2) under the following assumptions:
(1) Compatibility exists in the bending deformation of steeply inclined rock layers, ensuring consistent interlayer deformation.
(2) The sliding segment’s action on the bending segment is simplified as a concentrated force.
(3) Post-deformation, the bending segment loses contact with the sliding surface, and deformations satisfy small-deformation conditions.
(4) The slope crest (at ) is a free end, while the slope toe (at ) is fixed.
Fig. 3 illustrates the micro-element force analysis of the surface rock layer.
Fig. 2Generalized mechanical model diagram of the slope
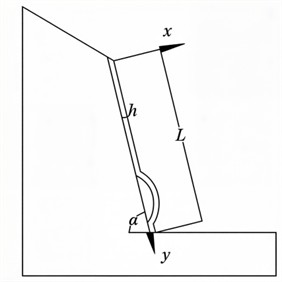
Fig. 3Micro-element force analysis diagram of slab-beam in surface rock layer of the slope
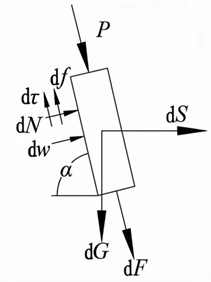
Buckling failure typically initiates from the surface layer. As shown in Fig. 4, key forces include: frost heaving force ; hydrostatic pressure ; slope mass self-weight ; seismic inertia force ; normal force ; interlayer friction ; cohesion ; and downslope load . The downslope load is derived by integrating the contributions of external forces:
where: , , , , .
Here, is the slope angle; denotes the unit weight of rock mass (kN/m³); and represent the width and thickness of the rock mass (m), respectively; is the horizontal seismic coefficient; and are the internal friction angle (°) and cohesion (kPa) of the weak layer; is the unit weight of water (kN/m3); and is the groundwater table height (m).
The term incorporates pore water pressure effects, including uplift pressure on the sliding surface and the downslope component of seepage force. These are equivalently transformed into the downslope load to comprehensively capture groundwater impacts.
The total bending moment of the bending segment comprises two components: an additional moment from friction and cohesion, and a moment from hydrostatic pressure:
The deflection function satisfies the boundary conditions ( at and ):
where is the wave number, is the amplitude (m), and is the slope length (m).
2.3. Safety factor derivation based on energy balance
According to the energy balance principle, the deformation energy equals the work done by the downslope load and the freeze-thaw load :
where:
where, is the flexural rigidity (kN·m2), with as the elastic modulus (GPa) and as the cross-sectional moment of inertia (m4).
Substituting the deflection function and considering field observations (deformation pattern of one-and-a-half waves), the critical slope length for 2 is:
The adoption of 2 (full sine wave) simplifies the energy balance approach. Although field observations suggest 1.5 waves, comparisons show that using 1.5 yields a critical length 1.12 times that of 2, with a safety factor increase of 8.3 %. Both trends align within acceptable engineering error margins (±10 %). The 2 model is retained for its analytical tractability and accurate representation of stability mechanisms.
The safety factor is defined as the ratio of the critical slope length to the actual slope length :
3. Sensitivity analysis of factors influencing slope stability
3.1. Project overview
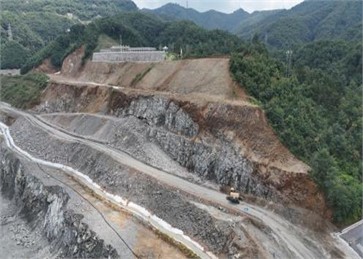
The southern slope of the Longyu Open-Pit Mine strikes approximately 171° and dips northward. The slope toe comprises a mine haul road, exhibiting a two-level stepped morphology with elevations ranging from 1365 m to 1405 m. The slope body is generally higher in the south and lower in the north, with the central portion elevated relative to both sides. The slope height is approximately 60 m. No distinct sliding surface has been identified within the bedrock portion of the slope; however, the bedrock rock mass is relatively fragmented, posing a potential risk of loosening and instability.
Fig. 4Real scene of southern slope failure. Photo by Jia Haipeng in May 2024 on the south slope of the Longyu Large Open-Pit Mine
3.2. Multi-factor analysis
To address the stability concerns of the target slope, seven sensitivity factors were selected based on prior research: slope angle (), elastic modulus (), rock layer thickness (), unit weight (), internal friction angle of the weak layer (), cohesion of the weak layer (), and groundwater level (). Each factor was assigned three levels, and interactions between factors were disregarded. An orthogonal experimental design was implemented using the . orthogonal array. The specific factor levels are detailed in Table 1, and the experimental design is summarized in Table 2.
Table 1Factor levels of the slope
Level | (°) | (GPa) | (m) | (kN/m3) | (°) | (kPa) | (m) |
1 | 60 | 35 | 10 | 20 | 20 | 13 | 0 |
2 | 65 | 40 | 15 | 25 | 25 | 18 | 8 |
3 | 70 | 45 | 20 | 30 | 30 | 23 | 15 |
Table 2Orthogonal experimental scheme
Test number | (°) | (GPa) | (m) | (kN/m3) | (°) | (kPa) | (m) | Factor of safety |
1 | 60 | 35 | 10 | 20 | 20 | 13 | 0 | 1.581 |
2 | 60 | 40 | 15 | 25 | 25 | 18 | 8 | 1.265 |
3 | 60 | 45 | 20 | 30 | 30 | 23 | 15 | 1.137 |
4 | 65 | 35 | 10 | 25 | 25 | 23 | 15 | 1.156 |
5 | 65 | 40 | 15 | 30 | 30 | 13 | 0 | 1.125 |
6 | 65 | 45 | 20 | 20 | 20 | 18 | 8 | 0.994 |
7 | 70 | 35 | 15 | 20 | 30 | 18 | 15 | 1.027 |
8 | 70 | 40 | 20 | 25 | 20 | 23 | 0 | 1.071 |
9 | 70 | 45 | 10 | 30 | 25 | 13 | 8 | 1.466 |
10 | 60 | 35 | 20 | 30 | 25 | 18 | 0 | 1.339 |
11 | 60 | 40 | 10 | 20 | 30 | 23 | 8 | 1.141 |
12 | 60 | 45 | 15 | 25 | 20 | 13 | 15 | 1.236 |
13 | 65 | 35 | 15 | 30 | 20 | 23 | 8 | 1.142 |
14 | 65 | 40 | 20 | 20 | 25 | 13 | 15 | 0.926 |
15 | 65 | 45 | 10 | 25 | 30 | 18 | 0 | 1.653 |
16 | 70 | 35 | 20 | 25 | 30 | 13 | 8 | 1.051 |
17 | 70 | 40 | 10 | 30 | 20 | 18 | 15 | 1.842 |
18 | 70 | 45 | 15 | 20 | 25 | 23 | 0 | 1.004 |
The range analysis method (R method) was employed to quantify the influence of each factor. The results are presented in Table 3.
Table 3Orthogonal experimental results
Level | (°) | (GPa) | (m) | (kN/m3) | (°) | (kPa) | (m) |
7.68 | 7.29 | 8.82 | 6.68 | 7.86 | 7.37 | 7.77 | |
6.99 | 7.36 | 6.78 | 7.40 | 7.13 | 8.11 | 7.04 | |
7.45 | 7.47 | 6.52 | 8.04 | 7.13 | 6.64 | 7.30 | |
1.28 | 1.21 | 1.47 | 1.11 | 1.31 | 1.23 | 1.30 | |
1.16 | 1.23 | 1.13 | 1.23 | 1.18 | 1.35 | 1.17 | |
1.24 | 1.25 | 1.09 | 1.34 | 1.19 | 1.11 | 1.22 | |
0.11 | 0.03 | 0.38 | 0.23 | 0.12 | 0.25 | 0.13 |
In Table 3, , , and denote the sums of test results for factor levels 1, 2, and 3, respectively; , , and represent the corresponding mean values; and is the range, defined as the difference between the maximum and minimum values. A larger indicates greater sensitivity of the factor.
The values for each factor at different levels, derived from Tables 1-3, are illustrated in Fig. 5.
Analysis of Results: Fig. 5(a): Rock layer thickness () is a highly sensitive positive factor ( 0.38; increase rate: 39.8 %). As thickness increases from 10 m to 20 m, the safety factor exhibits an apparent “pseudo-negative fluctuation” (1.47 → 1.09), attributable to coupling effects such as adverse slope angles and elevated groundwater levels. After isolating these interferences, rock thickness emerges as the predominant factor influencing stability. Theoretical models indicate that slopes remain stable when 10 m and 32 GPa. Fig. 5(b): Cohesion () is a strongly sensitive positive factor ( 0.25). The safety factor peaks at 18 kPa ( 1.35), with a decline at 23 kPa due to interference from extreme conditions. Cohesion remains a key regulator of shear strength, balancing safety and economic efficiency. Fig. 5(c): Unit weight () is a significantly sensitive negative factor ( 0.23). Despite an apparent positive trend (1.11 → 1.34), the increase is attributed to compensatory effects from the internal friction angle. Excluding this interference, each 5 kN/m3 increase in reduces the safety factor by approximately 3 %. Fig. 5(d): Groundwater level () is a significantly sensitive negative factor ( 0.13). The safety factor reaches a critical risk threshold at 8 m ( 1.17). Elevated water levels reduce effective stress via increased pore pressure, though compensatory effects from rock thickness may cause rebounds at higher levels. Fig. 5(e): Internal friction angle () is a weakly sensitive positive factor ( 0.12). The anti-sliding effect saturates beyond 25°, with minimal incremental gains in stability. Fig. 5(f): Slope angle () is a weakly sensitive negative factor ( 0.11). The highest risk occurs at 65° ( 1.16), influenced by synergistic effects with high and . Controlling ≤ 65° is recommended to mitigate instability. Fig. 5(g): Elastic modulus () has negligible influence (R = 0.03). For > 35 GPa, the safety factor increases marginally (1.21 → 1.25), with a 1.6 % gain per 5 GPa increment, primarily affecting deformation rather than shear strength.
Fig. 5Variation of safety factor of various factors at different levels
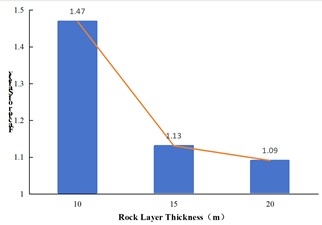
a) Safety factor for different rock layer thicknesses
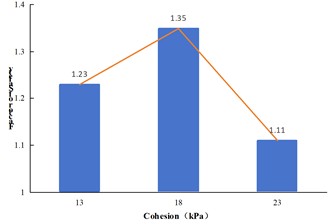
b) Safety factor for different cohesion values
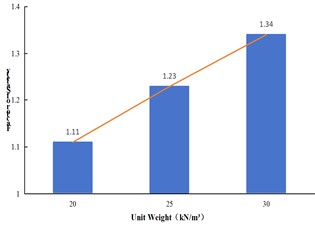
c) Safety factor for different unit weights
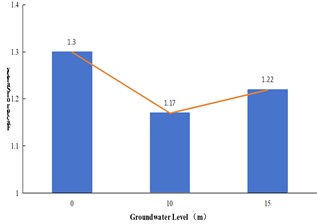
d) Safety factor for different groundwater levels
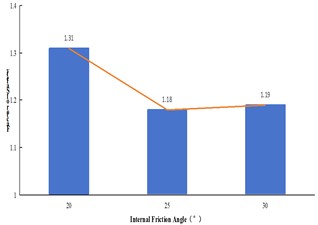
e) Safety factor for different internal friction angles
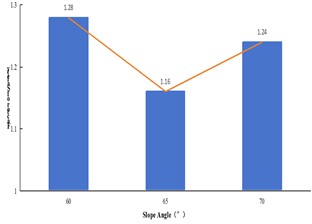
f) Safety factor for different slope angles
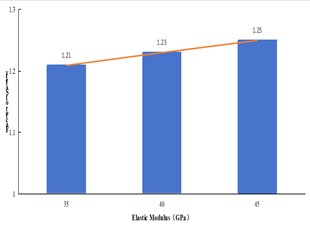
g) Safety factor for different elastic moduli
The sensitivity ranking of the seven influencing factors, arranged in descending order of their -values, is illustrated in Fig. 6. The corresponding significance classification of these factors is summarized in Table 4.
Fig. 6Sensitivity ranking of various factors
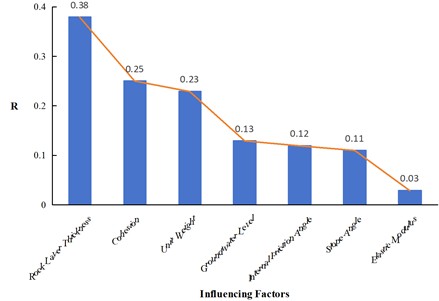
Table 4Significance classification of influencing factors based on R-values
Significance level | Factor | -value range | Core characteristic |
Extremely sensitive | Rock layer thickness | 0.3 | Strongest main effect; core controlling factor for stability |
Highly sensitive | Cohesion | 0.2 0.3 | Critical to shear strength; secondary core controlling factor |
Significant influence | Unit weight, groundwater level | 0.1 0.2 | Affects sliding force and shear strength; key prevention and control required |
Weak influence | Internal friction angle, slope angle | 0.1 0.15 | Limited effect; regulation can be combined with economic considerations |
Negligible | Elastic modulus | 0.05 | Weak effect; no additional regulation required |
3.3. Univariate analysis
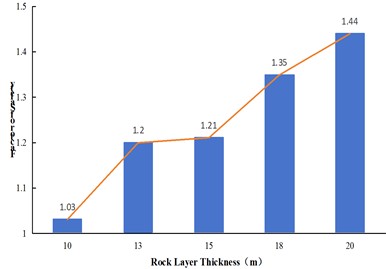
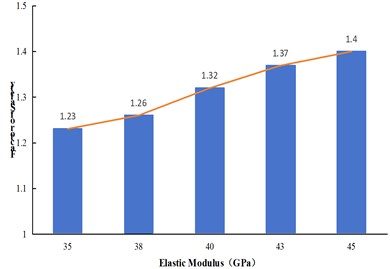
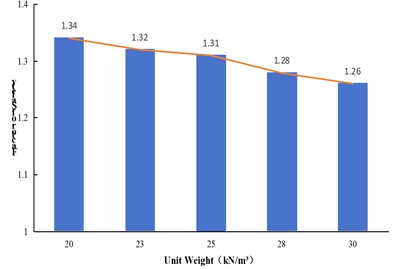
Based on Eq. (15), a univariate sensitivity analysis was conducted to evaluate the influence of four key parameters-rock layer thickness, elastic modulus, unit weight, and slope angle-on the stability of the target slope. The results are presented in Tables 5-8.
Table 5Univariate analysis results: Rock layer thickness (h)
(°) | (°) | (Gpa) | (m) | (m) | (kPa) | (kN/m3) | Factor of safety |
25 | 65 | 40 | 8 | 10 | 18 | 25 | 1.03 |
13 | 1.20 | ||||||
15 | 1.21 | ||||||
18 | 1.35 | ||||||
20 | 1.44 |
Table 6Univariate analysis results: Elastic modulus (E)
(°) | (°) | (Gpa) | (m) | (m) | (kPa) | (kN/m3) | Factor of safety |
25 | 65 | 35 | 8 | 15 | 18 | 25 | 1.23 |
38 | 1.26 | ||||||
40 | 1.32 | ||||||
43 | 1.37 | ||||||
45 | 1.40 |
Table 7Univariate analysis results: Unit weight (γ)
(°) | (°) | (Gpa) | (m) | (m) | (kPa) | (kN/m3) | Factor of safety |
25 | 65 | 40 | 8 | 15 | 18 | 20 | 1.34 |
23 | 1.32 | ||||||
25 | 1.31 | ||||||
28 | 1.28 | ||||||
30 | 1.26 |
Table 8Univariate analysis results: Slope angle (α)
(°) | (°) | (Gpa) | (m) | (m) | (kPa) | (kN/m3) | Factor of Safety |
25 | 60 | 40 | 8 | 15 | 18 | 25 | 1.32 |
63 | 1.30 | ||||||
65 | 1.29 | ||||||
68 | 1.28 | ||||||
70 | 1.26 |
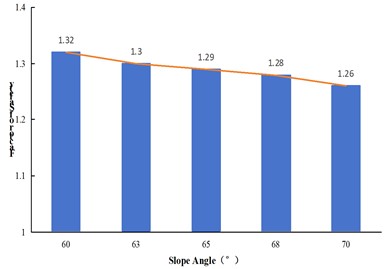
From Tables 5-8, the influence patterns of individual factors on the slope safety factor are derived and visualized in Fig. 7.
Fig. 7Sensitivity characteristics of slope safety factor to individual factors
a) Safety factor for different rock layer thicknesses
b) Safety factor for different elastic moduli
c) Safety factor for different rock unit weights
d) Safety factor for different slope angles
As depicted in Fig. 7(a), under constant values of other parameters, the safety factor increases monotonically with rock layer thickness. When the thickness increases from 10 m to 20 m, the safety factor rises from 1.03 (approaching the critical stability threshold of 1.0) to 1.44, representing a total increase of 39.8 %. This indicates that rock layer thickness is a key positive controlling factor: greater thickness enhances both the deformation resistance of the slope structure and the anti-sliding capacity of the rock mass, thereby significantly improving stability.
Fig. 7(b) shows that the safety factor increases continuously with elastic modulus. As the modulus rises from 35 GPa to 45 GPa, the safety factor grows from 1.23 to 1.40, an overall increase of 13.8 %. This trend suggests that a higher elastic modulus improves rock mass stiffness and deformation resistance, thereby enhancing stability. However, the magnitude of this effect is smaller than that of rock layer thickness, classifying elastic modulus as a weak positive factor.
In contrast, Fig. 7(c) reveals a monotonically decreasing trend in the safety factor as unit weight increases. When unit weight increases from 20 kN/m3 to 30 kN/m3, the safety factor declines from 1.34 to 1.26, a total reduction of 5.97%. This behavior stems from the increase in downslope gravitational force, which promotes sliding and reduces stability. Nevertheless, the decline remains moderate due to the constant shear strength parameters.
Similarly, Fig. 7(d) illustrates that the safety factor decreases with increasing slope angle. As the slope angle rises from 60° to 70°, the safety factor drops from 1.32 to 1.26, a total decrease of 4.55%. Steeper slopes exhibit reduced resistance to sliding, leading to lower stability. The effect is comparable in magnitude to that of unit weight.
In summary, rock layer thickness and elastic modulus act as positive factors, whereas unit weight and slope angle are negative factors. Regarding the magnitude of influence, the order is as follows:
Rock layer thickness (39.8 % increase) > Elastic modulus (13.8 % increase) > Unit weight (5.97 % decrease) ≈ Slope angle (4.55 % decrease).
Notably, variations in rock layer thickness and slope angle within specific intervals lead to nonlinear changes in safety factor, as indicated by the segmented trends in Fig. 6. This underscores the need for staged control strategies in slope design. In practice, increasing rock layer thickness should be prioritized-for example, via shotcrete and bolt support systems, which cost approximately CNY 800/m2 and reduce expenses by 30 % compared to traditional anti-slide piles. Such methods, combined with top-down construction and temporary anchoring, have been successfully applied in the northern slope of the mining area, achieving a 95 % qualification rate. Modifying the elastic modulus offers secondary benefits, while adjustments to unit weight and slope angle should be weighed against economic feasibility, as excessive optimization yields diminishing returns.
4. Effects of rainfall on slope stability
4.1. Parameter selection and model establishment
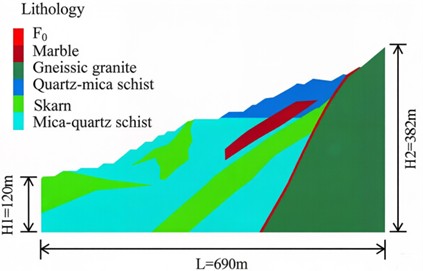
Based on the failure characteristics observed at the southern slope of Longyu Mine, as validated through field geological surveys and laboratory tests, slope instability is primarily governed by shear failure. The failure mechanism along the potential sliding surface (i.e., the mudstone layer) conforms to the Mohr-Coulomb strength criterion. Accordingly, the Mohr-Coulomb constitutive model was adopted for numerical simulations, and the strength reduction method was applied to compute the factor of safety. The southern slope model was constructed using FLAC3D software, as illustrated in Fig. 8.
Fig. 8Slope model
During the initial rainfall phase (0-6 h), unsaturated soil parameters were employed, with shear strength maintained at 80 %-90 % of the dry-state value. After 6 h, when the rock mass becomes fully saturated, saturated parameters were applied. This staged parameterization strategy mitigates excessive conservatism in early simulation stages, thereby improving alignment with actual rainfall infiltration behavior. In terms of boundary conditions, normal constraints were applied to the side surfaces of the model, while full three-dimensional constraints were imposed at the bottom. For slope stability calculation, the -axis was defined as the slope surface direction, and the -axis as the strike direction of the slope.
Table 9Rock physico-mechanical properties tests
Lithology | Air-dried bulk density (g/cm3) | Saturated Bulk Density (g/cm3) | Uniaxial compressive strength (MPa) | Shear strength parameters | Static elastic modulus (103MPa) | Poisson’s ratio | ||||
Air-dried | Saturated | |||||||||
Air-dried | Saturated | Cohesion (MPa) | Internal friction angles | Cohesion (MPa) | Internal friction angles | |||||
Quartz-mica schist | 2.52 | 2.54 | 15.04 | 9.78 | 2.43 | 37° | 1.66 | 36° | 15.60 | 0.26 |
Mica-quartz schist | 2.60 | 2.62 | 22.67 | 18.20 | 4.74 | 38° | 3.88 | 37° | 14.50 | 0.22 |
Skarn | 3.20 | 3.22 | 53.60 | 42.20 | 5.00 | 39° | 3.69 | 38° | 23.55 | 0.20 |
Marble | 2.75 | 2.76 | 58.40 | 45.60 | 6.19 | 39° | 4.74 | 38° | 28.50 | 0.18 |
Gneissic granite | 2.58 | 2.61 | 57.16 | 45.80 | 6.75 | 43° | 5.67 | 43° | 6.10 | 0.19 |
4.2. Rainfall scenario design and infiltration calculation
Based on the Encyclopedia of Chinese Meteorological Disasters and local meteorological data from Longyu Mine, three rainfall scenarios were designed (Table 10). Rainfall intensity follows a triangular distribution pattern-intensity increases initially, stabilizes midway, and decreases thereafter. The infiltration rate was calculated using Darcy’s law:
where is the rainfall infiltration rate (m/s), defined as the volume of water infiltrating per unit surface area per unit time; denotes the saturated hydraulic conductivity (m/s), an intrinsic parameter indicating soil permeability; and represents rainfall intensity adjusted by a runoff coefficient of 0.3. This runoff coefficient was determined from field infiltration tests at Longyu Mine (average value: 0.28-0.32 from three parallel tests) and is consistent with the range (0.2-0.4) recommended for similar lithologies in the Code for Geotechnical Investigation and Survey (GB 50021-2001). It should be noted that this value is site-specific and not universally applicable.
Table 10Rainfall simulation condition setting
Working condition number | Rainfall return period | Rainfall intensity (mm·h-1) | Rainfall duration (h) |
1 | Natural state | 0 | 0 |
2 | Light to moderate rain | 19 mm/d | 7 d |
3 | Heavy rain | 42.5 mm/d | 2 d |
4 | Torrential rain | 81.7 mm/d | 2 d |
4.3. Analysis of simulation results
Previous studies [22], [23] have indicated that for slopes with pronounced step-like geometries, the plane strain model and the 3D model yield comparable stability results, owing to the constraining effect of the steps. Accordingly, a plane strain model was derived from the 3D model in Fig. 8, and numerical analyses were performed under four rainfall conditions. The focus was placed on the displacement distribution and shear strain increment characteristics under each scenario.
(1) Variation of Displacement Field.
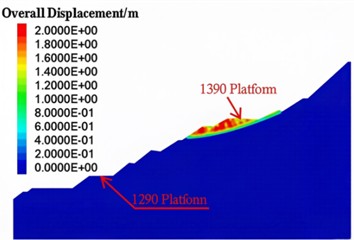
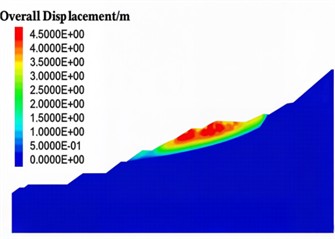
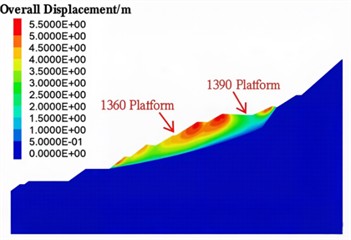
As depicted in Fig. 9, slope displacement under natural conditions exhibits localized concentration, with a maximum displacement of 2 m at the 1390 m platform, indicating a region of marginal initial mechanical equilibrium.
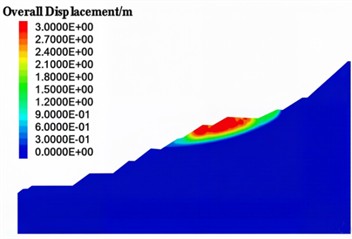
Fig. 9Displacement contour map under different states
a) Initial state
b) Light to moderate rain condition
c) Heavy rain condition
d) Torrential rain condition
With increasing rainfall intensity, the displacement field demonstrates a dual trend of spatial expansionand magnitude surge. Under light to moderate rainfall, displacement growth is moderate. In contrast, under heavy and torrential rainfall, displacement increases markedly. Under torrential conditions, the maximum displacement reaches 5.5 m – a 175 % increase compared to the natural state. The zone of significant displacement expands from the single 1390 m platform to a continuous section between 1360 m and 1390 m, forming a potential slip zone. Moreover, the affected area extends toward the slope toe, suggesting that rainfall-induced pore water pressure disrupts the deep mechanical equilibrium, leading to a trend of overall instability.
(2) Distribution of Shear Strain Increment.
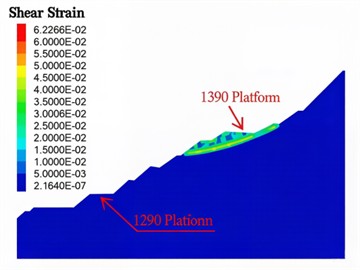
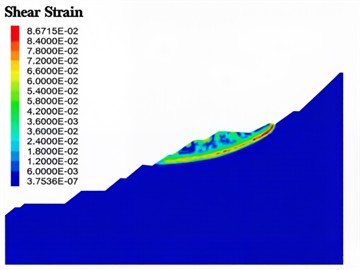
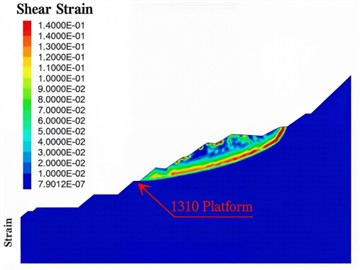
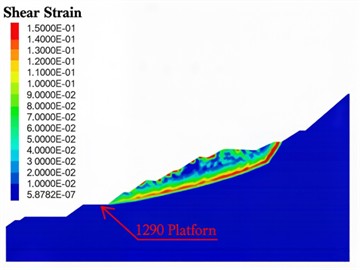
As illustrated in Fig. 10, under natural conditions, the high-value zones of shear strain increment are concentrated within the elevation range of 1330-1390 m, exhibiting a discrete distribution pattern. Following rainfall, these zones form an arc-shaped potential sliding surface through vertical extension and regional connectivity, indicating the weakening effect of rainfall on the slope’s shear strength. Under torrential rainfall conditions, the maximum shear strain increment increases from 5×10⁻² to 9×10⁻², representing an 80 % increase. This suggests that the risk of slope shear failure increases linearly with rainfall intensity. The evolution of the sliding surface demonstrates a clear downward migration trend: the shear outlet is located at the 1310 m platform under heavy rainfall and extends further to 1290 m under torrential rainfall. This reflects the continuous development of the shear failure surface toward deeper parts of the slope as rainfall infiltration depth increases. The formation and connectivity of this arc-shaped sliding surface serve as a key indicator of the transition from local instability to a global landslide.
Fig. 10Shear strain increment contour map under different states
a) Initial state
b) Light to moderate rain condition
c) Heavy rain condition
d) Torrential rain condition
Simulation results indicate that rainfall exacerbates slope instability through two primary mechanisms: (i) rainwater infiltration increases the saturation of the rock-soil mass, reduces effective stress, and attenuates shear strength; (ii) pore water pressure accumulation induces seepage forces, which drive shear displacement along the potential sliding surface, forming a vicious cycle of “stress degradation and displacement-driven failure.”
Furthermore, the simulations clarify the rainfall intensity threshold for slope stability: the slope remains relatively stable under light to moderate rainfall; heavy rainfall represents a critical point for stability transition; and under torrential rainfall, the slope approaches its instability limit. This threshold offers a quantitative basis for regional rainfall early-warning classification. Therefore, for this project, rainfall intensity exhibits a significant negative correlation with slope stability. Under torrential rainfall, the slope experiences a surge in displacement and connectivity of shear strain increment. The elevation range of 1360-1390 m is identified as the core risk area, while 1290-1310 m constitutes the key shear outlet zone, necessitating focused landslide prevention and control measures.
4.4. Field monitoring validation
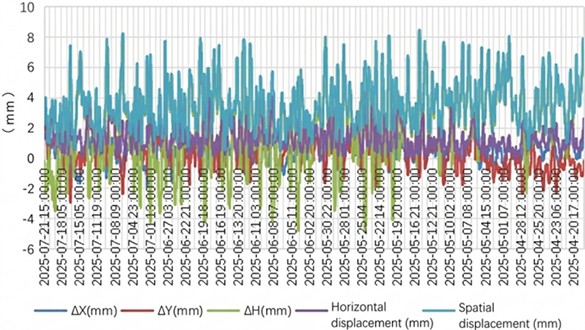
This study acquired 3D displacement data of the slope surface via GNSS monitoring points installed on stable deep bedrock (Fig. 11), providing direct validation for the numerical simulation results. Monitoring data from April 20 to July 21, 2025, indicated that cumulative displacement was controlled within ±10 mm. The corresponding displacement time-history is shown in Fig. 12.
Fig. 11GNSS Monitoring Points. Photo by Jia Haipeng in July 2024 on the south slope of the Longyu Large Open-Pit Mine
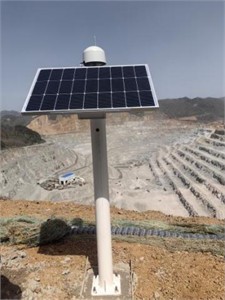
Fig. 12Displacement time-history curve
After the rainy season, localized small-scale landslides were observed on the slope surface. The maximum in-situ displacement measured was 5.2 m (Fig. 13), which aligns well with the numerically predicted value of 5.5 m. The error falls within an acceptable range for engineering applications, thereby verifying the reliability of the simulation.
Fig. 13Localized Landslide Map. Photo by Jia Haipeng in September 2025 on the south slope of the Longyu Large Open-Pit Mine
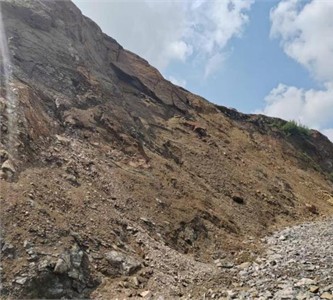
Based on the above, the current slope deformation is characterized by overall deep-seated subsidence accompanied by slight slope-direction creep, with small-scale landslides in the surface rock mass. This deformation pattern is typical of high-steep slopes in deep open-pit mines. The agreement between GNSS monitoring data and numerical simulations confirms the model’s predictive capability under heavy rainfall conditions.
5. Conclusions
Using the southern slope of the Longyu Large Open-pit Mine as a case study, a systematic investigation was conducted through theoretical modeling, experimental analysis, and numerical simulation, leading to the following conclusions:
1) Based on the assumptions of coordinated deformation and small strain, a differential equation for the surface rock layer of steep rocky slopes was established. A safety factor formula centered on the ratio of critical to actual slope length was derived. Stability is maintained when the rock layer thickness exceeds 10 m and the elastic modulus is greater than 32 GPa, providing a reliable mechanical model for evaluating buckling failure in similar slopes.
2) Orthogonal tests and sensitivity analyses revealed that rock layer thickness ( 0.38) is an extremely sensitive positive factor influencing slope stability (39.8 % increase rate), while cohesion is highly sensitive ( 0.25). Unit weight and groundwater level are significant negative factors, whereas the elastic modulus has negligible impact ( 0.03). This sensitivity ranking offers clear guidance for slope stability management.
3) FLAC3D simulations indicate a strong negative correlation between rainfall intensity and slope stability, with heavy rainfall as the critical stability transition point. Under torrential rainfall, maximum slope displacement reaches 5.5 m (a 175 % increase), and shear strain increment connectivity forms an arc-shaped sliding surface. The 1360-1390 m zone is the core risk area, and 1290-1310 m is the key shear outlet, clarifying the evolutionary path of rainfall-induced instability and critical control sections. Ongoing monitoring at 1360-1390 m will verify the predicted risk in the next rainy season.
References
-
X. L. Qu et al., “Stability analysis of fractured rock slope based on seepage-deformation coupling model using numerical manifold method,” Rock and Soil Mechanics, Vol. 45, No. 1, pp. 313–324, 2024, https://doi.org/10.16285/j.rsm.2023.0117
-
J. X. Guo and Y. Shi, “Slope stability analysis based on interaction of unsaturated parameters,” Science Technology and Engineering, Vol. 21, No. 12, pp. 5076–5083, 2021.
-
M. F. Xu et al., “Centrifugal loading finite element method for slope stability under damage-seepage coupling effect,” (in Chinese), Chinese Journal of Geotechnical Engineering, Vol. 41, No. 11, pp. 2103–2111, 2019, https://doi.org/10.11779/cjge201911016
-
L. W. Liu, H. X. Chen, and J. Li, “stability analysis of binary seepage slope based on stress partitioning,” (in Chinese), Journal of Transport Science and Engineering, Vol. 35, No. 4, pp. 9–14, 2019, https://doi.org/10.16544/j.cnki.cn43-1494/u.2019.04.002
-
G. Wang, H. Q. Li, and T. F. Liu, “Study on the shear mechanical properties of non-penetrating joints with different apertures and connectivity rates,” Journal of Mining Science and Technology, Vol. 10, No. 4, pp. 607–617, 2025, https://doi.org/10.19606/j.cnki.jmst.2025017
-
B. X. Huang et al., “The permeability evolution law of fractured sandstone under triaxial cyclic loading and unloading,” (in Chinese), Journal of Mining Science and Technology, Vol. 2025, pp. 1–15, Nov. 2025, https://doi.org/10.19606/j.cnki.jmst.2025074
-
Y. L. Zhou et al., “Stability analysis of unsaturated soil slope considering seepage-stress coupling under different rainfall conditions,” (in Chinese), Journal of Chongqing Jiaotong University (Natural Science), Vol. 42, No. 8, pp. 57–63, 2023, https://doi.org/10.3969/j.issn.1674-0696.2023.08.09
-
J. P. Wang, H. B. Xi, and B. S. Li, “Research and analysis on influencing factors of slope stability with rainfall infiltration field distribution,” (in Chinese), Journal of Lanzhou University of Technology, Vol. 48, No. 5, pp. 142–147, 2022.
-
Z. Guo, J. Q. Dang, and Z. H. Wang, “Evolution law of seepage field and slope stability analysis of residual soil slopes in northern Fujian under rainfall conditions,” (in Chinese), Water Resources and Power, Vol. 39, No. 11, pp. 154–157, 2021, https://doi.org/10.20040/j.cnki.1000-7709.2021.11.037
-
Z. Y. Hong et al., “Stability analysis of large waste dumps under unsaturated seepage with different rainfall conditions,” (in Chinese), Mining Research and Development, Vol. 41, No. 5, pp. 101–106, 2021, https://doi.org/10.13827/j.cnki.kyyk.2021.05.018
-
M. Li et al., “Stability analysis of seepage slope based on Darcy’s law,” (in Chinese), Safety in Coal Mines, Vol. 52, No. 5, pp. 238–241, 2021, https://doi.org/10.13347/j.cnki.mkaq.2021.05.042
-
L. Wang et al., “Slope stability of heap leaching site based on transient seepage,” (in Chinese), Nonferrous Metals (Mine Section), Vol. 75, No. 2, pp. 62–70, 2023, https://doi.org/10.3969/j.issn.1671-4172.2023.02.009
-
H. P. Peng and X. X. Li, “Slope stability analysis considering soil softening and seepage‐stress coupling effect,” (in Chinese), Engineering Journal of Wuhan University, Vol. 55, No. 2, pp. 117–122, 2022, https://doi.org/10.14188/j.1671-8844.2022-02-002
-
L. Y. Yang, K. Yang, and F. Y. Liu, “Stability analysis of open-pit mine slope considering pumped-storage after mine closure,” (in Chinese), China Mining Magazine, Vol. 33, No. 8, pp. 27–36, 2024, https://doi.org/10.12075/j.issn.1004-4051.20240415
-
J. G. Wang, Y. Bai, and M. M. Liu, “Analysis and study on the groundwater seepage characteristics and the stability of water-rich burnt rock slope,” (in Chinese), China Coal, Vol. 49, No. 12, pp. 51–60, 2023, https://doi.org/10.19880/j.cnki.ccm.2023.12.009
-
Q. F. Yang et al., “Stability and parameter sensitivity study of slope with softly dipped interlayer under fluid-structure interaction,” (in Chinese), Metal Mine, Vol. 2023, No. 2, pp. 196–202, 2023, https://doi.org/10.19614/j.cnki.jsks.202302027
-
F. Wang, A. Jiang, and Z. Cui, “Study on stability of shaft surrounding rock under adjacent shafts mining disturbance in underground mine,” Journal of Measurements in Engineering, Vol. 13, No. 4, pp. 982–1004, Dec. 2025, https://doi.org/10.21595/jme.2025.25041
-
S. Liu et al., “Research on the influence of width-height ratio and internal friction angle of the TT mode on the trapezoidal sliding surface of backfill behind the retaining wall,” Journal of Measurements in Engineering, Vol. 13, No. 4, pp. 786–803, Dec. 2025, https://doi.org/10.21595/jme.2025.25016
-
L. He, Y. Shang, X. Lei, and G. Li, “Destabilization mechanism and prevention technology of open-pit mine slope with soft interlayer under rainfall infiltration conditions: a case study,” Mining, Metallurgy and Exploration, Vol. 41, No. 2, pp. 859–873, Feb. 2024, https://doi.org/10.1007/s42461-024-00941-3
-
Z.-K. Huang, N.-C. Zeng, D.-M. Zhang, S. Argyroudis, and S.-A. Mitoulis, “Resilience models for tunnel recovery after earthquakes,” Engineering, Vol. 54, No. 11, pp. 320–345, Nov. 2025, https://doi.org/10.1016/j.eng.2025.06.028
-
Q. Zhang, L. Wang, and H. Zhang, “Rainfall infiltration process of a rock slope with considering the heterogeneity of saturated hydraulic conductivity,” Frontiers in Earth Science, Vol. 9, p. 80400, Jan. 2022, https://doi.org/10.3389/feart.2021.804005
-
C. Wu, Z. Z. Wang, S. H. Goh, and W. Zhang, “Comparing 2D and 3D slope stability in spatially variable soils using random finite-element method,” Computers and Geotechnics, Vol. 170, p. 106324, Jun. 2024, https://doi.org/10.1016/j.compgeo.2024.106324
About this article

This work was supported by the Henan Provincial Natural Science Foundation of China (Grant No. 252300421851).
The datasets generated during and/or analyzed during the current study are available from the corresponding author on reasonable request.
Haipeng JIA: conceptualization Ideas; formulation or evolution of overarching research goals and aims. Zhu Jipeng: formal analysis application of statistical, mathematical, computational, or other formal techniques to analyze or synthesize study data. Li Jiadong: investigation conducting a research and investigation process, specifically performing the experiments, or data/evidence collection. Yuxia Zhao: methodology development or design of methodology; creation of models. Chen Peng: project administration management and coordination responsibility for the research activity planning and execution. Haihua Zheng: resources provision of study materials, reagents, materials, patients, laboratory samples, animals, instrumentation, computing resources, or other analysis tools. Guo Guo: supervision oversight and leadership responsibility for the research activity planning and execution, including mentorship external to the core team. Kang Xiangyang: validation verification, whether as a part of the activity or separate, of the overall replication/reproducibility of results/experiments and other research outputs. Liang Yunfei: visualization preparation, creation and/or presentation of the published work, specifically visualization/data presentation. Yu Zilong: writing-original draft preparation creation and/or presentation of the published work, specifically writing the initial draft (including substantive translation). Haipeng Jia: writing-review and editing preparation, creation and/or presentation of the published work by those from the original research group, specifically critical review, commentary, or revision – including pre- or post-publication stages.
The authors declare that they have no conflict of interest.