Abstract
This paper addresses the inefficient and error-prone identification of tree hazards near transmission corridors by proposing a recognition method that uses 3D R-tree-integrated point cloud segmentation. LiDAR-equipped UAVs capture the original point cloud data of the corridor. The data are denoised and enhanced using principal component analysis (PCA). A 3D R-tree-integrated octree indexing structure is constructed to rapidly locate potential tree hazards by querying regions within the minimum safe distance. A Euclidean clustering algorithm with cylinder k-point constraints is applied to extract these hazardous point clouds. The spatial location of the transmission corridor is determined by fitting its point cloud via RANSAC-based least squares. Finally, distances between tree crowns and the corridor are calculated to identify hazards. Experiments demonstrate that the proposed method is efficient, accurate, and sensitive, offering an intelligent solution for automated corridor monitoring.
Highlights
- Novel hazard detection framework that integrates 3D R-tree with octree indexing to rapidly query and localize tree points within minimum safe distance around transmission corridors.
- Enhanced point cloud preprocessing using PCA-based denoising and RANSAC-least-squares fitting, improving data quality and corridor spatial localization accuracy.
- Efficient and sensitive extraction via Euclidean clustering with cylinder k-point constraints, enabling automated, real-time identification of hazardous tree crowns with proven experimental performance.
1. Introduction
Transmission lines are critical components of the power grid, characterized by long distances and extensive coverage. As essential pathways comprising towers, conductors, and associated infrastructure, transmission corridors are often constructed in complex natural environments where abundant vegetation poses significant operational risks [1-3]. Over time, tree growth can lead to vegetation encroaching within safe distances, causing short circuits, fires, and grid failures [4-6]. Accurate and timely identification of such tree hazards is therefore crucial for ensuring corridor safety [7].
Existing research has explored various fault detection methods. Ghashghaei et al. combined support vector machine (SVM) and k-nearest neighbors (KNN) for HVDC fault identification but faced sensitivity to feature scaling [8]. Alam et al. utilized normalized bus current changes (NGBCV) and branch power distribution factors (BPDF); yet their method was vulnerable to topology changes [9]. Patel et al. proposed a Lissajous-based fault estimation approach that required high-quality data, which was often compromised by noise in practical networks [10]. Ahmed et al. employed UAVs and CNNs for insulator defect detection but struggled with variations in lighting and weather [11].
3D R-tree, an extended spatial indexing structure derived from the R-tree, excels in efficiently querying and indexing 3D spatial objects. Its integration with other technologies can significantly improve the processing efficiency of 3D spatial data [12]. Point cloud segmentation, which partitions point clouds into distinct regions based on feature similarity, is a key technology for extracting target objects from complex point cloud data. By combining the advantages of both, this paper proposes a transmission corridor hazard identification method based on 3D R-tree-integrated point cloud segmentation, aiming to address the aforementioned technical challenges in tree hazard detection.
This paper’s primary contributions are threefold: (1) the design of a hybrid 3D R-tree-octree spatial indexing structure to enable fast spatial querying of large-scale point cloud data; (2) the proposal of a cylinder-constrained Euclidean clustering algorithm for accurate extraction of transmission corridor point clouds from cluttered backgrounds; and (3) the construction of an end-to-end workflow for transmission corridor tree hazard identification - from LiDAR point cloud acquisition to final hazard detection - with validations on real-world data. The remainder of this paper is organized as follows: Section II elaborates on the proposed method in detail; Section III presents the experimental results and performance analysis; Section IV draws the conclusions and outlines future research directions.
2. Tree hazard identification in transmission corridors
2.1. Data acquisition and preprocessing
For the identification of hazards in transmission corridors, point cloud data of the transmission corridors and their surrounding environments are collected [13]. Unmanned aerial vehicles (UAVs) can quickly access designated areas without direct human intervention and are unaffected by adverse environmental conditions, enabling the detection of hazardous areas with cost-effectiveness, high efficiency, and operational flexibility [14]. They can acquire high-precision point cloud data in real time and achieve millimeter-level measurement accuracy [15], which facilitates the creation of detailed three-dimensional (3D) models of the transmission corridor and its surroundings. Therefore, this paper integrates UAV and LiDAR technologies to construct a point cloud data acquisition platform for transmission line corridors and their surrounding environments.
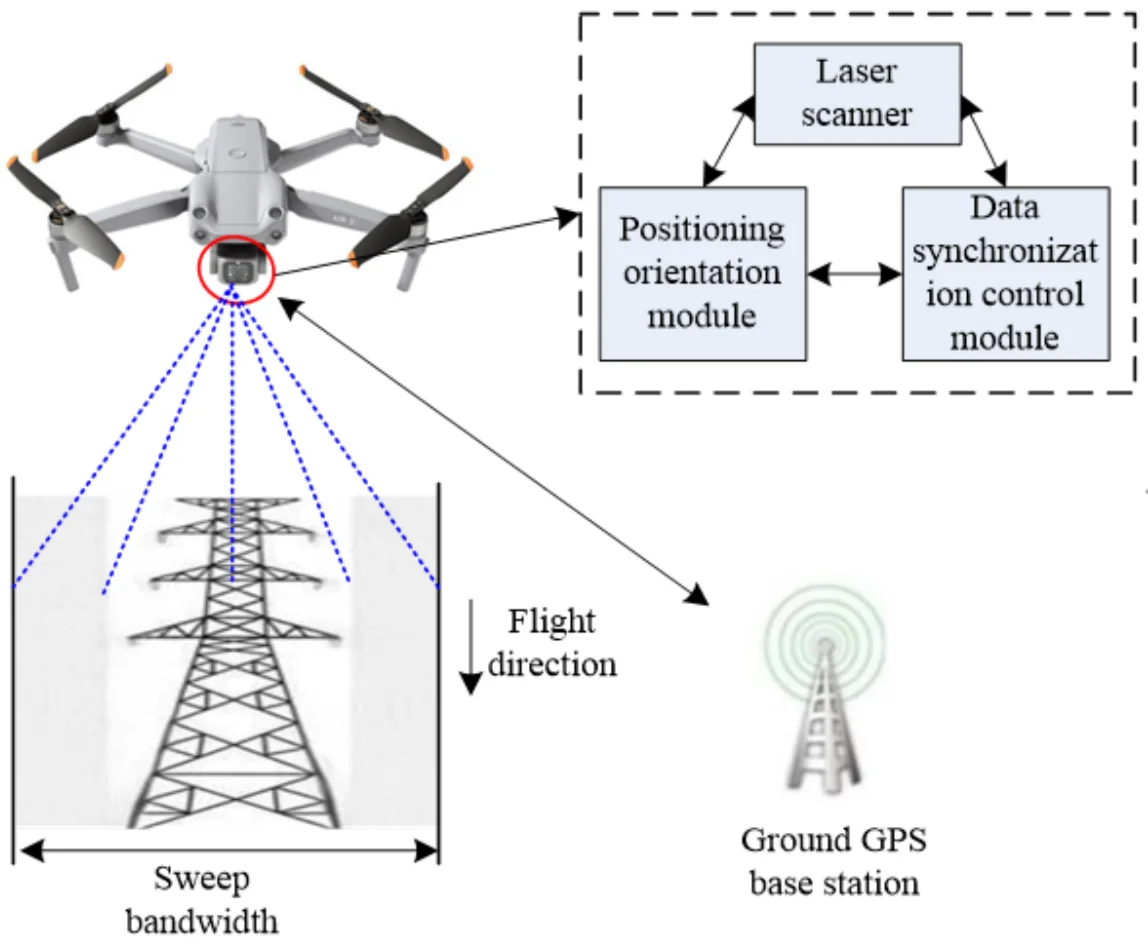
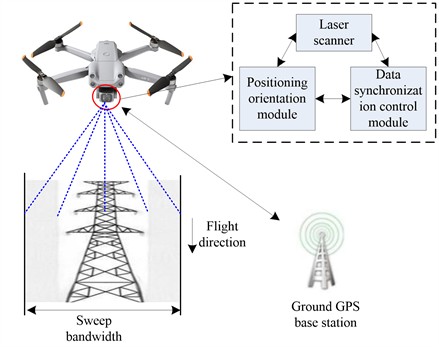
The platform built in this study comprises four main components: (1) an UAV serving as the flight platform; (2) a lightweight LiDAR scanning system; (3) a high-precision position and orientation system (POS), consisting of a differential GNSS receiver and an inertial measurement unit (IMU), directly and rigidly connected to the LiDAR to accurately obtain position and attitude information at each scanning instant; and (4) an integrated control and synchronization unit, which ensures strict time synchronization among the LiDAR, POS system, and UAV flight control system while controlling real-time data acquisition and storage.
The specific configuration and technical parameters of the point cloud data acquisition platform constructed in this study are as follows:
(1) UAV Platform: A DJI Matrice 300 RTK unmanned aerial vehicle is employed, with a designed maximum payload of 2.7 kg, a flight endurance of ≥ 55 minutes, and an IP45 protection rating. To enhance stability in the strong electromagnetic environment of transmission corridors, key electronic components (such as the compass and GPS antenna) are additionally equipped with custom electromagnetic shielding covers.
(2) LiDAR System: The platform is equipped with a Velodyne VLP-16 LiDAR scanner. It operates at a wavelength of 905 nm, with a scan frequency of 10 Hz, a vertical field of view of ±15° (30° total), and a 360° horizontal field of view. It generates approximately 300,000 points per second, with a nominal ranging accuracy of ±3 cm (@100 m). The LiDAR is mounted to the UAV airframe via a rigid vibration-damping bracket, and its installation pitch angle is precisely calibrated to optimize scanning coverage of the corridor's conductors and vegetation.
(3) POS System: A NovAtel SPAN-CPT integrated navigation system is used, combining a GNSS receiver with a tactical-grade IMU. In this experiment, real-time kinematic (RTK) differential positioning is implemented. A reference station established at a ground control point with known coordinates provides correction data via a data link, achieving centimeter-level real-time positioning (horizontal: ±1 cm, vertical: ±2 cm) and high-precision attitude measurement (roll/pitch accuracy: 0.05°, heading accuracy: 0.15°).
(4) Synchronization and Control Unit: Based on Pixhawk 4 flight controller hardware and custom-developed time-synchronization firmware, hardware trigger pulses ensure clock synchronization errors among the LiDAR, IMU, and GNSS receiver are less than 1 microsecond. Raw point cloud data, IMU raw data, and GNSS observation data streams are recorded in real time on an onboard 512 GB solid-state drive.
Prior to field operations, professional flight planning software is used to design parallel scanning flight lines based on preset scan angles, point cloud density requirements (> 200 pts/m2), and terrain relief. The flight altitude is set to 80 m (above ground level), the flight speed to 5 m/s, and the side overlap is maintained at no less than 60 %. During flight, the operator monitors the POS system's positioning status and point cloud coverage preview in real time. After acquisition, vendor-specific software is used for integrated post-processing. This involves rigorous calculation and fusion of the raw laser ranging data, high-frequency IMU attitude data, and differential GNSS trajectory data, ultimately generating dense point clouds (in LAS format) with real-world 3D geographic coordinates (WGS84/UTM). The positioning and orientation module utilizes airborne GPS data and base station GPS data for differential processing to determine the platform’s position, while the IMU measures the attitude to determine the UAV's orientation in flight. The data synchronization control module is primarily responsible for controlling data acquisition, synchronization, and recording among the laser scanner, IMU, GPS, and other hardware components.
2.2. Systematic error control and accuracy verification
To mitigate systematic errors inherent in the UAV LiDAR system, a rigorous calibration procedure is performed before and after each field mission at a dedicated calibration field with known three-dimensional coordinates. This calibration determines the lever-arm offsets and angular misalignments (boresight angles) between the LiDAR sensor and the IMU. The calibration process involves flying over the calibration field at multiple altitudes and orientations, allowing for the estimation and correction of systematic ranging and attitude biases.
To verify the absolute georeferencing accuracy of the acquired point cloud, multiple ground control points (GCPs) are established within the survey area using a high-precision GNSS receiver in RTK mode. The coordinates of these GCPs are measured with centimeter-level accuracy (horizontal: ±1 cm, vertical: ±2 cm) and serve as independent validation references. After generating the point cloud, the coordinates of the GCPs extracted from the point cloud are compared against their surveyed coordinates. The root mean square errors (RMSEs) in the planimetric and vertical directions are calculated to quantify the absolute accuracy. The experimental results demonstrate that both the planimetric and vertical RMSEs are less than 10 cm, meeting the accuracy requirements for subsequent hazard identification along transmission corridors.
In addition to absolute georeferencing accuracy, the relative precision of the point cloud is assessed by evaluating the consistency of point-to-point distances on rigid structures (e.g., transmission towers) across overlapping flight swaths. The standard deviation of these distances is computed to quantify relative registration errors. The observed relative registration error is maintained below 5 cm, ensuring reliable extraction of geometric features such as tree canopy boundaries and conductor sag profiles. This level of precision is essential for accurate hazard identification, as the subsequent analysis primarily depends on relative spatial relationships between vegetation and transmission infrastructure.
2.3. Field data collection measures
In practical data collection, to address the complex electromagnetic environment around transmission corridors and ensure flight safety and data quality, the following measures are implemented in this study. First, the DJI Matrice 300 RTK is an industrial-grade UAV platform with an IP45 protection rating and electromagnetic interference resistance; nevertheless, additional electromagnetic shielding materials are installed on sensitive components such as the compass and GPS modules to further mitigate potential interference from high-voltage transmission lines. Second, flight paths are carefully planned to maintain a safe distance from energized lines in compliance with regulations, and a combination of manual and automatic control modes is employed when traversing high-interference zones. Finally, all data are collected under conditions of low wind speed and clear weather to maximize the stability of the flight platform. The LiDAR equipment used in the experiment is lightweight-modified and underwent integrated calibration with the UAV to ensure that its accuracy remains unaffected by minor fluctuations in flight attitude.
The collection of point cloud data from transmission line corridors and their surrounding environments via airborne LiDAR field flights is a complex process. First, a field survey of the transmission corridor and the target data acquisition area is conducted. Based on the survey results and flight mission requirements - and considering factors such as the inherent scanning angle and scanning frequency of the LiDAR system, flight swath width, flight line overlap, and local weather conditions – specialized flight planning software is used to design the flight route. Next, ground base stations are established for dynamic GPS positioning. Before and after data acquisition, the relevant equipment must be calibrated to correct systematic errors and improve the accuracy of the collected point cloud data. Finally, coordinate resolution is performed by integrating airborne GPS data, ground base station GPS data, IMU attitude data, and raw laser ranging data, yielding laser point cloud data of the transmission corridor and its surroundings with real three-dimensional spatial coordinates in the acquisition area.
2.4. Point cloud denoising and tower component segmentation
During the actual inspection of transmission corridors, the accurate classification of tower components is challenging due to the diversity of tower designs and ancillary elements, as well as interference from the extensive point clouds of the tower frame [16]. To address these issues, this paper proposes a segmentation method for the suspension layer of electric towers based on vertical layered projection features, which effectively removes the majority of point clouds from the tower’s skeletal structure that do not contain relevant components.
To fully utilize the symmetry and projection features of an electric tower and to extract its geometric structural parameters, realigning the tower point cloud is necessary [17]. First, the tower is projected onto the YOX plane; the realignment process is illustrated in Fig. 1. This paper defines the direction in which the cross-arm extends as the principal direction of the tower, as shown by the red arrow in Fig. 1(a). By calculating the covariance matrix and eigenvectors of the projected tower point cloud, the eigenvector corresponding to the largest eigenvalue is identified as the principal direction of the tower plane.
Fig. 1Schematic diagram of the tower point cloud realignment process
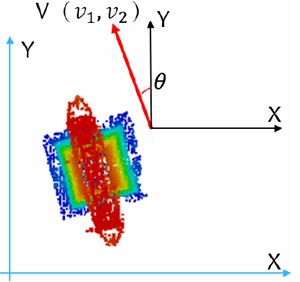
a) Before realignment
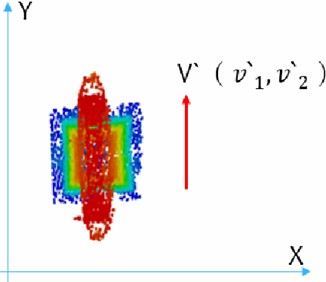
b) After realignment
Subsequently, the angle between the principal direction of the tower plane point cloud and the -axis is calculated according to Eq. (1) [18]:
where, and represent the components of the principal direction vector of the tower plane point cloud along the -axis and -axis, respectively.
The tower is then rotated about the -axis to align the principal direction of the tower head parallel to the -axis. The coordinates of each point after tower realignment are calculated as follows:
where, , and are the coordinates of the tower points after realignment.
The tower redirection results are sensitive to point cloud density and accuracy. A higher point cloud density of the tower leads to a more accurate estimation of its principal direction. When the tower point cloud is sparse or exhibits incompleteness, significant deviation in the principal direction estimation may occur, resulting in inadequate realignment. The accuracy of the point cloud collected by the UAV LiDAR system is within the centimeter level, which reduces deviation in principal direction estimation and contributes to data denoising. During point cloud denoising, traditional methods may mistakenly remove slender structures such as power lines due to their low point density, compromising the integrity of subsequent corridor spatial modeling. To address this, this study introduces a filtering strategy based on local density preservation within the denoising algorithm. By setting density thresholds and evaluating structural continuity, it removes discrete noise points while preserving low-density feature point clouds – such as spatially continuous power lines.
To improve the accuracy of tree and structure extraction, ground points are removed using a progressive morphological filter. This method iteratively applies morphological opening operations with increasing window sizes to separate ground and non-ground points based on elevation differences. After ground removal, the remaining point cloud consists mainly of vegetation, towers, and power lines, which facilitates subsequent segmentation and classification.
2.5. 3DOR-tree index
The core idea of the proposed indexing method is to combine the space-partitioning efficiency of an octree with the dynamic adaptability of an R-tree. This hybrid structure, referred to as the 3DOR-tree, enables fast spatial queries while maintaining a balanced tree organization. Spatial indexing of point cloud data is a data structure that describes and organizes spatial relationships within point clouds to facilitate efficient querying, accessing, and processing [19]. Such an index structure can significantly improve the operational efficiency of point cloud data, which is particularly crucial when handling large-scale point clouds. When applied to identifying tree hazards in transmission corridors, point cloud data from the corridor and its surroundings can be spatially indexed according to location and shape, forming a hierarchical data structure. This structure improves data query and access efficiency and can rapidly locate areas where potential tree hazards exist.
The three-dimensional R-tree index is a tree data structure used for spatial data storage and querying, effectively adapting to the distribution characteristics of spatial data and providing robust and efficient spatial query capabilities. Its fundamental concept is to organize and index data in three-dimensional space using a tree structure. Specifically, the R-tree divides space into a series of overlapping minimum bounding boxes (MBBs) and uses these bounding boxes as nodes for indexing.
R-tree index generation can be categorized into dynamic and static methods. The dynamic generation method aligns more closely with the requirements of multidimensional spatial data management; however, each point can be inserted into the index only after complex operations such as node selection and splitting. This method is challenging to implement for the point cloud data from hundreds of millions of transmission corridors and their surrounding environments, which necessitates a more efficient index creation approach. An octree offers an efficient way to organize three-dimensional spatial data. It recursively subdivides 3D space into eight equal subspaces and continues partitioning each non-empty subspace until a termination condition is met, thereby constructing a hierarchical data structure. This structure effectively adapts to the spatial distribution characteristics of point cloud data from transmission corridors and their surroundings and provides rapid spatial query and location functions. Therefore, this paper employs the R-tree-integrated octree (3DOR-tree) method to establish a spatial index for point cloud data of transmission corridors and their surrounding environments, which optimizes the index structure, reduces unnecessary node splitting and merging operations, and improves index maintenance efficiency. Specifically, the method first uses an octree to partition the point cloud data into different subnodes according to spatial location, building the corresponding octree structure. The octree nodes are then inserted into the R-tree index as R-tree entries, constructing an R-tree data structure that incorporates octree information. The construction process is illustrated in Fig. 2.
Fig. 2Construction of the 3DOR-tree index for the transmission corridor and its surroundings
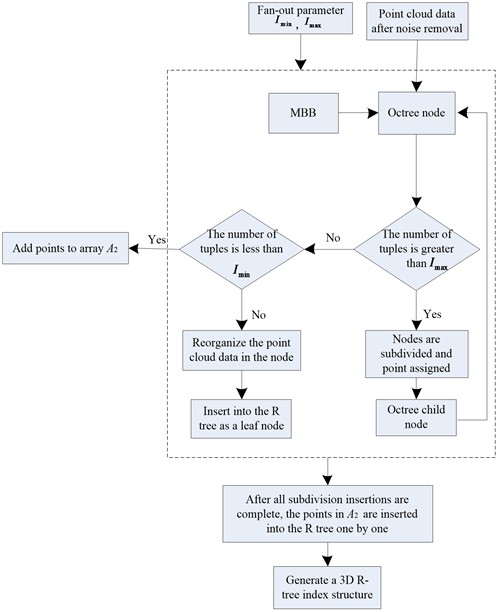
When constructing the 3D R-tree spatial index for point cloud data of transmission corridors and their surrounding environments, the fan-out parameters of the 3D R-tree must first be determined - specifically, the maximum number of entries and the minimum number of entries allowed per node. In this paper, an entry refers to a point in the denoised point cloud data of the transmission corridor and its surroundings. Next, the three-dimensional space containing the point cloud data is recursively partitioned using an octree until the number of points in each subspace (i.e., each octree child node) meets a convergence condition, namely that the point count in each leaf node is less than or equal to . For each child node (octree leaf) generated during octree partitioning, if its point count is between and , the spatial extent (minimum bounding cube) and its contained points are directly inserted into the R-tree as an R-tree leaf node. If an octree leaf node contains fewer than points, those points are placed into a temporary local array. Points in this array are then sequentially traversed and recombined into multiple leaf nodes that satisfy the -to- condition, and these leaf nodes are inserted individually into the R-tree. If a node produced during octree partitioning does not satisfy the fan-out parameter condition (i.e., its point count is greater than but less than ), its points are added to a global point group. After octree partitioning is complete, points in the global point group are traversed and each is inserted as a single-point entry into the R-tree.
The process for creating a 3D spatial point cloud data index of the transmission corridor and surrounding environment is described as follows.
Input: Point set (denoised point cloud data of the transmission corridor and its surrounding environment), R-tree fan-out parameters and .
Output: 3D R-tree index structure.
The proposed 3DOR-tree construction algorithm follows a hybrid strategy of “organize first, index later”. Its core workflow can be summarized into three main stages:
(1) Octree-based Spatial Coarse Partitioning: The octree is used to recursively and uniformly partition the entire point cloud space into multiple subspaces until the number of points within each subspace reaches a manageable scale.
(2) Node Classification and Packaging: For each octree leaf node, it is categorized into one of three types based on its point count. Subsequently, these nodes (or their points) are packaged into suitable "data blocks" ready for direct insertion into the R-tree.
(3) R-tree Batch Construction and Finalization: The data blocks packaged in the second stage are inserted in batches into the R-tree framework. Finally, a minimal number of unpackaged scattered points are processed to form the final balanced index structure.
This algorithm fundamentally avoids the high cost of node splitting inherent in traditional dynamic R-trees when constructing indexes for massive point clouds, by transforming the unordered insertion of billions of points into the batch processing of a limited number of regular data blocks. The detailed step-by-step description follows.
Step 1: Initialization.
(1) Compute the minimum bounding box (MBB): Determine the MBB for all points (i.e., tuples stored in R-tree leaf nodes) from the denoised 3D point-cloud data of the transmission corridor and its surroundings. This is done by scanning all points in the denoised corridor point cloud and finding their minimum and maximum values along the -, -, and -axes (, , , , , ). These extrema define the cube of minimal volume that encloses all points of the denoised 3D point-cloud data, i.e., the minimum enclosing box.
(2) Define the root-node range of the octree: Taking the lower-front-left corner of the minimum enclosing box (, , ) as the origin, compute the smallest cubic region that contains the entire denoised point-cloud set of the corridor and its surroundings. This cubic region serves as the spatial range of the octree’s root node.
(3) Create local point arrays and , and initialize a global point array. These arrays are used for temporary storage of point data during processing.
Step 2: Octree Space Partitioning and Point Assignment.
Check the tuple count in the current octree node (which may be the root or a child node). If the number of tuples exceeds the maximum fan-out parameter of the R-tree, perform octree-based spatial partitioning: the space of the current node is evenly subdivided into eight subspaces, and each tuple is assigned to the corresponding child node according to the position of its minimum bounding box (MBB) center point; then proceed to Step 3. If the tuple count is less than or equal to , stop further node subdivision.
Step 3: Processing Points That Do Not Satisfy the Fan-out Parameters.
(1) Clear the point array . Traverse the child nodes of the octree; if a child node contains fewer points than the R-tree’s minimum fan-out parameter , add those points to . At this stage, the total number of points in is denoted as .
(2) Perform different operations depending on the value of :
If , transfer all points from array to array .
If , pack all points in as a single leaf node and insert it into the R-tree.
If , split the points in into two leaf nodes and insert them into the R-tree.
If , divide the first points in evenly into leaf nodes and insert them into the R-tree, where . The remaining points, denoted as , satisfy the relationship given in Eq. (3):
If , insert the remaining points as a single leaf node into the R-tree.
If , split them into two leaf nodes and insert both into the R-tree.
Step 4: Recursive Space Partitioning.
If the number of points in a child node processed in Step 3 exceeds , the spatial partitioning and point assignment operations described in Step 2 are recursively applied to that node.
Step 5: Insert Nodes Satisfying the Fan-Out Parameters.
Traverse the child nodes of the octree; if a child node contains a number of points between and , its points are inserted into the R-tree as a leaf node.
Step 6: Process Remaining Points.
After all octree branch splits are completed, the points in array are inserted individually into the R-tree as entries.
Step 7: Termination.
The algorithm concludes, generating a three-dimensional R-tree spatial index that contains all point cloud data of the transmission corridor and its surrounding environment.
In summary, the 3DOR-tree construction algorithm introduces the octree as an efficient spatial pre-processor to quickly organize the point cloud into batches based on spatial location. These spatial batches (or their recombined forms) are then fed as whole units to the R-tree for batch index construction. This division of labor leverages the strengths of both structures: it preserves the excellent dynamic querying and balancing capabilities of the R-tree while overcoming its inherent inefficiency during large-scale data insertion. This makes it particularly well-suited for managing large-scale, elongated, belt-shaped point cloud data such as that from transmission corridors.
The core advantage of the 3DOR-tree index proposed in this paper lies in its integration of the complementary characteristics of the octree and the R-tree, which makes it superior to either structure alone in terms of index construction, update efficiency, and tree structure balance.
In terms of node operation optimization, traditional dynamic R-trees may trigger recursive splitting from leaf to root nodes for each point insertion when handling massive point clouds, resulting in substantial computational overhead. While the pure octree is efficient in spatial partitioning, its static and uniform subdivision tends to generate numerous empty nodes when dealing with linearly distributed and non-uniform point clouds such as those of transmission corridors, leading to storage waste and increased query depth. The 3DOR-tree addresses this issue through a cooperative division of labor: the octree first acts as an efficient spatial allocator, rapidly organizing the point cloud into cubic units with good spatial locality. These units (or their compliant subsets) are then inserted as bulk data units into the R-tree as a whole. This strategy transforms billions of individual point insertion operations into a significantly smaller number of batch node insertions, fundamentally reducing the frequency of node splitting and merging within the R-tree. Moreover, the pre-partitioning by the octree ensures that spatially adjacent points remain close in physical storage, greatly enhancing cache hit rates for subsequent spatial queries.
Regarding the maintenance of tree balance during dynamic updates, the 3DOR-tree demonstrates strong adaptability. When new point cloud data is acquired during inspections, the system first locates the corresponding octree spatial unit. Update operations (insertion or deletion) are strictly confined to the local R-tree subtree associated with that unit. The inherent balancing algorithms of the R-tree ensure that the subtree is rebalanced after the update. Since the top-level framework of the octree remains stable, this “local disturbance, local rebalancing” model avoids global index reconstruction. Furthermore, by strictly adhering to the R-tree’s fan-out parameters, the system automatically prevents node overflow or underflow, thereby maintaining the overall index structure’s performance without degradation over long-term and continuous dynamic updates.
In summary, the 3DOR-tree is not a simple superposition of two structures but achieves a unified approach of “rapid spatial organization” and “efficient dynamic balancing” through hierarchical collaboration between the octree and the R-tree. This makes it particularly suitable for managing large-scale, periodically collected point cloud data in transmission corridors.
Through the aforementioned operations, a three-dimensional spatial point-cloud data index for the transmission corridor and its surrounding environment is established, yielding a 3D R-tree index structure.
In summary, the three-dimensional R-tree-integrated octree method is employed to construct the index structure for point cloud data of the transmission corridor and its surrounding environment. This approach primarily uses the spatial partitioning strategy of the octree to allocate points from the denoised corridor and surrounding environment point cloud to the same or adjacent nodes, thereby improving index generation efficiency. By inserting points in batches using nodes as insertion units, the time-consuming process of point-by-point insertion is avoided. Concurrently, a dynamic generation method is applied to construct the R-tree, which ensures optimal spatial adaptability while maintaining a balanced tree structure and efficient space utilization.
By defining query conditions (such as the minimum safe distance between the transmission corridor and surrounding trees), the constructed three-dimensional R-tree index of the transmission corridor and its environment can be used to rapidly locate potential areas containing concealed tree hazards. Subsequently, regions that do not satisfy the query parameters are quickly filtered out, effectively narrowing the search scope for personnel and thereby improving the efficiency and accuracy of subsequent hazard identification in transmission corridors.
2.6. Cylinder-constrained Euclidean clustering for point cloud segmentation
To accurately extract the transmission corridor point cloud from cluttered environments, a cylinder-constrained Euclidean clustering algorithm is proposed. The key idea is to restrict the clustering search space to a cylindrical volume defined by the corridor’s linear extent, thereby filtering out central tree hazard points while preserving the corridor structure. After locating potential areas with tree hazards, it is necessary to extract the point cloud of the transmission corridor and its surroundings, effectively segmenting the data to obtain a relatively pure point cloud. Pure point cloud data accurately reflect the geometric shape of the transmission corridor and its environment, which facilitates measuring the distance between the corridor and potential tree hazards and determining the presence of safety risks. Euclidean clustering is a segmentation method based on Euclidean distance measurement, primarily used for point cloud data segmentation [20-21]. Applying this method to hazard identification in transmission corridors enables accurate and efficient extraction of pure point clouds of the corridor and its surroundings.
The clustering method processes a set of points from the point-cloud data, initially regarded as separate partitions. It defines an affinity measure between points in the -dimensional space, then iteratively merges the two closest partitions into one and recomputes inter-partition distances until all distances exceed a fixed threshold. Applying Euclidean distance in cluster analysis allows data similarity to be assessed based on point-to-point distance: a shorter distance implies higher similarity, leading to grouping such points into one cluster; a larger distance indicates insufficient similarity, meaning the points belong to different clusters [22]. The traditional Euclidean clustering algorithm proceeds as follows: from the localized point cloud within a potential tree-hazard area, select a query point , define a distance threshold , and use the 3D R-tree index of the corridor and its surroundings to retrieve the nearest points. Then compute the Euclidean distance between each of these points and the query point.
The threshold in this paper is determined according to the average point-cloud spacing and the regulatory safe clearance between trees and power lines. Its value strongly influences cluster completeness and segmentation accuracy; a sensitivity analysis will be presented in later experiments. If is smaller than , the corresponding point is added to cluster . This process repeats until no new points are added to . Subsequently, a new query point can be chosen, and the procedure is repeated to identify other clusters in the point-cloud data of the transmission corridor and its surroundings [23].
However, due to the complex grid-like environment of the transmission corridor, the standard Euclidean clustering algorithm alone is insufficient to separate the corridor point cloud and its surrounding environment from closely spaced objects within the data. Therefore, this paper proposes a new segmentation algorithm for point cloud extraction, namely the Euclidean clustering algorithm with cylinder k-point constraints. Its core lies in defining a three-dimensional cylindrical constraint consistent with the spatial orientation of the corridor and embedding it as a spatial filter into the clustering process.
The geometric definition of the cylinder is based on the central axis fitted from the corridor point cloud. This axis is determined by two endpoints, and . Centered on this axis, a cylindrical space is constructed with a radius (typically half the safe width of the corridor plus a margin) and a length covering the entire axis. The criteria for determining whether any point lies within this constrained cylinder include: first, the perpendicular distance from point to the central axis must not exceed the radius ; second, the projection of point along the axial direction must fall within the range defined by the endpoints and .
During the clustering process, this cylindrical constraint is used to dynamically filter neighboring points. Specifically, when expanding a cluster from a seed point, the algorithm quickly retrieves all candidate neighboring points within a Euclidean distance threshold via the 3DOR-tree index. However, not all candidate points are incorporated into the current cluster; only those that simultaneously satisfy the aforementioned geometric criteria for being inside the cylinder are merged. This strategy strictly confines the spatial exploration range of clustering to the physical passage of the corridor, thereby effectively excluding interfering objects on both sides, above, and below, and ensuring that the extracted point cloud clusters purely correspond to target structures such as transmission lines and towers.
For tree-hazard point clouds, which are typically located near the center of the transmission corridor, the resulting high density and disordered distribution make it impractical to traverse the entire corridor point cloud directly to locate the points at both ends of the corridor. Therefore, a density-gradient-based inverse search is employed to find the point cloud at one end of the corridor and to identify the nearest points at that end [24]. The entire corridor and its surrounding point cloud are constrained within the spatial range of the corridor itself. Consequently, this approach effectively filters out the central tree-hazard point cloud.
If, within the point cloud space of the transmission corridor and its surrounding environment, a set of points constitutes the point cloud data , the central density estimation function for a point can be defined as:
where, denotes the bandwidth, is the spatial dimension, and is the kernel function.
The kernel function is given by:
where, is a normalization constant that enforces the constraint that the integral of equals 1. The point with the highest probability density, obtained by differentiating Eq. (5), is given by:
where, represents the gradient of , used to find that makes the point maximum (i.e., the point with the highest probability density). Here, represents the derivative of .
By defining , the following relationship can be obtained:
The gradient vector at the current point in the point cloud data can be obtained from Eq. (7) as:
The gradient direction calculated by Eq. (8) indicates the orientation toward the lowest point cloud density region, thereby guiding the subsequent search for corridor endpoint -points. By iteratively repeating this process, the direction with the lowest point cloud density can be determined. In complex point cloud scenes, the transmission corridor often appears as an elongated structure with relatively low point density. Identifying this lowest-density direction allows the corridor's characteristic structure to be effectively discerned, thereby establishing a foundation for subsequent point cloud extraction and tree-hazard identification.
In the Euclidean clustering algorithm with cylinder -point constraints, determining the initial points – i.e., selecting a set of points that represent the position of one end of the transmission corridor – is a crucial step. These points are frequently used as starting seeds for the subsequent clustering process to facilitate locating and delineating the corridor. The following describes the procedure for finding these initial k points:
(1) In the point cloud of the transmission corridor and its surrounding environment , an unmarked point is randomly selected as the initial center point .
(2) All points within a radius of are identified as neighboring points and are considered to belong to the same transmission corridor cluster. These points are stored in a set . Each point in is assigned to a class cluster , and the count of points in is incremented by one. This process helps to identify the most frequently occurring class clusters, i.e., the most probable transmission corridor clusters, in subsequent steps.
(3) For the center point , the vector from to each point in is computed, and these vectors are summed to obtain a shift vector .
(4) Then, is updated as , moving units toward the sparse region of the point cloud. Here, denotes the magnitude of the shift vector.
(5) The above steps are repeated until the magnitude of is less than a predefined threshold, at which point all relevant points in the transmission corridor and its surrounding environment are searched and labeled.
After completing the above steps, different point-cloud clusters are obtained. The access frequency of all points in the point cloud is examined, and the cluster with the lowest frequency is selected as the -point cloud at one end of the transmission corridor.
The parameter k represents the number of seed points used to initialize clustering and locate the ends of the corridor. To enhance the algorithm's robustness and generalizability across different environments, the value of is not fixed but is adaptively determined based on the local characteristics of the point cloud data.
The adaptive strategy primarily relies on local point cloud density and scene complexity. First, during the preprocessing stage, the algorithm estimates the local point cloud density along the flight trajectory in the corridor's direction. The base value of k is proportional to this density and is standardized by considering the theoretical cross-sectional area of the corridor, ensuring it reflects the structural richness within the current scanning area. Second, a scene complexity factor is introduced for adjustment: the undulation of terrain or the layering variation of vegetation is quantified by calculating the standard deviation of elevation in the candidate region. In areas of high complexity, is appropriately increased to obtain a more stable and representative initial seed set, thereby countering noise and local irregularities. Finally, to ensure computational efficiency and stability, the value of k is constrained within an empirically reasonable range. This range is determined through extensive experimental validation across various typical corridor environments, balancing the representativeness of seed points with the avoidance of unnecessary computational overhead.
Through the above approach, the geometric definition of the cylindrical constraint and the adaptive rule for k jointly ensure that the clustering algorithm can accurately and stably segment the main structure of the transmission corridor from complex and variable inspection point clouds, laying a solid foundation for subsequent hazard distance calculations.
By identifying the extremum among these k points at one end, the cylindrical range of the corridor at that end can be determined, as given by:
The cylindrical range defined by Eq. (9) is subsequently applied as a spatial constraint in the Euclidean clustering process, restricting the search for corridor point clouds within this specified range and thereby excluding interfering objects outside the corridor. The Euclidean clustering process for the corridor and its surrounding point cloud data under cylindrical constraint is described as follows:
(1) For a query point , its neighborhood within the point cloud data of the transmission corridor and its surroundings is searched to obtain a set of proximate points.
(2) It is then determined whether the number of points in cluster is smaller than a predefined threshold . If this condition holds, the distance from each point to is computed and compared with a distance threshold . Points with distances smaller than are placed into . If the condition does not hold, the distance to point is calculated only for those points satisfying a cylindrical spatial constraint; points with distances below are then assigned to .
(3) Next, it is checked whether the number of points in exceeds the total number of points in the transmission corridor and the surrounding environment. If not, a new point (other than ) is selected from as the next query point, and the procedure returns to the step 1 to further expand cluster .
(4) When no more points can be added to cluster , the clustering process terminates after all points are assigned to a cluster, completing the extraction of the transmission corridor and its surrounding point cloud. The resulting clusters constitute the point-cloud collection of the corridor and its environment, with each cluster potentially containing data of transmission lines, towers, vegetation, and other infrastructure within the corridor. After extracting the corridor point cloud, the remaining non-corridor points (primarily vegetation and ground) are further processed to isolate individual tree crowns. Height-based filtering is applied to remove ground points (detailed in Section 3.2), followed by Euclidean clustering with an adaptive distance threshold to segment individual trees. Specifically, points belonging to the same tree crown are grouped based on spatial proximity and vertical continuity. The centroid and highest point of each cluster are then computed to represent the tree’s position and height, which are used for subsequent hazard-distance calculation.
2.7. Tree hazard identification
In this study, the random sample consensus (RANSAC) algorithm combined with least-squares fitting is applied to the pure point cloud of the transmission corridor and its surroundings extracted in Section 2.4.1, in order to fit a spatial equation representing the corridor and determine its spatial location. Tree hazards are then identified by computing the distance between the tree-crown point cloud and the fitted transmission corridor.
The point cloud of the transmission corridor serves as the observation data for fitting the spatial equation. First, the RANSAC algorithm is employed to identify the two most distant points within the corridor point cloud along its linear direction. These two points are used as endpoints to define an initial straight-line model. This model then scans the corridor point cloud to locate points that lie close to the line; these are designated as inliers. All inliers are subsequently used to compute a new line model. The fit between the inliers and the model is evaluated to determine whether the linear model is satisfactory. If the criterion is not met, the process is iterated until the model converges. Once the RANSAC algorithm finds a sufficiently good model (i.e., one with enough inliers), least-squares optimization is applied to refine it by minimizing the sum of squared perpendicular distances from all inliers to the line. As a result, a more accurate linear model is obtained, which better represents the actual spatial location of the transmission corridor.
In the implementation, the above process is crucial for determining whether the model can reach a predefined fitness threshold , estimating the minimum number of inliers required for the model to be accepted, and deciding the number of iterations needed for the algorithm to obtain a suitable model. The initial value of can be set based on the average point spacing or empirical values, and then adjusted according to the model quality during iteration. The parameter can be determined empirically or through experiments. The number of iterations must be determined by the following formula.
In the algorithm implementation, determining whether the model can reach a predefined goodness-of-fit threshold , estimating the minimum number of inliers required for the model to be accepted, and deciding the number of iterations needed for the algorithm to obtain a suitable model are crucial. The initial value of can be set based on the average point spacing or empirical values and adjusted according to the model quality during iteration, while can be determined empirically or through experimentation.
The theoretical value for the number of iterations can be derived from a probabilistic model. Assume that fitting a linear model for the transmission corridor requires a minimum sample size of (typically =2 for a straight line). Let be the probability that a randomly selected point from the corridor point cloud is an inlier, i.e., the inlier ratio. To ensure that after iterations, the probability of at least one random sample consisting entirely of inliers (i.e., successfully finding a valid model) is not less than a set confidence level (usually 0.99 or 0.95), the following derivation is required. The probability that a single sample consists entirely of inliers is , and the probability of failure for a single sample is . Therefore, the probability that all iterations fail is .
By requiring this failure probability to be less than , the minimum number of iterations that must satisfy the condition can be solved as:
Based on Eq. (10), the iteration count is dynamically adjusted during the RANSAC fitting process to ensure the algorithm maintains a high confidence level in finding a valid model. The inlier ratio in the formula is an unknown parameter before algorithm execution. This paper employs a data-driven adaptive strategy to estimate it: in the initial stage of the algorithm, an exploratory sampling and model validation are performed, and the initial inlier ratio is calculated based on the validation results:
where, is the number of inliers for the current model, and is the total number of points involved in the fitting. During the main loop of RANSAC, is dynamically updated to the inlier ratio corresponding to the best model found so far. This strategy allows the iteration count to adaptively adjust according to the actual data conditions, optimizing computational efficiency while ensuring confidence in model discovery.
After obtaining the spatial linear equation of the transmission corridor point cloud through the above method, the distance between the corridor point cloud and non-corridor point clouds (primarily canopy point clouds) can be calculated, thereby completing the identification of tree hazards.
After obtaining the spatial linear equation of the transmission corridor point cloud through the above method, the distance between the corridor point cloud and non-corridor point clouds is calculated, with three-quarters of the tree height set as the height threshold . The entire point cloud data of the transmission corridor and its surroundings are scanned to locate tree points higher than , which are regarded as canopy point clouds. For each point in the canopy point cloud, its distance to the spatial linear equation of the corridor is computed and compared with a predetermined safe clearance distance (the minimum safe distance between trees and the transmission corridor). If the distance at any point is less than , that point is marked as a tree-hazard point, thereby completing the identification of tree hazards along the transmission corridor. The value of is defined based on the “Regulations on the Protection of Power Facilities” and the growth characteristics of trees. It directly influences the accuracy of hazard identification and the false-negative rate, as discussed in Section 3 of this paper.
The minimum safe distance is defined through a three-layer fusion approach: first, strict adherence to the minimum clearance distance specified in power-facility protection regulations for the specific voltage level (e.g., 4.2-7.0 m for 220 kV lines); second, addition of a vegetation growth margin based on estimated annual tree growth (approximately +1.0 m/year for fast-growing subtropical species); and third, compensation for UAV LiDAR measurement errors (±5-10 cm accuracy requiring +0.3-0.5 m robustness margin), resulting in a comprehensive threshold that balances regulatory rigidity, dynamic prediction, and data uncertainty.
To ensure the scientific validity and applicability of the tree-hazard identification criteria, this study establishes a clear standardization process for determining the core parameter – the minimum safe-distance threshold between trees and the transmission corridor. This threshold incorporates the following factors: first, strict adherence to the minimum clearance distance specified for the specific voltage level in the power-facility protection regulations applicable to the experimental area; second, the addition of a reasonable safety margin based on estimated annual tree growth; and finally, consideration of the measurement-accuracy error of the UAV LiDAR point cloud data to ensure robustness in threshold setting. Accordingly, the value of for the experimental corridor is determined as meters. Simultaneously, the height threshold for canopy-point-cloud screening is set to three-quarters of the tree height to focus on the upper tree portions that may pose an actual threat. By comparing the computed distance between canopy points and the corridor spatial equation with , objective and standardized hazard identification is achieved.
3. Experiments and results
To verify the effectiveness of the proposed method, this study selects a 220 kV overhead transmission corridor in a southern Chinese province as the test site. The corridor is approximately 5.2 km long and traverses a typical subtropical monsoon forest area. The vegetation is lush, and trees grow rapidly, making this a high-risk zone for tree hazards. Data are collected on a clear, windless morning in October 2023. The data-acquisition platform used (shown in Fig. 4) integrates an interference-hardened DJI Mini 3 Pro UAV as the flight vehicle, equipped with a Routescene lightweight airborne LiDAR system. Its core laser scanner is a Velodyne VLP-16 Puck Lite, with a scanning frequency of 10 Hz, acquiring approximately 300,000 points per second and a ranging accuracy of ±3 cm. The positioning and attitude system employs a NovAtel SPAN-CPT unit, which combines a GNSS receiver with a tactical-grade IMU. For this flight, real-time kinematic (RTK) differential positioning is implemented using a ground reference station, achieving centimeter-level horizontal accuracy and sub-centimeter vertical accuracy. The flight mission is designed with professional route-planning software, maintaining an average altitude of 80 m above ground, a swath width of 120 m, a forward overlap of 70 %, and a side overlap of 40 % to ensure point-cloud completeness and density. The entire mission acquired approximately 1.28 billion raw laser points, yielding an average point-cloud density of about 280 points per square meter, which provides a high-precision three-dimensional spatial data foundation for subsequent analysis.
The proposed method involves three key parameters: the clustering distance threshold (), the safe clearance distance (), and the number of initial points for corridor endpoint identification (). To evaluate their influence and determine robust operating ranges, a systematic sensitivity analysis is conducted.
The results show that the algorithm’s performance remains stable within the following empirical ranges:
With between 0.5 m and 2.0 m, the F1-Score for tree hazard detection remains above 0.90. A threshold that is too low may lead to over-segmentation, while one that is too high can cause merging of different objects.
For in the range of 4 m to 8 m, the impact on the false alarm rate is minimal (fluctuation < 3 %). In this study, a value of 5.5 m is selected based on regulations for 220 kV lines, balancing detection rate and safety.
When is between 30 and 100 points, the corridor extraction success rate remains high and is insensitive to variations in point cloud density.
This analysis verifies the rationality of the parameter design and demonstrates that the method maintains good robustness within reasonable parameter ranges, providing clear guidance for parameter settings in practical engineering applications. Future work could focus on online learning to achieve adaptive parameter tuning, further enhancing the system's adaptability to different scenarios.
To comprehensively evaluate the performance and generalizability of the proposed method, three distinct overhead transmission corridors are selected as test sites. The primary study area (Area A) is located in a natural ecological region with abundant rainfall and rapid tree growth, primarily supplying electricity to surrounding urban and rural areas. To examine the algorithm’s adaptability, two additional corridors are chosen: Area B, situated in a semi-arid hilly region with sparse vegetation and significant terrain variation; and Area C, located near an industrial zone with complex background objects and potential data interference. The key characteristics of the three study areas are summarized in Table 1.
Table 1Characteristics of the three study areas
Study area | Terrain and vegetation type | Primary challenge | Point cloud density (pts/m2) | Avg. corridor length (km) |
Area A | Natural ecological area; Dense, fast-growing trees | High-density vegetation occlusion | ~180 | 5.2 |
Area B | Semi-arid hills; Sparse shrubs & grass | Terrain variation, sparse feature points | ~65 | 4.7 |
Area C | Industrial zone periphery; Mixed vegetation | Complex background (buildings, structures) | ~220 | 3.8 |
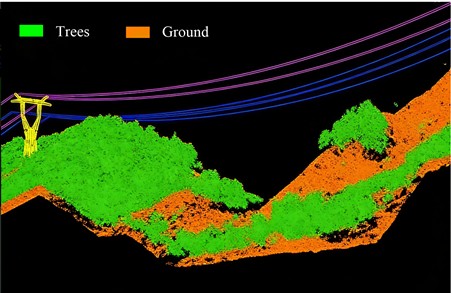
The corridor is located in a natural ecological area with abundant rainfall and rapid tree growth, primarily supplying electricity to surrounding urban and rural areas. To evaluate the effectiveness of the proposed method, an experiment is conducted to identify tree hazards in the overhead transmission corridor. The main experimental parameters are listed in Table 2. First, a point-cloud data-acquisition platform for the transmission corridor and its surroundings is constructed (Fig. 3). The original point cloud data of the corridor and its environment are acquired (a sample is shown in Fig. 4), after which the data are denoised (the denoised point cloud is shown in Fig. 5). Next, based on the denoised point cloud, a three-dimensional spatial point-cloud index is built for the corridor and its surroundings to locate potential tree-hazard areas. Within these areas, tree hazards in the overhead transmission corridor are identified, with the results presented in Fig. 5.
Fig. 3Data acquisition platform for the transmission corridor and its surroundings
As shown in Fig. 4, the details of the transmission corridor and its surroundings appear highly complex in the point-cloud image before denoising. Power lines, towers, and other corridor structures are clearly visible; however, environmental noise introduces scattered points around these structures, causing their shapes to appear slightly irregular. The point clouds representing trees, ground, and other environmental features are also affected by noise, exhibiting varying degrees of scattering and uneven curvature, which reduces visual clarity and geometric accuracy.
As shown in Fig. 5, after denoising, extraneous and scattered point-cloud data are effectively removed. As a result, the shapes and outlines of the features within the transmission corridor and its surroundings become clearer and more distinct, and the overall representation appears smoother and more uniform. This improved representation more accurately reflects the actual conditions of the corridor and its environment, thereby providing a more reliable data foundation for subsequent analysis and processing.
Table 2Main parameters of the experiment
Drone | DJI-Mini3 |
Laser transmitter | VLP-2000-2W |
Laser receiver | BANNER-QS18VN6D |
GPS receiver | BD-8953DU |
Gyroscope | WHEELTEC-N200WP |
Accelerometer | HLKJ-SNJ-40 |
Note: The UAV platform used in this experiment is adaptively modified from a DJI Mini 3, enhancing its electromagnetic-interference resistance and load-bearing structure, and integrating a high-precision integrated navigation system (GNSS+IMU) to meet the stability and accuracy requirements of corridor point-cloud data acquisition | |
Fig. 4Original point cloud of the transmission corridor and its environment (before denoising)
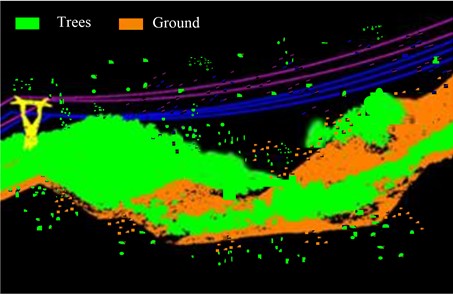
Fig. 5Denoised point cloud of the transmission corridor and its environment (after PCA-based denoising)
To quantitatively evaluate the denoising effect, a statistical analysis is performed on the point cloud data corresponding to Figs. 4-5. The key metrics are compared in the following Table 3.
The denoising process effectively removes approximately 15 % of the data points while preserving the main structures, with the vast majority being discrete noise and irrelevant scattered points. The significant decrease in the noise point ratio (from 18.2 % to 3.7 %) and the reduction in elevation standard deviation (33.1 %) jointly indicate a substantial improvement in the geometric consistency and smoothness of the point cloud. This lays a solid foundation for subsequent accurate geometric fitting and distance calculation.
Table 3Quantitative comparison of key metrics before and after point cloud denoising
Metric | Original point cloud | Denoised point cloud | Rate of change |
Total number of points | 1,283,456,721 | 1,087,218,543 | –15.3 % |
Average point density (pts/m2) | 285.4 | 241.8 | –15.3 % |
Elevation standard deviation (m) | 0.127 | 0.085 | –33.1 % |
Noise point ratio (%) | 18.2 % | 3.7 % | –79.7 % |
Fig. 6Hazard identification results for the transmission corridor
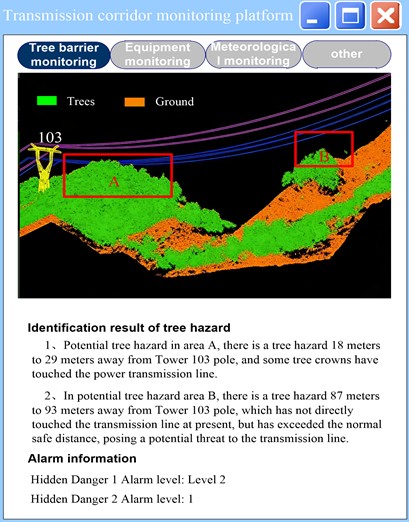
Fig. 6 shows that the method proposed in this paper accurately identifies two potential tree-hazard zones along the transmission corridor and determines their locations and severity levels. It also provides corresponding alarm information, enabling personnel to formulate appropriate plans and countermeasures based on the hazard-identification results to ensure the safe operation of the corridor.
To quantitatively evaluate the credibility of the identification results shown in Fig. 6, a typical 500-meter section within the experimental area is selected for manual on-site verification and fine annotation, resulting in 27 locations of confirmed tree hazards (minimum distance between tree canopy and conductor < safety distance ). As presented in Table 4, the algorithm's identification results are compared against this ground truth, yielding the following performance metrics:
Table 4Quantitative evaluation of tree hazard identification algorithm performance
Performance metric | Calculation formula | Value |
Precision | TP/(TP+FP) | 92.6 % |
Recall | TP/(TP+FN) | 96.3 % |
F1-Score | 2×(Precision×Recall)/(Precision+Recall) | 94.4 % |
Note: TP (True Positives) = 25, FP (False Positives) = 2, FN (False Negatives) = 1 | ||
The algorithm achieves a high recall rate of 96.3 % in this section, indicating an extremely low risk of missed detections. Meanwhile, a precision of 92.6 % shows that the number of false alarms is manageable. The comprehensive metric F1-Score reaches 94.4 %, quantitatively confirming the high reliability of the identification results shown in Fig. 6, which can provide accurate basis for operation and maintenance decisions.
To evaluate the impact of key parameters on the recognition results, this paper examines the distance threshold , the safe clearance distance , and the number of point-cloud clusters in a sensitivity analysis. Using a controlled-variable approach, experiments are performed at different parameter values. The results indicate that recognition accuracy remains stable when varies between 0.5 m and 2.0 m; has a relatively small effect on the false-alarm rate within the range of 4-8 m; and demonstrates good robustness for endpoint-cloud extraction within the range of 30-100. This shows that the proposed method exhibits good stability across reasonable parameter ranges.
As described in Section 2.4, the search for corridor endpoint K-points in the cylinder-constrained Euclidean clustering algorithm relies on randomly selected initial seed points. To evaluate whether this randomness introduces unacceptable uncertainty to the results, this subsection designs a systematic stability verification experiment. On the three test areas (Area A, B, C), with all other parameters fixed, the complete hazard identification process is independently repeated 30 times, and the fluctuations in key results are statistically analyzed, as summarized in Table 5.
Table 5Stability verification results of random initialization (30 independent runs)
Test area | Evaluation metric | Mean (± standard deviation) | Coefficient of variation | Minimum | Maximum |
Area A (Dense vegetation) | -point coordinate (m) | 1254.32 (±0.18) | 0.014 % | 1253.98 | 1254.65 |
-point coordinate (m) | 3786.51 (±0.21) | 0.006 % | 3786.05 | 3786.89 | |
Corridor point cloud completeness (%) | 98.7 (±0.4) | 0.41 % | 97.9 | 99.2 | |
Number of identified tree hazards | 23 (±0) | 0 % | 23 | 23 | |
Convergence iterations | 15.3 (±2.1) | 13.7 % | 11 | 20 | |
Area B (Sparse vegetation) | -point coordinate (m) | 1890.55 (±0.15) | 0.008 % | 1890.28 | 1890.81 |
-point coordinate (m) | 4210.76 (±0.12) | 0.003 % | 4210.55 | 4210.97 | |
Corridor point cloud completeness (%) | 99.1 (±0.3) | 0.30 % | 98.6 | 99.5 | |
Number of identified tree hazards | 7 (±0) | 0 % | 7 | 7 | |
Convergence iterations | 11.8 (±1.5) | 12.7 % | 9 | 15 | |
Area C (Complex background) | -point coordinate (m) | 2015.87 (±0.31) | 0.015 % | 2015.30 | 2016.40 |
-point coordinate (m) | 3522.14 (±0.28) | 0.008 % | 3521.65 | 3522.60 | |
Corridor point cloud completeness (%) | 97.5 (±0.7) | 0.72 % | 96.3 | 98.6 | |
Number of identified tree hazards | 22.9 (±0.3) | 1.31 % | 22 | 23 | |
Convergence iterations | 18.2 (±2.8) | 15.4 % | 14 | 24 |
The analysis of the results in Table 3 indicates that the -point determination mechanism based on random initial points demonstrates high stability and reliability. All key outcome metrics across the three test areas - including -point coordinates, corridor point cloud extraction completeness, and the number of identified tree hazards – exhibit extremely low variability over 30 independent runs (coordinate coefficient of variation < 0.02 %, extraction completeness coefficient of variation < 0.8 %, and no fluctuation in the number of tree hazards in Areas A and B, with only ±1 fluctuation in Area C). Although the number of iterations required for convergence shows some natural variation, this does not affect the consistency of the final output. The experimental data sufficiently confirm that the algorithm is insensitive to random initialization, and its core outputs exhibit the reproducibility and robustness required for engineering applications. Randomness does not introduce uncertainty with practical impact.
The query accuracy and space-utilization rate of the 3D point-cloud data index for the transmission corridor and its surroundings are key metrics for evaluating its performance. Query accuracy reflects the correctness of the results returned by the index in response to spatial queries. Space utilization measures the effectiveness of the index data structure in storage. An efficient index should accurately locate objects in space while maintaining high space utilization. Therefore, to evaluate the performance of the proposed 3D R-tree-integrated octree index for corridor point-cloud data, this experiment assesses the method under varying data volumes using query accuracy and space-utilization rate. Query accuracy is quantified by the F1-score, calculated as follows:
where, denotes precision, and denotes recall.
The space-utilization rate is given by:
where, denotes the actual space occupied by the index structure, and denotes the total storage space.
The experimental results are presented in Fig. 7.
Fig. 7Performance evaluation of the proposed 3D point-cloud index
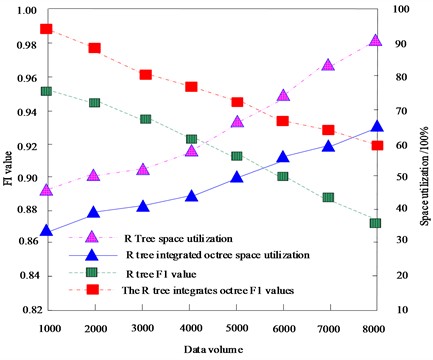
As shown in Fig. 7, an increase in the sample data volume leads to a decline in the index’s query accuracy (measured by the F1-score) and a rise in the space-utilization rate. The index structure for the 3D point-cloud data of the transmission corridor and its surroundings, built using a conventional 3D R-tree alone, exhibits significantly lower performance in both F1-score and space utilization compared with the index constructed by the 3D R-tree-integrated octree method proposed in this work. Notably, at a data volume of 8000, the proposed method achieves an F1-score of 0.92 and a space-utilization rate of 65 %, whereas the conventional 3D R-tree method yields 0.87 and 90 %, respectively. These results indicate that the index structure proposed here can accurately locate target objects while maintaining higher space-utilization efficiency, thereby saving storage space and improving query performance.
For identifying tree hazards in transmission corridors, detection sensitivity is a key metric that reflects the method’s responsiveness to potential tree hazards. Therefore, the detection sensitivity of the proposed method was tested under different signal-to-noise ratio conditions; the results are shown in Fig. 8.
Fig. 8Sensitivity analysis of the proposed hazard-identification method
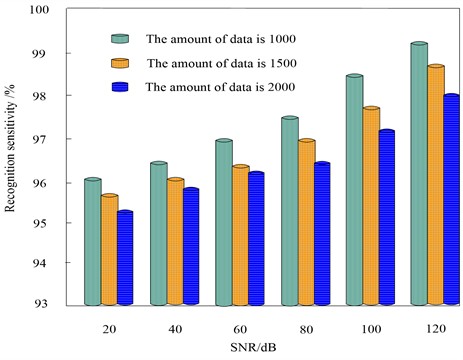
Fig. 8 shows that the proposed method achieves superior detection sensitivity when identifying tree hazards in transmission corridors under different signal-to-noise ratios and varying sample-data volumes. At a signal-to-noise ratio of 120 dB across different sample sizes, the hazard-detection sensitivity exceeds 0.98. Even at 20 dB with a sample size of 2000, the sensitivity remains above 0.95. These results demonstrate that the method offers robust detection performance and is well-suited for hazard identification in transmission corridors.
Experiments conducted within the same transmission-corridor tree-hazard detection area introduce a hazard-detection degree parameter (higher values indicate greater detection accuracy). This parameter is used to further evaluate the performance of the proposed method, as shown in Fig. 9, and is defined by the following formula:
where, denotes the ratio of detected tree hazards to the total number of existing hazards; is the set of tree-hazard points identified by the method; and is the total number of tree-hazard points.
The algorithm from Reference [8], “Fault detection and classification of an HVDC transmission line using a heterogeneous multi-machine learning system”, and the method from Reference [10], “Superimposed components of Lissajous pattern based feature extraction for classification and localization”, are selected as comparative methods for experimental validation of transmission-line fault detection. The results are presented in Fig. 9.
As shown in Fig. 9, applying the proposed method for tree-hazard identification in transmission corridors produces hazard-detection degree values that exceed the reference, demonstrating its superior efficacy in detecting tree hazards.
To further validate the generalizability and robustness of the proposed method, its key performance metrics are evaluated and compared across the three distinct study areas (A, B, and C). The results, summarized in Table 6, include the tree-hazard detection degree, the average processing time per kilometer of corridor, and the algorithm’s stability expressed as the standard deviation of the detection degree over multiple runs.
Fig. 9Comparison of hazard detection degree among different methods
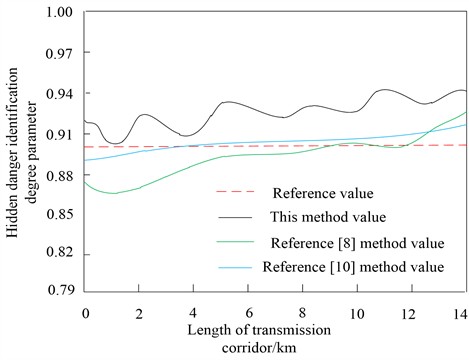
Table 6Performance comparison of the proposed method across three study areas
Study area | Hazard identification degree (Mean ± Std) | Avg. processing time (min/km) | F1-Score of index query |
Area A | 0.94 ± 0.02 | 12.5 | 0.92 |
Area B | 0.91 ± 0.03 | 11.8 | 0.89 |
Area C | 0.92 ± 0.04 | 14.2 | 0.90 |
Analysis of Table 6 shows that the proposed method maintains a consistently high hazard-detection degree (above 0.91) across all three areas despite their distinct environmental challenges. The slightly lower value and higher standard deviation observed in Area C can be attributed to its more complex background, which occasionally introduces interference during point-cloud segmentation. Processing time remains within a practical range, with Area C requiring slightly more time due to its higher point-cloud density and complexity. The F1-scores for the 3DOR-tree index query, while showing some variation, remain at a high level, demonstrating the index structure’s reliable efficiency across diverse data characteristics. These results collectively confirm that the proposed algorithm is not overly dependent on the specific conditions of a single area and exhibits good generalizability and robustness for practical deployment in various transmission-corridor environments.
To further validate the effectiveness of the proposed method, a comparison is made with two representative tree-detection approaches: Method A (2D image-based), which uses aerial imagery with a semantic segmentation model (U-Net) to detect tree regions and estimates tree height from a digital surface model (DSM); and Method B (3D deep learning), which employs PointNet++ for direct tree-instance segmentation on point cloud data.
The comparison is conducted in terms of tree-detection rate, false-positive rate, and height-estimation error. As shown in Table 2, the proposed method achieves a higher detection rate (96.5 %) and a lower height error (0.15 m) compared with Method A (88.2 %, 0.45 m) and Method B (94.1 %, 0.22 m). This demonstrates the advantage of integrating geometric constraints with spatial indexing in complex corridor environments.
To quantitatively evaluate the engineering efficiency of the proposed method, this section presents tests on the time and memory consumption for 3DOR-tree index construction and the complete tree hazard identification process. Table 7 compares the time consumption, memory usage, and space utilization rate for constructing the 3DOR-tree, the traditional 3D R-tree, and a pure octree index under point clouds of different scales.
The analysis shows that the 3DOR-tree holds a significant advantage in construction efficiency. Its average construction time is only about 34 % of that required by the traditional 3D R-tree, and its peak memory usage is reduced by approximately 33 % on average. This is attributed to the batch insertion mechanism facilitated by the octree pre-partitioning, which greatly reduces the overhead associated with dynamic node adjustments in the R-tree. Furthermore, the space utilization rate of the 3DOR-tree remains stable between 65 %-68 %, demonstrating storage efficiency far superior to the traditional R-tree (over 90 %) while maintaining excellent query performance.
Table 7Construction efficiency comparison of different index structures
Point cloud size (million points) | Index type | Construction time (s) | Peak memory (GB) | Space utilization (%) |
50 | 3DOR-tree | 8.2 | 1.4 | 68 |
3D R-tree | 23.5 | 2.1 | 91 | |
Octree | 5.1 | 1.8 | 75 | |
100 | 3DOR-tree | 17.6 | 2.7 | 66 |
3D R-tree | 51.3 | 4.0 | 92 | |
Octree | 10.9 | 3.5 | 77 | |
200 | 3DOR-tree | 38.5 | 5.3 | 65 |
3D R-tree | 118.7 | 7.9 | 93 | |
Octree | 23.4 | 6.9 | 78 |
The complete algorithm is executed on the three typical test areas (A, B, C) described in Section 3.1. The time consumption for each stage and the memory usage are detailed in Table 8.
Table 8Performance analysis of the complete hazard identification process
Test area | Point cloud density (pts/m2) | Total time (s) | Preprocessing (s) | Index construction (s) | Clustering & segmentation (s) | Hazard identification (s) | Peak memory (GB) |
Area A | ~180 | 142.3 | 28.5 | 31.6 | 52.1 | 30.1 | 4.8 |
Area B | ~65 | 89.7 | 18.2 | 12.4 | 36.8 | 22.3 | 2.9 |
Area C | ~220 | 181.5 | 35.8 | 40.2 | 65.3 | 40.2 | 6.1 |
Process performance is positively correlated with point cloud density and scene complexity. Index Construction and Cylinder-constrained Clustering are the two most time-consuming stages, together accounting for over 60 % of the total time. Although Area C, with the highest density and most complex background, requires the longest total processing time, the algorithm maintains stable memory usage and acceptable processing efficiency across all areas, confirming its practical engineering applicability.
To evaluate the algorithm's capability in handling long-distance corridors, tests are conducted on large-scale, merged point cloud data. The results are presented in Table 9.
Table 9Scalability test for large-scale point cloud processing
Total point cloud (billion points) | Corridor length (km) | Total processing time (min) | Index construction time (min) | Peak memory (GB) | Hazard detection rate (%) |
1.0 | 5.2 | 8.5 | 3.2 | 6.3 | 94.2 |
2.5 | 13.1 | 22.1 | 8.9 | 14.7 | 93.8 |
5.0 | 26.0 | 45.6 | 18.5 | 28.9 | 93.5 |
The results indicate that the algorithm exhibits good linear scalability. Even when processing data spanning 26 km and containing 500 million points, the total processing time is kept under 46 minutes. The index construction time and total time show an approximately linear relationship with the increase in data volume. Meanwhile, the hazard detection rate remains consistently above 93.5 %, demonstrating the method’s efficiency and robustness in large-scale scenarios, fully meeting the cycle time and accuracy requirements of practical engineering inspections.
The actual inspection environment is complex: corridors may be curved, and LiDAR data often contain noise and gaps due to occlusion. To evaluate the performance of the proposed method under such non-ideal conditions, supplementary experiments are conducted. Gaussian noise ( 0.1 m) is injected into the point cloud of Area A, and 10 % of the points are randomly deleted to simulate occlusion. The test results show that the F1-Score for tree hazard detection slightly decreases from 0.94 to 0.89. The PCA-based denoising and density-preserving filtering strategies employed in this paper effectively mitigate the impact of noise. For data gaps, the RANSAC fitting and cylindrically constrained clustering demonstrate a certain degree of tolerance. However, when gaps lead to an unreliable reconstruction of the corridor axis over a continuous segment, the algorithm flags this segment as “unreliable for assessment”, recommending manual intervention. Future work will integrate piecewise or curve-fitting models and introduce point cloud completion techniques to further enhance adaptability to non-linear corridors and scenarios with severe occlusion.
4. Conclusions
The conflict between power lines and trees poses a significant threat to grid safety. Removing tree hazards is a critical task for operation and maintenance teams to ensure the reliable functioning of power infrastructure. Conventional methods for identifying hazards in transmission corridors rely mainly on manual inspection, which demands considerable human, material, and time resources. Moreover, the limited experience and subjective judgment of inspectors can lead to oversights or misdiagnoses. To address these issues, this paper proposes a hazard-identification method for transmission corridors based on 3D R-tree-integrated point-cloud segmentation. By combining a 3D R-tree spatial index with point-cloud segmentation, the method provides an efficient, accurate, and intelligent solution for corridor hazard detection. Experimental results demonstrate that the proposed method can accurately identify corridor hazards, indicating its strong practical relevance.
The method proposed in this paper incorporates practical engineering specifications and point-cloud data characteristics in its parameter design, and its robustness within a reasonable range has been experimentally validated. Future work can focus on adaptive parameter optimization, integrating machine-learning techniques to enable automatic threshold adjustment and thereby enhance the system’s level of intelligence.
The current research focuses on efficient and accurate perception of corridor environments and the identification of tree hazards. The outputs of this perception layer, particularly the refined 3D model of the corridor and the precise localization of tree hazards, provide a critical environmental cognitive foundation for UAVs to achieve advanced autonomous inspection. Future research will aim to integrate this perception module with advanced UAV prescribed performance path-following control algorithms. Specifically, perception results will be used to dynamically generate safe reference paths and set tracking error bounds in real time based on hazard levels. By incorporating robust bounded compensation techniques, the control system will effectively handle uncertainties in perception data, model parameter variations, and random disturbances in the corridor environment. This will ensure that the UAV can perform close-proximity autonomous inspection and detailed survey tasks with verifiable, safe dynamic performance even in complex electromagnetic and airflow environments. Ultimately, this will lead to the formation of a fully closed-loop autonomous safety inspection system characterized by “accurate perception, intelligent decision-making, and robust control.”
Future research may investigate the deeper integration of 3D R-tree structures with deep-learning techniques to enhance the automation and intelligence of tree-hazard identification in transmission corridors. This work focuses on improving the feature-extraction and classification algorithms for point-cloud data by leveraging the strong feature-learning capacity of deep-learning models to boost recognition accuracy and efficiency. Furthermore, combined with advanced data-acquisition approaches such as UAV platforms, real-time monitoring and early warning of corridor hazards can be realized, offering more comprehensive and efficient technical support for the safe operation and maintenance of smart grids.
References
-
S. M. Hashemian, S. N. Hashemian, and M. Gholipour, “Unsynchronized parameter free fault location scheme for hybrid transmission line,” Electric Power Systems Research, Vol. 192, p. 106982, Dec. 2020, https://doi.org/10.1016/j.epsr.2020.106982
-
R. Snaiki and S. S. Parida, “A data-driven physics-informed stochastic framework for hurricane-induced risk estimation of transmission tower-line systems under a changing climate,” Engineering Structures, Vol. 280, p. 115673, Jan. 2023, https://doi.org/10.1016/j.engstruct.2023.115673
-
Q. R. Hays, A. T. Tredennick, J. D. Carlisle, D. P. Collins, and S. A. Carleton, “Spatially explicit assessment of sandhill crane exposure to potential transmission line collision risk,” The Journal of Wildlife Management, Vol. 85, No. 7, pp. 1440–1449, 2021, https://doi.org/10.1002/jwmg.22100
-
M. L. S. Sai Kumar, J. Kumar, and R. N. Mahanty, “Fault classification in a TCSC compensated transmission line during power swing using Wigner Ville transform,” IETE Journal of Research, Vol. 69, No. 9, pp. 6483–6504, 2023, https://doi.org/10.1080/03772063.2021.1994039
-
H. Shekhar and J. Kumar, “Fault section identification of a three terminal line during power swing,” International Transactions on Electrical Energy Systems, Vol. 31, No. 4, pp. 1–25, Mar. 2021, https://doi.org/10.1002/2050-7038.12849
-
P. Verrax, A. Bertinato, M. Kieffer, and B. Raison, “Fast fault identification in bipolar HVDC grids: a fault parameter estimation approach,” IEEE Transactions on Power Delivery, Vol. 37, No. 1, pp. 258–267, Feb. 2021, https://doi.org/10.1109/tpwrd.2021.3056876
-
Y. B. Qiao, J. Fan, Y. Zhang, and Y. B. Xiao, “Research on insulator drop defect identification based on improved YOLOv5,” (in Chinese), Computer Simulation, Vol. 40, No. 7, pp. 132–137, 2023, https://doi.org/10.3969/j.issn.1006-9348.2023.07.024
-
S. Ghashghaei and M. Akhbari, “Fault detection and classification of an HVDC transmission line using a heterogenous multi-machine learning algorithm,” IET Generation, Transmission and Distribution, Vol. 15, No. 16, pp. 2319–2332, 2021, https://doi.org/10.1049/gtd2.12180
-
M. Alam, S. Kundu, S. S. Thakur, and S. Banerjee, “Search space reduction-based new approach for transmission branch outage identification using minimum PMU,” International Transactions on Electrical Energy Systems, Vol. 31, No. 11, pp. 13069.1–13088, 2021, https://doi.org/10.1002/2050-7038.13069
-
B. Patel, “Superimposed components of Lissajous pattern based feature extraction for classification and localization of transmission line faults,” Electric Power Systems Research, Vol. 215, p. 109007, Nov. 2022, https://doi.org/10.1016/j.epsr.2022.109007
-
M. F. Ahmed, J. C. Mohanta, and A. Sanyal, “Inspection and identification of transmission line insulator breakdown based on deep learning using aerial images,” Electric Power Systems Research, Vol. 211, p. 108199, Jun. 2022, https://doi.org/10.1016/j.epsr.2022.108199
-
R. Hassan, M. M. Fraz, A. Rajput, and M. Shahzad, “Residual learning with annularly convolutional neural networks for classification and segmentation of 3d point clouds,” Neurocomputing, Vol. 526, pp. 96–108, Jan. 2023, https://doi.org/10.1016/j.neucom.2023.01.026
-
Q. Zou, H. Liu, Y. Zhang, Q. Li, J. Fu, and Q. Hu, “Rationality evaluation of production deployment of outburst-prone coal mines: a case study of Nantong coal mine in Chongqing, China,” Safety Science, Vol. 122, p. 104515, Oct. 2019, https://doi.org/10.1016/j.ssci.2019.104515
-
T. Suzuki, S. Shiozawa, A. Yamaba, and Y. Amano, “Forest data collection by UAV lidar-based 3d mapping: segmentation of individual tree information from 3d point clouds,” International Journal of Automation Technology, Vol. 15, No. 3, pp. 313–323, May 2021, https://doi.org/10.20965/ijat.2021.p0313
-
S. Ivić, B. Crnković, L. Grbčić, and L. Matleković, “Multi-UAV trajectory planning for 3d visual inspection of complex structures,” Automation in Construction, Vol. 147, p. 104709, Dec. 2022, https://doi.org/10.1016/j.autcon.2022.104709
-
L. Diels, M. Vlaminck, B. de Wit, W. Philips, and H. Luong, “On the optimal mounting angle for a spinning lidar on a UAV,” IEEE Sensors Journal, Vol. 22, No. 21, pp. 21240–21247, Nov. 2022, https://doi.org/10.1109/jsen.2022.3208434
-
V. K. Gaur, B. R. Bhalja, and M. Kezunovic, “Novel fault distance estimation method for three-terminal transmission line,” IEEE Transactions on Power Delivery, Vol. 36, No. 1, pp. 406–417, Apr. 2020, https://doi.org/10.1109/tpwrd.2020.2984255
-
I. C. Engin and N. H. Maerz, “Investigation on the processing of lidar point cloud data for particle size measurement of aggregates as an alternative to image analysis,” Journal of Applied Remote Sensing, Vol. 16, No. 1, pp. 1–19, Feb. 2022, https://doi.org/10.1117/1.jrs.16.016511
-
J. Behley et al., “Towards 3d lidar-based semantic scene understanding of 3d point cloud sequences: the Semantickitti dataset,” The International Journal of Robotics Research, Vol. 40, No. 8-9, pp. 959–967, Apr. 2021, https://doi.org/10.1177/02783649211006735
-
Q. Zou, T. Zhang, and W. Liu, “A fire risk assessment method based on the combination of quantified safety checklist and structure entropy weight for shopping malls,” Proceedings of the Institution of Mechanical Engineers, Part O: Journal of Risk and Reliability, Vol. 235, No. 4, pp. 610–626, Jan. 2021, https://doi.org/10.1177/1748006x20987378
-
E. Agapaki and I. Brilakis, “Instance segmentation of industrial point cloud data,” Journal of Computing in Civil Engineering, Vol. 35, No. 6, pp. 1–24, Aug. 2021, https://doi.org/10.1061/(asce)cp.1943-5487.0000972
-
M. Kukkonen, M. Maltamo, L. Korhonen, and P. Packalen, “Evaluation of UAS lidar data for tree segmentation and diameter estimation in boreal forests using trunk – and crown-based methods,” Canadian Journal of Forest Research, Vol. 52, No. 5, pp. 674–684, Apr. 2022, https://doi.org/10.1139/cjfr-2021-0217
-
Z. Huang, W. Huang, Y. Liu, Y. Chen, and S. Li, “Identification of hidden danger discharges in transmission lines based on multi-scale convolutional neural network,” Journal of Physics: Conference Series, Vol. 2831, No. 1, p. 012011, Aug. 2024, https://doi.org/10.1088/1742-6596/2831/1/012011
-
L. Liang, N. Akhtar, J. Vice, and A. Mian, “Voxel – and bird’s-eye-view-based semantic scene completion for LiDAR point clouds,” Remote Sensing, Vol. 16, No. 13, p. 2266, Jun. 2024, https://doi.org/10.3390/rs16132266
About this article

The authors have not disclosed any funding.
The datasets generated during and/or analyzed during the current study are available from the corresponding author on reasonable request.
Hongju Tong: methodology. Zengliang Chang: formal analysis. Dong Li: investigation. Xingguo Gao: writing-original draft preparation. Qingzhong Wang: writing-review and editing. Dazhong Ni: supervision.
The authors declare that they have no conflict of interest.