Abstract
In response to the difficulty of fault diagnosis of gearbox under time-varying speed conditions, this paper presents a novel approach for diagnosing gearbox faults in time-varying speed, utilizing an improved gate recurrent unit (GRU), which adds attention gate mechanism and cyclic dropout learning strategies on the basis of the GRU, and constructs a new model named as gated recurrent dropout attention unit (GRDAU). By introducing attention gate mechanism to realize allocating weights dynamically, focusing on key features, and enhancing GRU’s ability to capture important information. In addition, the designed cyclic dropout learning strategy reduces excessive dependence on specific hidden states by randomly discarding some hidden state information. Finally, the robustness and excellent interference suppression ability of the proposed method were verified through case analysis of a gearbox under time-varying speed, and the diagnostic accuracy of the method is as high as 99.78 %. Comparative experiments were conducted to validate its superior performance and stronger generalization ability compared to existing advanced diagnostic methods.
1. Introduction
As a crucial component of mechanical transmission systems, gearboxes are widely used in various fields such as industrial automation, aerospace, automotive manufacturing, and mining [1, 2]. Its main function is to transmit power and adjust speed, and the operational stability and reliability of the gearbox directly affect the performance of the entire mechanical system. With the increasing demand for equipment operation efficiency and reliability in modern industry, timely fault diagnosis and predictive maintenance of gearboxes have become a popular research topic [3, 4].
Due to the influence of speed changes, the collected signals will exhibit extremely strong non-stationary characteristics, which makes it difficult for traditional signal processing and feature extraction methods to extract effective fault features from them [5]. To effectively tackle this challenge, advanced professional processing techniques being fit for non-stationary signals must be adopted. Several frequently employed techniques for dealing with fluctuating rotational speeds encompass order tracking algorithms [6], algorithms for analyzing time - frequency characteristics [7], deep learning [8], and so on. Among them, the order tracking algorithm converts vibration signals into angular domain signals for spectral analysis, and extracts key rotational frequency information. Even with changes in rotational speed, this algorithm can track and identify vibration components of different orders accurately. Li et al. proposed an order autocorrelation tracking algorithm, which effectively highlights the fault information buried in the speed variation by improving the speed signal acquisition, fault signal acquisition, and angular domain resampling methods, that is, only the speed signal is needed to achieve fault diagnosis [9]. Lin et al. proposed a data augmentation algorithm based on order tracking, which utilizes the angular domain invariance of order tracking to generate analog signals through time-domain resampling, in order to solve the related problems of time-varying speed [10]. However, this type of method relies heavily on expert experience, which limits its application scope.
The time-frequency analysis approach is capable of conducting self-adjusting time-frequency decomposition according to the local time - variant features of the signal. By removing the influence of subjective factors, it can achieve an exceptionally high level of time-frequency resolution, which is very suitable for analyzing non-stationary signals. Xing et al. proposed a filtering Wigner Wiley distribution (WVD) time delay estimation method that significantly improves analysis accuracy while maintaining high time-frequency resolution [11]. Wang et al. enhanced time-frequency features through image processing methods such as grayscale, Roberts edge detection, and Hough transform, and accurately identified time-frequency ridges at different rotational speeds [12]. Reference [13] proposed an engine operating state discrimination method based on time-frequency feature statistical analysis and Euclidean distance metrics. However, this type of method has high complexity and is easily affected by external interference signals, and there are strong subjective factors in practical applications.
In summary, manual operations and expert experience are frequently the cornerstones of order tracking and time-frequency analysis algorithms. However, when confronted with complex time-varying signals, this approach may introduce bias and result in inconsistent performance. Therefore, deep learning and transfer learning techniques, which are capable of end-to-end learning, are increasingly substituting the above two mentioned traditional methods. The study presented a method for identifying the reliability state of diesel engines by utilizing artificial neural networks (ANNs) [14]. Zhu Peng et al. proposed a rolling bearing fault diagnosis method using residual attention mechanism and domain adaptive unsupervised transfer learning, which achieved an average recognition accuracy of over 93 % under time-varying speeds [15]. Shao et al. developed a dual - threshold attention generative adversarial network for generating high-quality infrared thermal imaging pictures, which aimed to resolve the small-sample fault diagnosis problem in rotor bearing systems operating at time - varying rotational speeds [16]. However, due to the extremely unstable signals caused by large speed fluctuations, fault diagnosis of time-varying speed gearboxes based on deep learning faces greater challenges. To address this complex issue, this paper proposes a time-varying speed gearbox fault diagnosis method based on GRDAU. The GRADU effectively captures the changing patterns of signals by deeply exploring potential sensitive features in time-varying signals, thereby achieving higher diagnostic accuracy. This article makes the following key contributions:
1) A thorough end-to-end gearbox fault diagnosis network called GRDAU is proposed, which innovatively incorporates attention gate mechanism and loop dropout strategy into the traditional GRU architecture.
2) The designed attention gate mechanism can automatically focus on the key features in the gearbox vibration signal under time-varying speed conditions, effectively improving the accuracy of feature extraction. Meanwhile, the introduction of cyclic dropout learning strategy has shown excellent performance in preventing overfitting and enhancing model generalization ability, significantly improving the stability and reliability of fault diagnosis network.
3) The proposed method will be compared and analyzed with advanced methods for handling time-varying speeds. Through comprehensive experiments and rigorous evaluations, the superiority of the proposed network in fault diagnosis accuracy has been verified.
The paper is organized as follows: Sections 2 and 3 focus on the theoretical framework of GRDAU, presenting the flowchart of the proposed method and conducting a case study. Furthermore, Section 3 contains a comparative analysis, and Section 4 offers the final conclusions.
2. The basic theories and flow chart of the proposed method
2.1. GRDAU
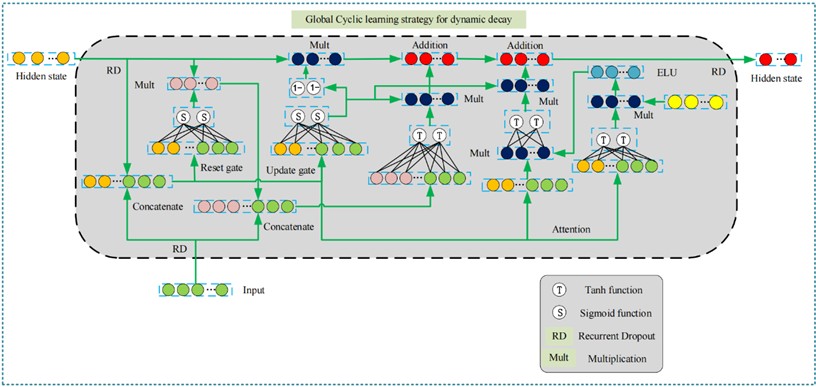
GRU is a variant of Recurrent Neural Network (RNN) that utilizes gating mechanisms to accurately screen and selectively remember information. Compared to traditional RNNs, GRU has a simpler and more efficient design, faster computation speed, and significant performance in processing long sequence data. By precisely controlling the update and reset gates, GRU can capture long-range dependencies and avoid gradient vanishing or explosion problems. However, GRU may have limited performance in long-term memory tasks, and gating mechanisms can sometimes be difficult to accurately select information, affecting the accuracy and generalization ability of the model. Therefore, in order to further enhance the performance and applicability of GRU, a novel GRDAU is proposed. By introducing attention gate mechanism and loop dropout learning strategies into GRU, GRDAU can more effectively capture important information in input data and significantly enhance the memory and generalization abilities of GRU models. The detailed calculation is as follows:
In the above equations, RD represents performing Recurrent Dropout on the input data. represents the obtained data after RD. represents the hidden state at the instant , and then perform RD on . and refers to the sigmoid function and the hyperbolic tangent function. and represents the output of the reset gate and update gate respectively. , , , , and are weight matrices, , and are bias matrices. represents the temporary hidden state at instantaneous time . represents dot product. Among them, is the attention rating function, where is the additive parameter on the attention mechanism, and is the weight matrix related to the rating function, and is the weight matrix related to the output of , and represents the attention distribution vector.
From the above formulas, it can be seen that the hidden state contains richer and more valuable information. Through the operation, more representative features can be highlighted, thereby improving the representation ability of the model. Therefore, in the face of various interferences and insufficient training samples, the GRDAU network can still demonstrate good feature extraction ability.
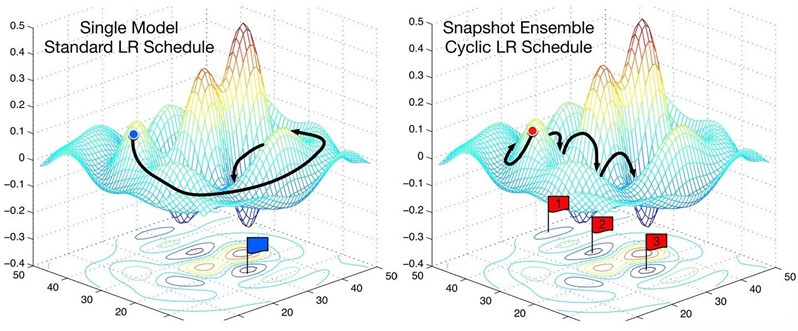
Learning rate is an important hyperparameter in the training of deep learning network. As an adaptive method, cyclic learning rate can improve the classification performance of neural networks in strong noise environments. Compared to adaptive learning rates, this method has less computational complexity and is easier to implement. It is not simply reducing the learning rate, but by setting reasonable boundary values, allowing the learning rate to cyclically vary throughout the entire network training. This method fundamentally eliminates the scheduling requirement for the optimal global learning rate and can further improve classification accuracy without the need for tuning during model training. Inspired by reference [19], this paper integrates a new learning strategy in GRDAU, namely the global cyclic learning strategy, which improves on the periodic learning rate and retains global optimization to integrate with the designed network. In order to make the learning rate more flexible, the principle of linear scaling index is adopted to make the learning rate no longer a fixed value. That is, the designed cycle length is defined as . The learning rate of the previous step is defined as a linear increase stage, and the learning rate of the subsequent step is defined as a linear decrease stage. Therefore, the number of cycles in the th iteration is as following:
in which refers to rounding down the number of cycles, and the learning rate after the th iteration is as following:
in which and refer to the maximum and minimum values of the learning rate in the cycle, and they can be decreased with the increasing of . could be calculated by using the following equation:
In order to better adapt to the network model, the learning rate is reset to a pre-set value after a certain interval of iterations during the training iteration process in the global cyclic learning strategy. The learning rate after the th iteration is as following:
Based on the initial value set, the learning rate of the model will gradually decrease during the training process. Fig. 1 shows the changes in conventional learning rate and global cyclic learning rate. This change is undoubtedly beneficial as it enables the model to adapt to time-varying speeds, thereby improving classification accuracy.
Fig. 1Comparison of different learning rate mechanisms
In summary, the designed GRDAU network structure is shown in Fig. 2 by introducing attention gate mechanism and cyclic dropout learning strategies into traditional GRU models. It can be observed that the model can selectively receive and utilize input features at the current time when data passes through the input gate. By dynamically adjusting the update gate, the model can retain or update its hidden state as needed at different times to adapt to the information changes caused by time-varying speeds. The role of the reset gate is to govern the influence exerted by the hidden state information from the prior time instant on the candidate hidden states at the present time instant. The designed attention gate aims to enable the model to focus on the key parts of network feature extraction, improving computational efficiency. The RD operation is applied to multiple positions such as input, output, and hidden states, which improves the generalization ability of the model. RD randomly discards some input features during the input stage, so that the model does not overly rely on certain specific input features, enhancing the robustness of the model to changes in input features. RD randomly discards some output information during the output stage to avoid excessive fitting of the model to the training dataset and enhance its performance generalization on novel test data. RD introduces random dropout in the update process of implicit states to avoid the model's excessive dependence on historical state information and promote the model to effectively update and utilize new information at each time step. In addition, exponential linear units (ELUs) are introduced in GRU to replace the traditional activation function as a non-linear mapping of the attention gate after the information flow passes through the update gate and reset gate, obtaining a stronger non-linear expression to alleviate the gradient vanishing problem. Through the design of the above structure and strategy, the GRDAU network can effectively extract fault features from gearbox vibration signals under time-varying speed conditions, improving the accuracy and stability of fault diagnosis.
Fig. 2The structure of the GRDAU network
2.2. Flow chart of the proposed method
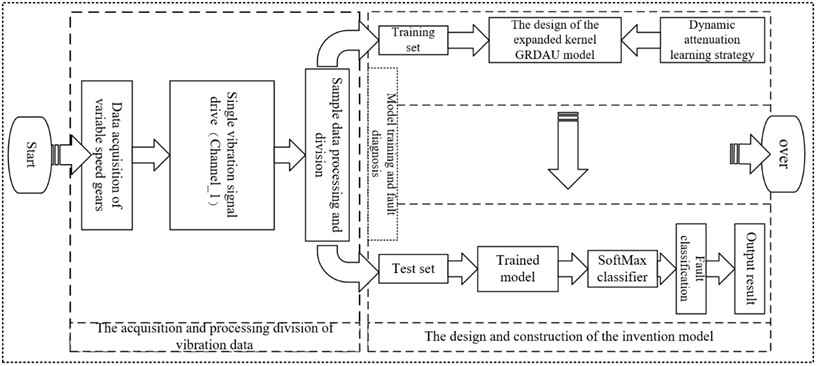
The specific diagnostic process as depicted in Fig.3, which involves the steps as below:
1) The vibration signal of gears under variable speed conditions was obtained through the data collection device, and a dataset suitable for network input was established.
2) The designed GRDAU neural network randomly divides the dataset into training set and testing set in the network.
3) A novel learning strategy is integrated into the GRDAU neural network to improve the efficiency of network learning.
4) The training set is input into the GRDAU model and subjected to preliminary feature extraction through convolutional layers, effectively suppressing changes in rotational speed. Then, through the GRDAU network, deeper level potential sensitive feature extraction is achieved, further enhancing the understanding of data and capturing potential patterns.
5) Use the test set to perform fault diagnosis on the trained model, and use SoftMax to obtain the fault classification results.
Fig. 3Flow chart of the proposed method
3. Case analysis
3.1. Dataset description
The dataset of variable speed gearboxes is sourced from the experimental platform of Xi’an Jiaotong University [17]. The experimental platform (as shown in Fig. 4(a)) comprises a drive motor, belt system, transmission shaft, gearbox, and the remaining relevant components. In order to comprehensively monitor the vibration status of the gears, 12 accelerometers were installed on the gearbox at different spots for collecting vibration signals across multiple locations. Concerning the bevel gear, four different degrees of root cracks were manually prefabricated, as shown in Fig. 4(b). Study the effect of cracks on gear performance by simulating different levels of fault types. In addition, including the normal state, five operating states of the bevel gear were considered, and vibration signals were collected with the speed fluctuation ranging from 0 to 1200 rpm. The sampling frequency of all data was set to 10 kHz to extract fault characteristics within a wider frequency response range. The variation of rotational speed over time is shown in Fig. 5: as shown in the figure, the speed fluctuates irregularly within the range of 0-1200 rpm. Therefore, compared to steady speed signals, this greatly increases the difficulty of diagnosis.
Fig. 4a) Test rig; b) root crack faults of different degrees
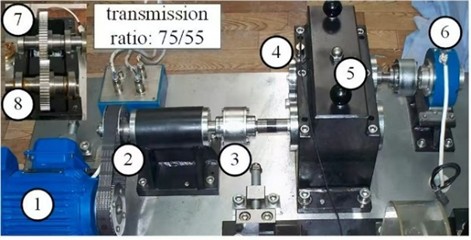
a)
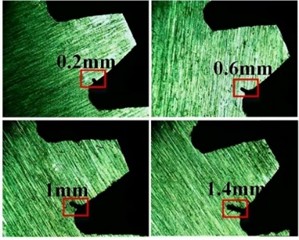
b)
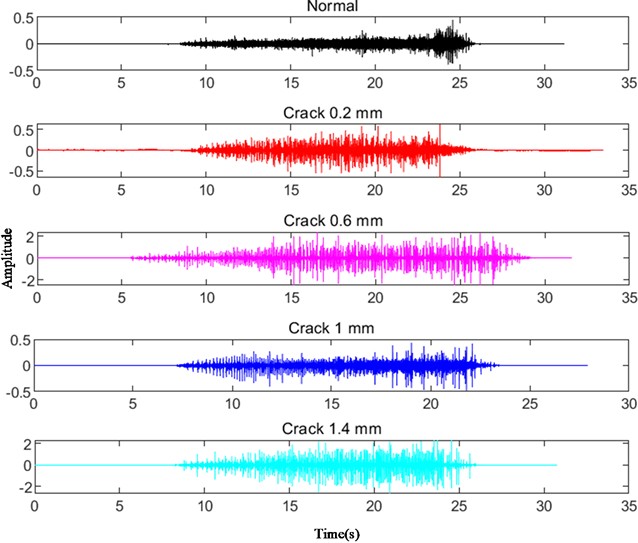
Fig. 6 shows the time-domain waveforms under five different running states, including normal state and four crack sizes (including 0.2, 0.6, 1, and 1.4 millimeters). By analyzing these waveforms, it can be found that as the rotational speed increases, the fluctuation of waveform amplitude and overall characteristics undergo significant changes.
Fig. 5The variation of rotational speed over time
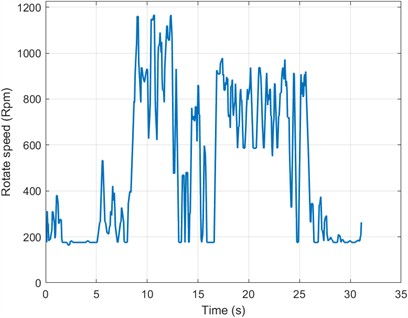
Fig. 6Time domain waveform diagrams under different running states
3.2. Experimental results and analysis
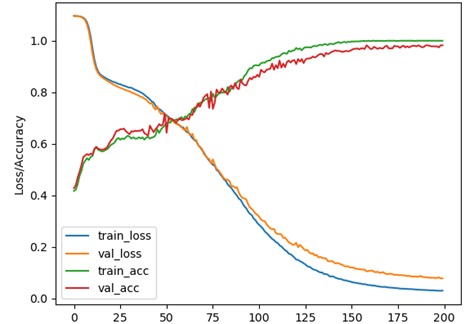
In order to ensure the standardization of model training, testing and the reliability of results, the training samples and testing samples were clearly divided in this study. Specifically, 360 samples were used as training samples for each type of fault, for the parameter optimization and learning process of the model. After the model training is completed, 40 independent test samples are used for validation in order to objectively evaluate its performance. The accuracy curve and loss curve during the experiment are shown in Fig. 7. Among them, the training accuracy curve is mainly used to intuitively reflect the learning effect of the model on the training samples. With the increase of training epochs, the improvement of accuracy indicates that the model gradually grasps the features and rules in the training data. The loss curve focuses on displaying the error changes between the predicted results and the true labels during the training process. The continuous reduction of loss means that the model is gradually optimizing its own parameters and improving its ability to fit the training data. By observing the trend in Fig. 7, we can see that as the number of iterations increases, the performance of the model gradually improves. After approximately 150 epochs, the network reached a convergence state, where the classification accuracy and loss value reached their optimal levels. Therefore, this indicates that our model performs well in handling tasks with time-varying rotational speeds, and can effectively complete diagnosis and fault classification even when the training and testing samples are not high.
Fig. 7The accuracy curve and loss curve
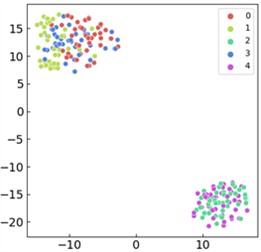
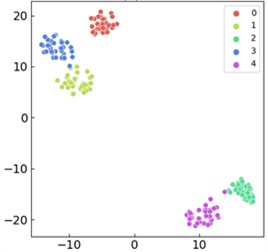
In the experimental process, the principle of training before testing is strictly followed. Firstly, the proposed method is fully trained using training samples to learn effective feature representations of gearbox faults under time-varying speed conditions. Then, the fault diagnosis performance is evaluated on the test samples. Finally, t-SNE technology is used to visualize high-dimensional features, in order to more intuitively analyze and demonstrate the superiorities of the introduced method during feature extraction and differentiation of different fault types. This process ensures the scientific and credible nature of the experimental results, while also providing a clear and reasonable basis for subsequent confusion matrix analysis and interpretation of the results.
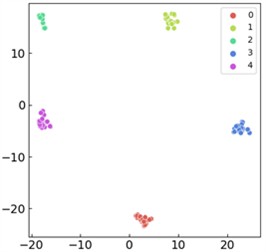
T-SNE visualization can map high-dimensional data to low dimensional space, helping to observe the clustering and distribution patterns of the data, thereby visually demonstrating the classification performance and feature learning of the model. As shown in Fig. 8, the t-SNE visualization comparison results of the first and last output layers of the proposed method are presented. Through observation, it can be seen that the features of the first layer exhibit dispersed and overlapping state, and there is no obvious clustering pattern for feature characteristics of different fault categories, reflecting the weak feature extraction effect in the initial stage. However, as the network gradually performs feature extraction and learning, the final output layer exhibits good classification results, and each fault category is effectively distinguished, indicating that the proposed model can effectively extract time-varying speed features and achieve excellent fault classification.
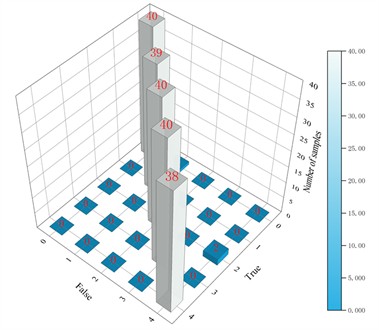
The confusion matrix can visually display the classification performance of the model, helping to understand the accurate classification and misclassification of the model. In Fig. 9, the three-dimensional confusion matrix of various methods without interference is presented, through which the correct classification of each type of fault and the number of misclassified samples can be clearly seen. Specifically, the main diagonal entries of the confusion matrix signify the number of samples correctly classified for each fault type, while the entries on either side of the main diagonal reflect the count of misclassified samples for each respective fault type. The color depth in the confusion matrix corresponds to the sample color bar on the right side of the figure, which can more intuitively reflect the accuracy of classification. Overall, the proposed method demonstrates excellent performance in both classification accuracy and misclassification, further validating the effectiveness and robustness of the model in handling complex signal classification problems.
Fig. 8t-SNE feature visualization: a) visualization of input features from the first layer; b) visualization of the last layer’s output features
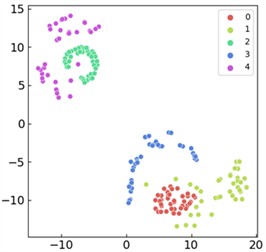
a)
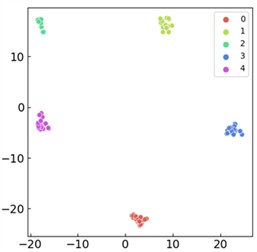
b)
Fig. 9Three-dimensional confusion matrix result of the proposed method
In terms of model diagnosis and performance evaluation, we have recorded the following key indicators to comprehensively reflect the efficiency and performance of the model. The computer configuration used in the experiment is: Intel Core AMD RyzenTM9-5900HX processor, with a clock speed of 3.3GHz, equipped with NVIDIA GeForce RTX 3080 graphics card (16GB of video memory), the system is equipped with 32GB of memory, runs Windows 11 Home Edition, and is equipped with solid-state memory, with a total capacity of about 2TB. In this hardware environment, the total training time of the model is about 25.3 minutes, including about 4.1 minutes for data preprocessing, about 17.3 minutes for model training, and about 5.2 minutes for testing. The model has a parameter count of 1.2 million, with a memory usage of approximately 6.4 GB during training and 4.8 GB during testing.
3.3. Comparison analysis
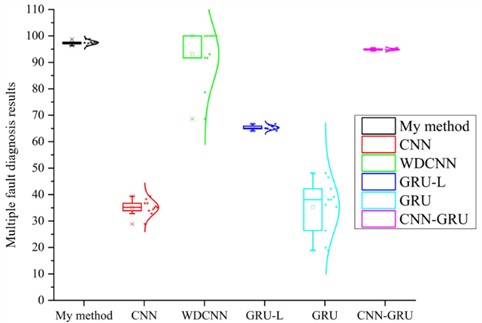
In order to verify the robustness of the proposed method in time-varying speed diagnosis, advanced diagnostic models were selected for comparative experiments. Among them: (1) CNN model, which adopts a deep network structure, including 5-layer convolution, 5-layer pooling, batch normalization, and activation layer, etc. (2) The WDCNN model adopts a deep structure framework with a wide first kernel, which has a noise suppression effect. For details, please refer to reference [18]. In order to verify the diagnostic accuracy of the improved GRU algorithms, a comparative model (3) GRU-L was added, which does not have attention gates and cyclic dropout strategies, but integrates learning strategies. (4) GRU model, basic gated loop unit, without any modifications. (5) The CNN-GRU model connects CNN and GRU in parallel and integrates the designed learning strategy. Among them, CNN includes components such as convolutional layers and pooling layers.
In order to avoid the influence of accidental factors on the experimental results, 10 independent experiments were conducted. The experimental results are shown in Fig. 10, which clearly demonstrates that the proposed method achieves the most outstanding and stable performance. Notably, the proposed method achieved 99.78 % diagnostic accuracy, outperforming the CNN model by 64.61 % in terms of accuracy. Compared to the WDCNN model, it has improved by 6.71 %. Compared to the GRU-L model, it has improved by 34.46 %. Compared to the GRU model, it has improved by 64.44 %. Compared to the CNN-GRU model, it has improved by 4.9 %. These results indicate that the proposed method has significant advantages in improving the accuracy of time-varying speed diagnosis, demonstrating its potential in practical applications. Furthermore, the T-SNE visualization results of the compared methods as shown in Fig. 11 further verify the advantages of the proposed method.
Fig. 10Comparative analysis between ablation experimental models
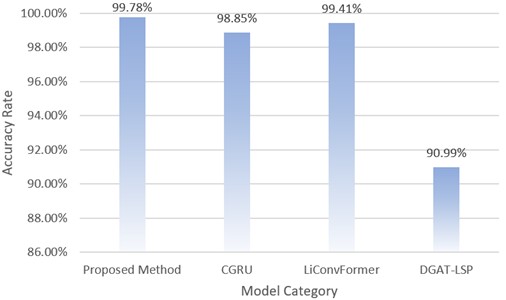
Finally, the proposed method will be compared and analyzed with the current advanced fault diagnosis methods for time-varying speed gearboxes. The methods involved include: (1) CGRU model [19]: a speed adaptive network specifically designed for time-varying speeds, which can effectively extract features and is widely used in comparative studies of different network models. It has excellent interference suppression capabilities, making it perform well in complex environments. (2) LiConvFormer model [20]: This model combines Transformer architecture and Convolutional Neural Network (CNN) to construct a lightweight fault diagnosis framework aimed at addressing the diagnostic challenges of time-varying speed gearboxes. (3) LPS-DGAT model [17]: This is a novel semi supervised fault diagnosis method specifically designed for analyzing the vibration signals of bearings and gears under speed fluctuation conditions. This model achieved ideal diagnostic results by utilizing a small amount of labeled data effectively, demonstrating good performance under time-varying characteristics.
The experimental results are shown in Fig. 12, and the proposed method achieved a satisfactory diagnostic accuracy of 99.78 %, demonstrating excellent performance. In contrast, the diagnostic accuracy of the WDCNN model is relatively excellent, reaching 98.85 %, an improvement of 0.93 % on this result. The diagnostic accuracy of the LiConvFormer model is 99.41 %, although it performs quite well, it is still 0.37 % lower than the method proposed in this study. This further demonstrates the effectiveness and reliability of the proposed method in fault diagnosis tasks. In addition, the diagnostic accuracy of the LPS-DGAT model is 90.99 %, which is 8.79 % lower than the proposed method. This difference indicates that under time-varying speed conditions, the proposed method can more effectively extract and utilize features, providing higher diagnostic accuracy.
Fig. 11Comparison of visualized t-SNE features for ablation experiment models: a) the proposed approach; b) CNN model; c) WDCNN architecture; d) GRU-L variant; e) gated recurrent unit (GRU) model; f) CNN-GRU hybrid model
a)
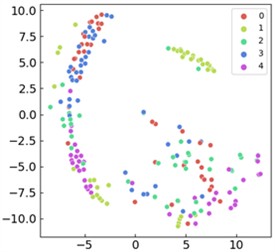
b)
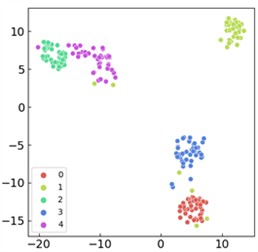
c)
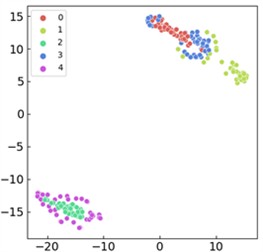
d)
e)
f)
Fig. 12Comparative analysis between advanced models
4. Conclusions
In summary, in response to the difficulty of diagnosing gearbox faults under time-varying speed conditions, this paper innovatively proposes a diagnostic method based on an improved gate control cycle unit, and successfully constructs a new network named GRDAU. This method cleverly integrates the attention gate mechanism and the cyclic dropout learning strategy, fully leveraging the advantages of attention gates in capturing key features and the role of cyclic dropout learning strategy in preventing overfitting and improving learning efficiency, thereby significantly improving the accuracy and stability of fault diagnosis. The experiment was conducted based on the time-varying speed gearbox dataset provided by Xi’an Jiaotong University. After comprehensive and rigorous ablation experiments and comparative experiments, the results effectively validated the efficacy and superiority of the proposed approach. The high accuracy of 99.78 % not only highlights the outstanding performance of this method in fault diagnosis, but also demonstrates its strong adaptability in handling complex working conditions with time-varying speeds. Compared with current advanced diagnostic methods, the method proposed in this paper demonstrates significant advantages, providing a more accurate and reliable solution for gearbox fault diagnosis under time-varying speed conditions.
Although the proposed method has achieved good results, it faces various interference issues in practical work scenarios. Therefore, we look forward to expanding this method to more complex mechanical fault diagnosis scenarios, further exploring its potential and application scenarios, and contributing to the intelligent operation and maintenance of mechanical equipment.
References
-
J. T. Shen et al., “Gearbox fault diagnosis based on WATD-MTF and improved residual network,” Journal of Vibration and Shock, Vol. 44, No. 7, pp. 247–257, Feb. 2025, https://doi.org/10.13465/j.cnki.jvs.2025.07.029
-
L. C. Yu et al., “Harmonic feature based sparsity-enhancing regularization and its applicationin gearbox fault diagnosis,” Journal of Vibration and Shock, Vol. 44, No. 7, pp. 318–324, Jan. 2025, https://doi.org/10.13465/j.cnki.jvs.2025.06.034
-
Y. Han et al., “Gearbox fault diagnosis method based on CNN graphSAGE dual-branch feature fusion,” Journal of Electronic Measurement and Instrumentation, Vol. 39, No. 3, pp. 115–124, Mar. 2025, https://doi.org/10.13382/j.jemi.b2407678
-
X. L. Qi et al., “Fault Diagnosis of planetary gearboxes based on RTSWMFE, IS-GSE and COOT-SVM,” Journal of Vibration, Measurement and Diagnosis, Vol. 45, No. 1, pp. 132–139, Feb. 2025, https://doi.org/10.16450/j.cnki.issn.1004
-
P. L. Wang, “The application of order tracking and Hilbert transform in the fault diagnosis of non-stationary signals of rolling bearing,” Machine Design and Manufacturing Engineering, Vol. 52, No. 6, pp. 97–102, Jun. 2023, https://doi.org/10.3969/j.issn.2095
-
J. Alsalaet, “Improved multi-order Vold-Kalman filter for order tracking analysis using split cosine and sine terms,” Measurement, Vol. 224, p. 113901, Jan. 2024, https://doi.org/10.1016/j.measurement.2023.113901
-
X. Chen and Z. Feng, “Time-frequency space vector modulus analysis of motor current for planetary gearbox fault diagnosis under variable speed conditions,” Mechanical Systems and Signal Processing, Vol. 121, pp. 636–654, Apr. 2019, https://doi.org/10.1016/j.ymssp.2018.11.049
-
H. Wang, G. Xue, L. Yu, S. Li, Z. Guo, and W. Du, “Time-varying speed fault diagnosis based on dual-channel parallel multi-scale information,” Journal of Mechanical Science and Technology, Vol. 38, No. 11, pp. 5961–5978, Nov. 2024, https://doi.org/10.1007/s12206-024-1016-x
-
Z. X. Li et al., “Self-correlation order tracking method for fault diagnosis of rotating machinery,” Machinery Design and Manufacture, Vol. 9, pp. 42–45, 2017, https://doi.org/10.19356/j.cnki.1001-3997.2017.09.012
-
R. L. Lin, B. Y. Tang, and M. Chen, “Data augmentation algorithm for bearings faults diagnosis,” Computer Engineering and Applications, Vol. 57, No. 7, pp. 269–278, Jun. 2021, https://doi.org/10.3778/j.issn.1002-8331.2006-0030
-
Y. H. Xing and Z. W. Wei, “Research and application of MFWVD time-frequency analysis in delay estimation,” Journal of Electronic Measurement and Instrumentation, Vol. 39, No. 2, pp. 240–250, 2025, https://doi.org/10.13382/j.jemi.b2407655
-
X. Y. Wang et al., “Frequency estimation algorithm of frequency-hopping signal based on image processing and time-frequency analysis,” Journal of Projectiles, Rockets, Missiles and Guidance, Vol. 44, No. 3, pp. 81–86, Jun. 2024, https://doi.org/10.15892/j.cnki.djzdxb.2024.03.011
-
M. Pająk, Muślewski, B. Landowski, T. Kałaczyński, M. Kluczyk, and D. Kolar, “Identification of reliability states of a ship engine of the type Sulzer 6AL20/24,” SAE International Journal of Engines, Vol. 15, No. 4, pp. 527–542, Nov. 2021, https://doi.org/10.4271/03-15-04-0028
-
M. Pająk, M. Kluczyk, Muślewski, and D. Lisjak, “Fault detection of diesel engines using artificial neural network,” SAE International Journal of Engines, Vol. 18, No. 2, pp. 175–195, Jan. 2025, https://doi.org/10.4271/03-18-02-0010
-
P. Zhu et al., “Fault diagnosis of rolling bearings under time-varying speed based on the residual attention mechanism and subdomain adaptation,” Journal of Vibration and Shock, Vol. 41, No. 22, pp. 293–300, Dec. 2022, https://doi.org/10.133456/j.cnki.jvs.2022.22.036
-
H. D. Shao et al., “Fault diagnosis of rotor-bearing system under time-varying speeds by using dual-threshold attention-embedded GAN and small samples,” Journal of Mechanical Engineering, Vol. 59, No. 12, p. 215, Jan. 2023, https://doi.org/10.3901/jme.2023.12.215
-
S. Yan, H. Shao, Y. Xiao, J. Zhou, Y. Xu, and J. Wan, “Semi-supervised fault diagnosis of machinery using LPS-DGAT under speed fluctuation and extremely low labeled rates,” Advanced Engineering Informatics, Vol. 53, p. 101648, Aug. 2022, https://doi.org/10.1016/j.aei.2022.101648
-
W. Zhang, G. Peng, C. Li, Y. Chen, and Z. Zhang, “A new deep learning model for fault diagnosis with good anti-noise and domain adaptation ability on raw vibration signals,” Sensors, Vol. 17, No. 2, p. 425, Feb. 2017, https://doi.org/10.3390/s17020425
-
H. Wang, G. Xue, and W. Du, “An adaptive model for time-varying speed fault diagnosis under strong noise interference,” Journal of Mechanical Science and Technology, Vol. 38, No. 6, pp. 2831–2844, Jun. 2024, https://doi.org/10.1007/s12206-024-0503-4
-
S. Yan, H. Shao, J. Wang, X. Zheng, and B. Liu, “LiConvFormer: A lightweight fault diagnosis framework using separable multiscale convolution and broadcast self-attention,” Expert Systems with Applications, Vol. 237, p. 121338, Mar. 2024, https://doi.org/10.1016/j.eswa.2023.121338
About this article

The authors have not disclosed any funding.
The datasets generated during and/or analyzed during the current study are available from the corresponding author on reasonable request.
Zhenhu Wang is the theoretical researcher and writer of the paper, and Chaozhong Liu is the program programmer in the paper.
The authors declare that they have no conflict of interest.
