Abstract
The morphology of sliding surface is an important factor in the earth pressure analysis. To study the characteristics of the sliding surface of backfill behind a rigid wall, taking the translational mode of wall (TT model) as an example, a model test was conducted through a self-made test device, and numerical modelling and theoretical analysis were carried out. The research shows: (1) The finite sliding surface morphology starts from the heel of the wall and consists of multiple “straight lines”. The smaller the width-height ratio and the internal friction angle, the more the number of straight line segments of the finite sliding surface. (2) The “length factor” of the sliding surface is introduced and defined. Through normalisation processing, the width-height ratio, internal friction angle, and length factor are linearly fitted, showing a high degree of linear correlation. (3) The study of the width-height ratio, internal friction angle, and length factor yields a binary quadratic surface function, which shows a high degree of linear correlation. The study fills the research gap of the joint influence of the width-height ratio and internal friction angle on the folded-line type sliding surface. It proposes a quantitative calculation formula for the determination of the finite soil.
Highlights
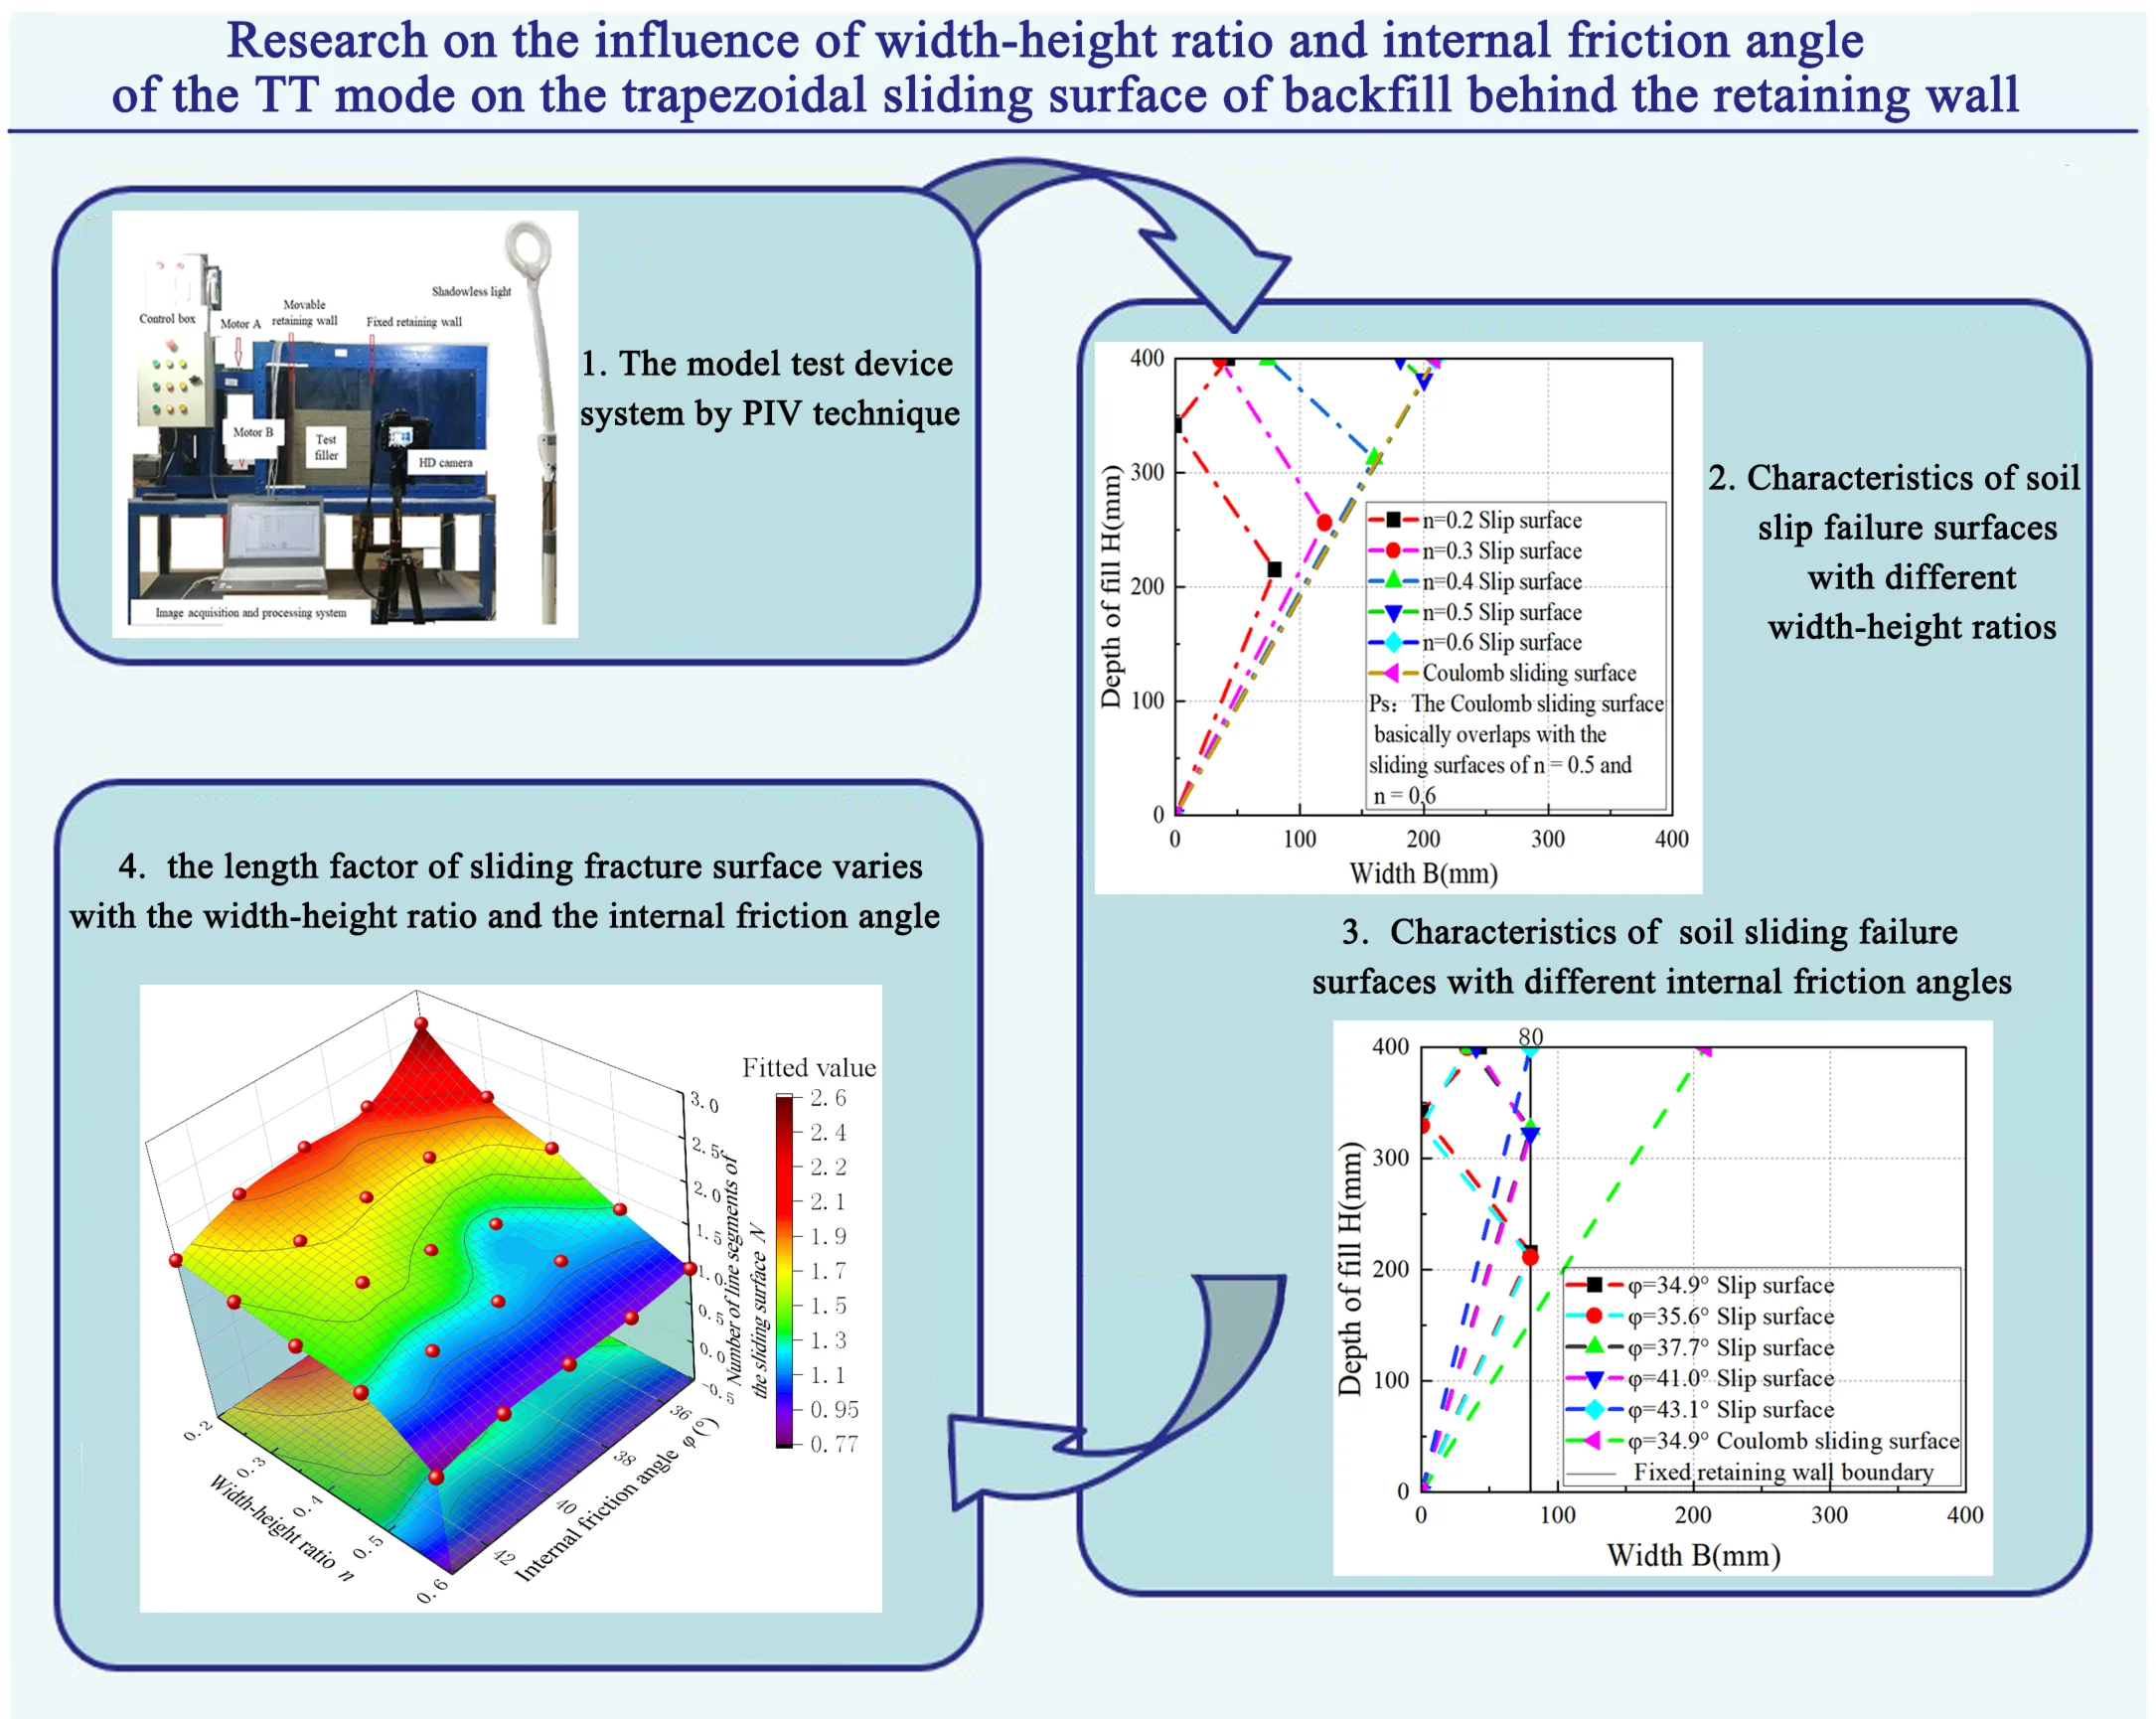
- The effect of the influence of width-height ratio and internal friction angle of the TT mode on the trapezoidal sliding surface of backfill behind the retaining wall was investigated.
- The finite sliding surface morphology starts from the heel of the wall and consists of multiple "straight lines". The smaller the width-height ratio and the internal friction angle, the more the number of straight line segments of the finite sliding surface.
- The "length factor" of the sliding surface is introduced and defined. Through normalisation processing, the width-height ratio, internal friction angle, and length factor are linearly fitted, showing a high degree of linear correlation.
- The study of the width-height ratio, internal friction angle, and length factor yields a binary quadratic surface function, which shows a high degree of linear correlation. It proposes a quantitative calculation formula for the determination of the finite soil.
1. Introduction
The Coulomb earth pressure theory assumes that the backfill behind the retaining wall is a semi-infinite soil mass, and its sliding surface is a plane starting from the heel of the retaining wall and ending at the surface of the backfill [1-3]. With the rapid development of city, construction projects are mainly concentrated in the urban center [4, 5]. Due to the obstruction of existing underground structures or rock masses, the sliding surface behind the retaining wall cannot directly extend to the ground, which does not meet the assumption of a semi-infinite soil mass. At this time, the limited-width backfill is called a finite soil mass [6-9]. Domestic and foreign scholars have conducted relevant studies on the active failure mode of the finite soil mass through model tests, numerical simulations and theoretical analyses, mainly focusing on the influence of the width-height ratio of the cohesive soil on the shape of the sliding surface.
In terms of model tests, Wang [10] studied the influence laws of different width-height ratios on the sliding failure surfaces under three types of retaining wall displacement modes, as shown in Fig. 1, namely the translational mode of wall (TT mode), the mode of rotation around the top of the wall (RT mode), and the mode of rotation around the bottom of the wall (RB mode). The active sliding surface of loose sand in TT mode is composed of multiple broken lines, with smaller width-height ratios resulting in more broken lines, and the critical width-height ratio 0.6. Yang [11] studied the failure process of different width-height ratios of finite soil mass. Under the TT mode, the active sliding failure surface of loose sand takes the form of a continuous surface. The larger the width-height ratio, the more the sliding failure surface gradually shifts outward, and finally stabilizes at a certain fixed position inside the Coulomb failure surface. Fang [12] studied that the fractured mass of finite soil mass under the TT mode changes from a triangle to a trapezoid. Based on model tests and particle image velocimetry technology, Khosravi [13] pointed out the failure surface of the cohesiveless soil under the TT mode is a sliding zone passing through the wall heel. Through the test on the finite soil mass behind the rigid retaining wall, Xia [14] observed that the sliding failure surface is a multi-curved surface. Dai [15], Yang [16], Jiang [17], and Zhou [18] conducted model tests to investigate the active deformation failure characteristics and earth pressure distribution patterns of loose sand under the translation (TT) mode and rotation mode of retaining walls, which indicated that the critical width-to-height ratio of the finite soil mass varied between 0.43 and 0.6 under different experimental conditions.
Fig. 1Schematic diagram of the three deformation modes of retaining wall
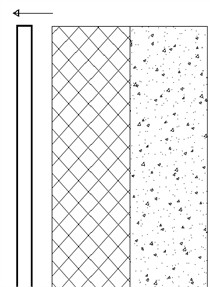
a) TT mode
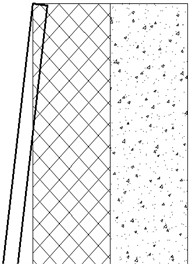
b) RT mode
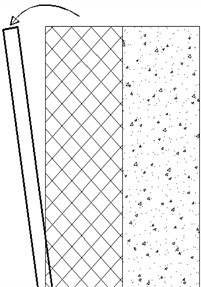
c) RB mode
In terms of numerical simulation, Wan [19] conducted modelling analysis using the discrete element method; In the TT mode, the active sliding shear surface of limited soil mass was a broken line, and the critical width-height ratio of loose sand was 0.4. Zhang [20-22] obtained the active deformation and failure characteristics of loose sand with different width-height ratios under three displacement modes. In the TT mode, the sliding shear surface was a straight line terminating at the fixed retaining wall, and the critical width-height ratio was approximately 0.7.
In terms of theoretical analysis, Fang [23], Zhang [24], Liu [25], Wang [26], Xu [27], Ahmed [28], Yue [29], and Chen [30], based on assumptions such as limit equilibrium method, thin-layer element method, plane fracture surface, and loose soil, established finite soil earth pressure theoretical calculation models and derived calculation formulas for earth pressure under different sliding failure surfaces. Xu et al. [31] studied the failure characteristics and earth pressure of backfill behind rigid retaining walls under TT mode, and found that the smaller the soil width, the greater the number of reflections of sliding surface. Zhang [32] studied the active earth pressure of lightweight fill and revealed the characteristics of active earth pressure of lightweight soil. Deng [33] studied the active earth pressure and sliding failure surface characteristics of sand behind rigid walls in translational mode. Raghuram [34], Hariri [35], and Yang [36] conducted compaction tests and spectrophotometric analyses to investigate the effect of moisture content on the internal friction angle. Their results demonstrated that the internal friction angle () decreased as moisture content increased, with the variation in following a power function relationship. Niu [37] utilizing the upper bound limit analysis method, derived the seismic stability coefficient for shallow-covered slopes and further observed that the safety factor of infinite slopes gradually increased with the increasing thickness ratio of the shallow cover layer.
Although there have been many studies on the influence of width-height ratio on the sliding surface of limited soil mass [38-40], there are relatively few studies on the influence of internal friction angle on the sliding surface of limited soil mass. The research on the folded-line morphology of the sliding surface has not been carried out. The research on the influence of both width-height ratio and internal friction angle on the number of sliding surface segments has not been conducted. Both width-height ratio and internal friction angle are important factors affecting the morphology of the sliding surface and are common parameters in engineering. Therefore, through the model test of cohesiveless soil, based on the digital image method (DIC), by using a high-frequency digital camera to continuously take photos of the soil deformation, this paper analyzes the shear strain images of the sliding surface of the soil using the Geo-PIV software and increases the statistical sample number through numerical simulation. The definition of the “length factor” of the sliding surface is introduced to conduct quantitative analysis of sliding surface, analyzing the influence of both width-height ratio and internal friction angle on the folded-line type sliding surface, and proposing a quantitative calculation formula for the determination of limited soil mass. It has very important practical significance and application value in engineering applications.
2. Introduction to model testing and numerical simulation
2.1. Model test device
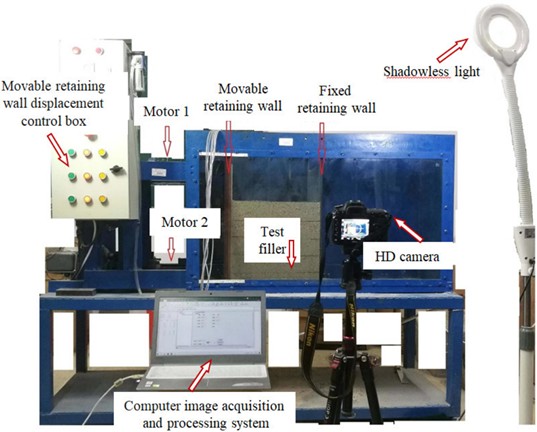
The design of the model test device, parameters, etc. are detailed in the previous research results of the research group by Liu [41, 42]. The model pictures are shown in Fig. 2.
The soil filling box is rectangular in shape, with dimensions of 1200 mm in length, 400 mm in width, and 700 mm in height. The front panel of the box is made of transparent glass with a thickness of 16 mm. The right side features a steel plate serving as a movable retaining wall, whereas the left side consists of a steel plate functioning as a fixed retaining wall.
Fig. 2Model testing equipment
2.2. Filler parameters
The fill material used in this model test was sand, which was taken from Dongtongdian Lake in Yueyang, Hunan Province, China. Before the formal model test, a relationship test between the internal friction angle and density of the sand was conducted. The density of the fill soil was obtained by controlling the number of hammer blows on the compaction plate to achieve the compaction degree. The internal friction angle of the fill soil was obtained through direct shear tests, and the results are shown in Table 1. The process of direct shear tests for the compaction degree, density and internal friction angle are detailed in Liu [41, 42].
The data in Table 1 was subjected to linear fitting. The fitting formula is detailed in Eq. (1), with a correlation coefficient 0.990:
where is the sand density and is the sand internal friction angle.
Table 1Internal friction angle of different density sandy soils
Impact number | Compaction degree (%) | Density  (g/cm-3) (g/cm-3) | Internal friction angle (°) |
0 | 80.8 | 1.41 | 34.9 |
1 | 82.6 | 1.45 | 36.0 |
3 | 83.7 | 1.47 | 36.5 |
5 | 85.5 | 1.50 | 37.3 |
10 | 87.2 | 1.53 | 38.1 |
20 | 92.4 | 1.62 | 40.5 |
30 | 85.3 | 1.67 | 41.9 |
40 | 97.1 | 1.70 | 42.7 |
50 | 98.3 | 1.72 | 43.2 |
60 | 98.8 | 1.73 | 43.5 |
70 | 98.8 | 1.73 | 43.5 |
2.3. Model test scheme
To explore the combined influence of width-height ratio and internal friction angle on the active failure mode of finite soil mass. As shown in Table 2, five representative internal friction angles from Eq. (1) were selected, and a total of nine model test schemes were designed. The test operation procedures can be found in the previous work of our research group by Liu [41, 42].
Table 2Model test scheme
Internal friction angle (°) | Soil width (mm) | Soil height (mm) | Width-height ratio |
34.9 | 80, 120, 160, 200, 240 | 400 | 0.2, 0.3, 0.4, 0.5, 0.6 |
35.6 | 80 | 400 | 0.2 |
37.7 | 80 | 400 | 0.2 |
41.0 | 80 | 400 | 0.2 |
43.1 | 80 | 400 | 0.2 |
2.4. Introduction to numerical simulation
Numerical simulation is conducted by using PLAXIS2D software. The model design, basic assumptions and parameters of retaining walls, are detailed in the published results of our research group by Liu [41, 42]. The numerical simulation is based on the following assumptions: The soil behavior is modeled using the Mohr-Coulomb constitutive model, and discretized using 15-node triangular elements. The retaining walls on both sides are simulated using a linear elastic model, with interface elements employed to represent the interaction between the retaining walls and the backfill soil. Rigid retaining walls are modeled using plate elements. Full constraints are applied at the base of the model and on the fixed retaining wall, while the movable retaining wall is constrained only in the -direction. The parameters of the filler materials are detailed in Table 3.
3. Result and comparative analysis
Based on Digital Image Correlation (DIC) method, using Geo-PIV image analysis software, the test images were analyzed. The dynamic development process and failure characteristics of the active sliding fracture surface of the finite soil mass in the TT mode are detailed in the research results already published by the research group, namely Liu [41, 42]. The compaction degree of the fill material in the model test ranged from 81 % to 93 %, corresponding to an internal friction angle ranging from 34.9° to 42.1°. The critical width-to-height ratio obtained from the physical model tests varied between 0.22 and 0.49, while the numerical simulation yielded a similar range of 0.19 to 0.50. The maximum percentage difference between the experimental and simulated values was 14.61 %. Potential reasons for this discrepancy include the simplification of soil-soil interactions, neglect of internal effects within the sliding surface, and oversimplification of boundary contact conditions in the numerical model.
Table 3Filler parameters
Internal friction angle (°) | Density (g/cm3) | Poisson’s ratio |
34.9 | 1.40 | 0.3 |
35.6 | 1.42 | 0.3 |
37.7 | 1.50 | 0.3 |
41.0 | 1.62 | 0.3 |
43.1 | 1.70 | 0.3 |
3.1. The influence of the fill soil width-height ratio on the active sliding surface
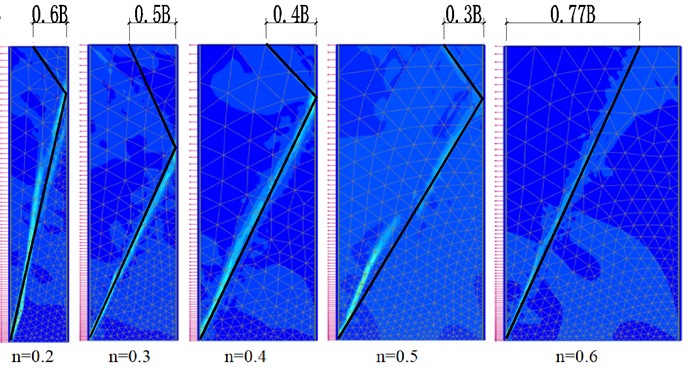
In order to better analyze the influence laws of width-height ratio on the morphological characteristics of active sliding surfaces, different width-height ratio active sliding surfaces are plotted on the same figure, the characteristics of soil slip failure surfaces with different width-height ratios are shown in Fig. 3. In Fig. 3, the fitting curves corresponding to width-height ratio of 0.2, 0.3, 0.4, 0.5, and 0.6 represent the measured values, whereas the Coulomb curves denote the predicted values.
Fig. 3Characteristics of soil slip failure surfaces with different width-height ratios
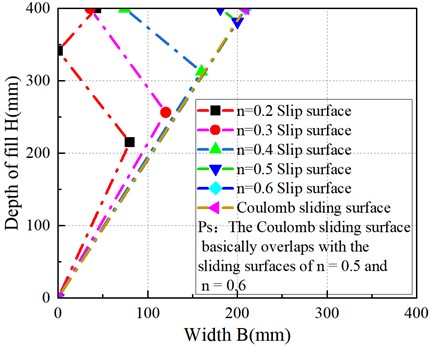
As shown in Fig. 3, when width-height ratio 0.4, for a smaller width-height ratio, the initial failure angle of the soil increases, and the sliding surface becomes steeper. When width-height ratio 0.5, for finite width soil, the active failure forms multi-segment folded-line sliding surface. When width-height ratio 0.2, there are three segmented folded-line sliding surfaces; when width-height ratio 0.3, 0.4, and 0.5, there are two segmented folded-line sliding surfaces. The fewer the width-height ratio, the more the line segments of the sliding surface. The lower the width-height ratio, the lower the height of the first line segment of sliding surface. When width-height ratio 0.5, it is approximately 1/16; when width-height ratio 0.4, it is approximately 2/10; when width-height ratio 0.3, it is approximately 3/8; and when width-height ratio 0.2, it is approximately 9/20. The failure angles of the sliding surfaces for width-height ratio 0.5 and width-height ratio 0.6 are basically consistent with those of the Coulomb theory sliding surface, and the three sliding surfaces in the figure are basically superimposed. The critical width-height ratio of the finite soil is between 0.5 and 0.6. When width-height ratio 0.6, the active sliding surface starts from the wall heel and is a straight line. The shape and failure angle ( 61.25°) are basically consistent with the Coulomb theory (45°+ /2 = 62.45°), and it is a semi-infinite soil.
3.2. The influence of the internal friction angle of backfill on the active sliding surface
In order to better analyze the influence law of the internal friction angle on the morphological characteristics of the active sliding surface, different active sliding surfaces with different internal friction angles are plotted on the same graph. The characteristics of sliding failure surfaces of soil with different internal friction angles are shown in Fig. 4. In Fig. 4, the fitting curves corresponding to internal friction angles of 34.9°, 35.6°, 37.7°, 41.0°, and 43.1° represent the measured values, whereas the Coulomb curve for 34.9° represents the predicted value.
Fig. 4Characteristics of sliding failure surfaces of soil with different internal friction angles
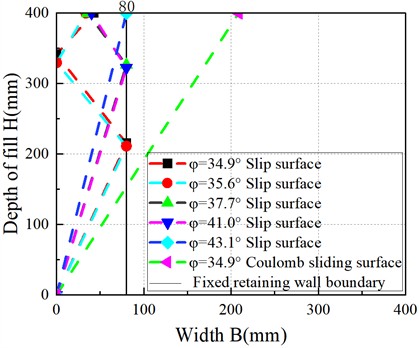
As shown in Fig. 4, The fracture angles and the forms of the broken lines of the sliding failure surfaces with internal friction angles of 34.9°and 35.6° are basically the same, both start from the heel of retaining wall and end at the surface of the fill soil. The failure surfaces consist of three segments, the first segment of the failure surface starts from the heel of the movable retaining wall and ends at about 1/2 of the fixed retaining wall; the second segment starts from about 1/2 of the fixed retaining wall and ends at about 1/8 of the movable retaining wall; the third segment starts from about 1/8 of the movable retaining wall and ends at the surface of the soil mass. The larger the internal friction angle, the greater the fracture angle of the sliding surface, and the steeper the sliding surface. The smaller the internal friction angle, the more the number of broken line segments on the sliding surface; the more obvious the finite soil constraint, the more obvious the failure mode of the sliding surface broken line.
4. Study on the number of sliding surface segments
4.1. Define the “length factor” of the sliding fracture surface
The folded-line sliding surface is composed of multiple sliding surfaces that are folded and terminate between the fixed retaining wall and the movable retaining wall. The linear sliding surface is a straight line. To better express the quantitative relationship of the number of sliding surface segments, the definition of “length factor” for sliding surface is introduced. Project each sliding surface onto the horizontal direction and adopt normalisation processing. The ratio of the total length of the projection of each segment of the sliding surface in the horizontal direction to the width of the fill soil is called the “length factor”, represented by :
where denotes the horizontal projection length of each segment of the sliding surface, while refers to the width of the backfill.
As illustrated in Fig. 5, using the numerical simulation results obtained with an internal friction angle of 37.7° and a width-to-height ratio () of 0.5 as an example, the calculation method for the “length factor” of the sliding surface is demonstrated.
Fig. 5Schematic diagram of the length factor of the sliding failure line (φ = 37.7°, n= 0.5)
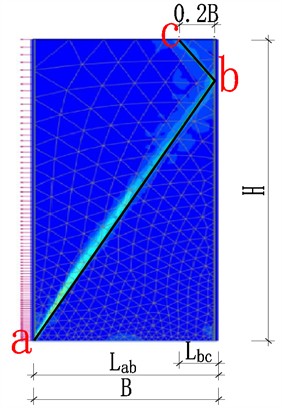
As shown in Fig. 5, denotes the initial segment of the sliding surface (labeled as segment ab in the figure), which extends from the heel of the movable retaining wall to the fixed retaining wall, with a horizontal projected length of 1.0B; represents the second segment of the sliding surface (denoted as the bc section in the figure), extending from the endpoint of the first segment to the surface of the fill material. The horizontal projection length of is 0.2B; denotes the total horizontal projection length of all segments of the sliding surface, calculated as = 1.0 + 0.2 = 1.2, therefore, length factor 1.2.
denotes the ratio of the total horizontal projection length of all line segments along the sliding surface from the starting point to the endpoint, to the width of the fill material. When 1, it represents the critical condition for transitioning a semi-infinite soil mass to a finite one. If 1, the soil behind the retaining wall remains a semi-infinite soil mass, and the corresponding sliding surface conforms to the classical Coulomb failure criterion. In this case, earth pressure can be calculated using classical earth pressure theory. However, when 1, the soil behind the wall is classified as a finite soil mass, and the sliding surface no longer aligns with the classical Coulomb assumption. Consequently, the mechanical behavior and deformation characteristics of the soil deviate from the assumptions of classical Coulomb theory, and the earth pressure must be calculated using a method specifically designed for finite soil masses.
4.2. Increase the number of statistical samples
As stated by Liu [41, 42], the numerical simulation results are basically consistent with the model test results. The reliability of the numerical simulation for other working conditions is relatively high. To increase the statistical sample size, through numerical simulation, the research on other working conditions is obtained, 16 numerical simulation schemes are designed. The supplementary numerical simulation test schemes are shown in Table 4.
Table 4Supplementary numerical simulation test scheme
Internal friction angle (°) | Soil width (mm) | Soil height (mm) | Width-height ratio |
34.9 | – | 400 | – |
35.6 | 120, 160, 200, 240 | 400 | 0.3, 0.4, 0.5, 0.6 |
37.7 | 120, 160, 200, 240 | 400 | 0.3, 0.4, 0.5, 0.6 |
41.0 | 120, 160, 200, 240 | 400 | 0.3, 0.4, 0.5, 0.6 |
43.1 | 120, 160, 200, 240 | 400 | 0.3, 0.4, 0.5, 0.6 |
Numerical simulation was conducted on the scheme in Table 4, 16 sets of deformation results of sliding shear surfaces were obtained. The morphologies of sliding shear surfaces from both model tests and numerical simulations were summarized, and the summary of sliding failure surfaces under various working conditions are shown in Fig. 6.
Fig. 6Summary of sliding failure surfaces under various working conditions
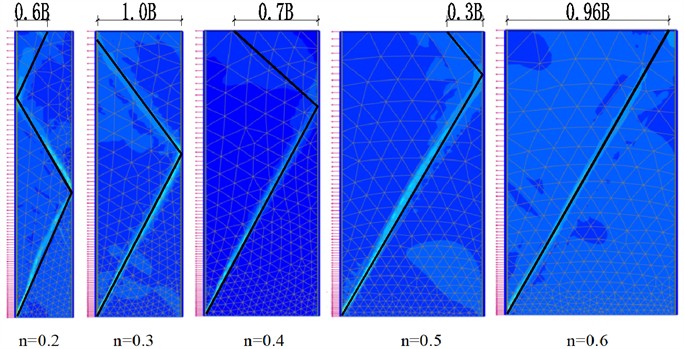
a) Simulation result, 34.9°
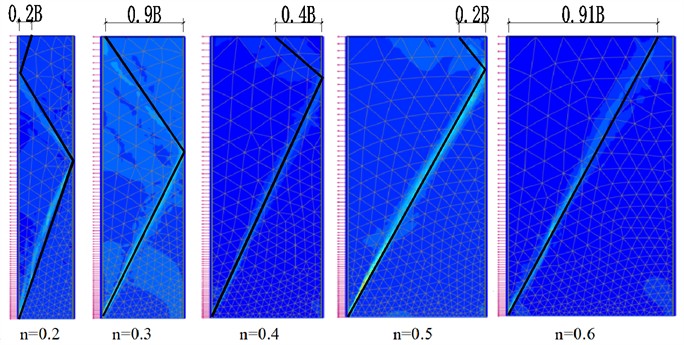
b) Simulation result, 35.6
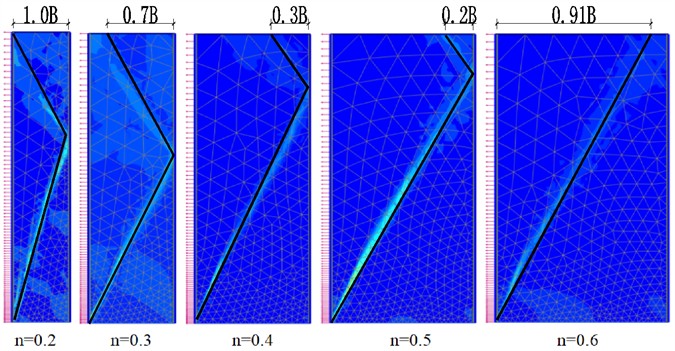
c) Simulation result, 37.7°
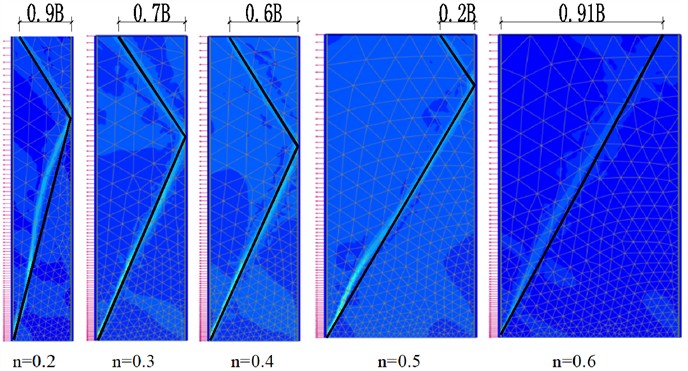
d) Simulation result, 41.0°
e) Simulation result, 43.1°
As shown in Fig. 6, the width-height ratio and internal friction angle both have an impact on the morphology of the sliding fracture surface. The morphology of the sliding fracture surface changes from a three-segment line to a two-segment line, and finally becomes a single straight line. The folded-line sliding fracture surface represents the characteristic of finite soil failure, while the single straight line represents the characteristic of semi-infinite soil failure.
The number of broken line segments of the sliding fracture surface in Fig. 6 was normalized, and the corresponding length factors were obtained. The Length factor of slip surface for model tests and numerical simulations were summarized in Table 5 and Table 6.
Table 5Length factor of slip surface for model tests
Internal friction angle (°) | Width-height ratio | Slip surface length factor |
34.9 | 0.2 | 2.60 |
34.9 | 0.3 | 2.00 |
34.9 | 0.4 | 1.70 |
34.9 | 0.5 | 1.30 |
34.9 | 0.6 | 0.96 |
35.6 | 0.2 | 2.20 |
37.7 | 0.2 | 2.00 |
41.0 | 0.2 | 1.90 |
43.1 | 0.2 | 1.60 |
Table 6Length factor of slip surface for numerical simulations
Internal friction angle (°) | Width-height ratio | Slip surface length factor |
35.6 | 0.3 | 1.90 |
35.6 | 0.4 | 1.40 |
35.6 | 0.5 | 1.20 |
35.6 | 0.6 | 0.91 |
37.7 | 0.3 | 1.70 |
37.7 | 0.4 | 1.30 |
37.7 | 0.5 | 1.20 |
37.7 | 0.6 | 0.91 |
41.0 | 0.3 | 1.70 |
41.0 | 0.4 | 1.60 |
41.0 | 0.5 | 1.20 |
41.0 | 0.6 | 0.91 |
43.1 | 0.3 | 1.50 |
43.1 | 0.4 | 1.40 |
43.1 | 0.5 | 1.30 |
43.1 | 0.6 | 0.77 |
4.3. Linear fitting of width-height ratio, internal friction angle and length factor of sliding fracture surface
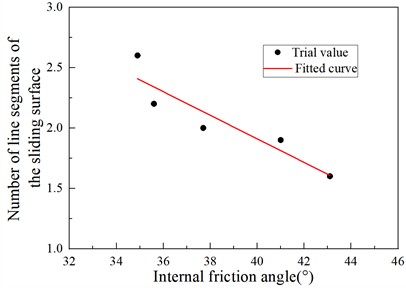
As shown in Table 5 and Table 6, the length factor of the active failure sliding surface of the finite soil mass is closely related to the width-height ratio n and the internal friction angle. After fitting, the relationship curves as shown in Fig. 7 and Fig. 8 are obtained, the relationship between length factor with width-height ratio and internal friction angle of sliding fracture plane is shown in Eq. (3) and Eq. (4), respectively.
where and are the length factor of sliding fracture surface, is the width-height ratio of backfill behind the retaining wall, is the internal friction angle of backfill behind the retaining wall.
From Eq. (3) and Eq. (4), it can be seen that the critical value of the finite soil mass decreases linearly with the increase of the width-height ratio n and the internal friction angle. The correlation coefficients between them are 0.983 and 0.851, respectively; showing a highly linear correlation.
Fig. 7Relationship between length factor and width-height ratio of sliding fracture plane (φ= 34.9°)
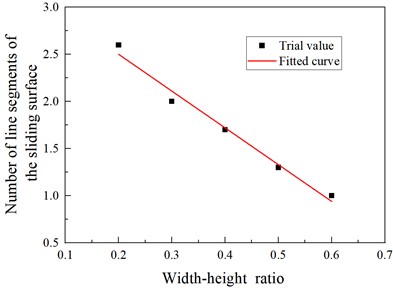
Fig. 8Relationship between length factor and internal friction angle of sliding fracture surface (n= 0.2)
4.4. Surface fitting of width-height ratio, internal friction angle and length factor of sliding fracture surface
In order to better analyze the influence laws of the width-height ratio and the internal friction angle on the active sliding surface length factor , a study on the influence of the width-height ratio n and the internal friction angle on the sliding surface length factor have been conducted.
Based on the data in Table 5 and Table 6, according to the test range and the verification results, the function relationship of the sliding surface length factor with the width-height ratio n and the internal friction angle was fitted. The final fitting formula is shown in Eq. (5):
where is the length factor of sliding fracture surface, is the width-height ratio of backfill behind the retaining wall, is the internal friction angle of backfill behind the retaining wall.
The statistical correlation coefficients associated with the fitting Eq. (5) are presented in Table 7.
Table 7Statistical correlation coefficient
Statistical figures | 25 |
Degrees of freedom | 19 |
Reduced Chi-Sqr | 0.01612 |
Sum of Squared Residuals | 0.30636 |
Coefficient of Determination () | 0.93791 |
Adjusted | 0.92157 |
From Eq. (5), it can be seen that the length factor of the sliding surface of the finite soil mass decreases with the increase of the width-height ratio and the internal friction angle. The correlation coefficient 0.938, indicating a highly linear correlation.
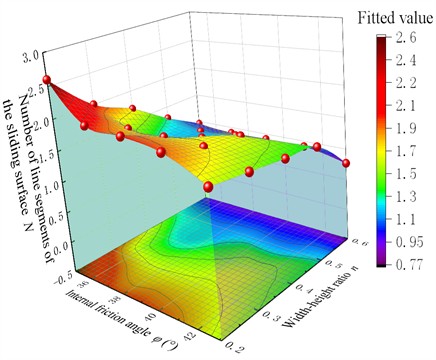
The length factor of the sliding surface in the oblique view and bottom view varies with the width-height ratio n and the internal friction angle are shown in Fig. 9 and Fig. 10, respectively.
As shown in Fig. 9, the length factor of the sliding fracture surface has a nonlinear relationship with the width-height ratio and the internal friction angle , and is distributed in a curved surface form. As shown in Fig. 10, the contour lines of the length factor of the sliding surface present an S shape distribution. The blue distribution area indicates that the critical width-height ratio () of the finite soil mass is between 0.55-0.60; when the width-height ratio 0.3, the number of the broken line segments of the sliding surface morphology increases sharply, and the characteristics of the finite soil mass change significantly. The red area is located in the upper left corner. The smaller the internal friction angle and the smaller the width-height ratio, the more broken line segments of the sliding surface morphology there are, and the more obvious the characteristics of the finite soil mass are. The width-height ratio has a significant impact on the finite soil mass, while the internal friction angle has a relatively smaller impact on the finite soil mass.
Fig. 9The oblique view on the length factor of sliding fracture surface varies with the width-height ratio n and the internal friction angle
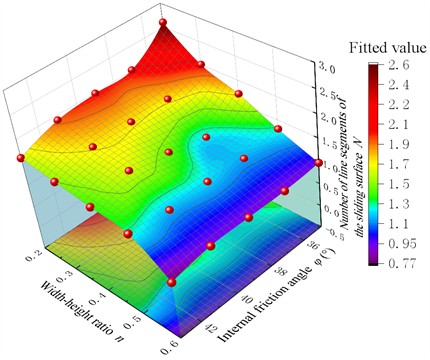
Fig. 10The bottom view on the length factor of sliding fracture surface varies with the width-height ratio n and the internal friction angle
4.5. Verification of the formula for surface function
In order to verify the reliability of the fitting Eq. (5), the results on length factor of the sliding fracture surface N by model test in this paper and the calculation results of the fitting Eq. (5) are presented in Table 8.
In order to further verify the reliability of the fitting Eq. (5), the test results of the TT mode in Wang [10] were compared with the calculation results of the fitting Eq. (5). The test device in this paper and that of Wang [10] are of the same model, but the fillers used are different. The summary results are shown in Table 9.
Table 8Comparison on the length factor of the sliding fracture surface N by model test results and calculated results of fitting Eq. (5)
Internal friction angle (°) | Width-height ratio | Length factor of sliding surface length in model tests in this paper | Derive the Eq. (5) to calculate the length factor of the sliding fracture surface | The percentage difference between the experimental value and the calculation value (%) |
34.9 | 0.2 | 2.60 | 2.35 | 10.64 |
34.9 | 0.3 | 2.00 | 2.00 | 0.00 |
34.9 | 0.4 | 1.70 | 1.64 | 3.66 |
34.9 | 0.5 | 1.30 | 1.28 | 1.56 |
34.9 | 0.6 | 0.96 | 0.90 | 6.67 |
35.6 | 0.2 | 2.20 | 2.25 | 2.22 |
37.7 | 0.2 | 2.00 | 1.97 | 1.52 |
41.0 | 0.2 | 1.90 | 1.60 | 18.75 |
43.1 | 0.2 | 1.60 | 1.42 | 12.68 |
Table 9Comparison of model test results of Wang [10] and calculated results of fitting Eq. (5)
Internal friction angle (°) | Width-height ratio | Length factor of sliding surface in model tests in Wang [10] | Derive the Eq. (5) to calculate the length factor of the sliding fracture surface | The percentage difference between the experimental value and the calculation value (%) |
30 | 0.2 | 2.80 | 3.16 | 12.86 |
30 | 0.3 | 2.70 | 2.71 | 0.37 |
30 | 0.6 | 1.20 | 1.29 | 7.50 |
30 | 0.8 | 0.30 | 0.31 | 3.33 |
From Table 8 and Table 9, it can be seen that the difference values between the model test results and the calculated results of the fitting Eq. (5) are less than 12.86 % except for one of 18.75 %, which are basically consistent. Through indoor model tests, the Eq. (5) has been verified to be reliable and worthy of promotion. The reasons for the relatively large individual differences are analyzed as follows: The numerical simulation simplifies the interaction in soil mass, ignores the internal action of sliding surface, and simplifies the contact relationship. Due to the limitations of the available verified data and statistical sources, the applicable range of the fitted Eq. (5) is defined as: 0.2 0.6 and 30° 43.1°.
The fitting Eq. (5) can be applied to the determination of the failure mode of soil mass. By comparing the calculation results of Eq. (5) with the critical value “1” of the finite soil mass, the critical state is identified when 1; when 1, it indicates a finite soil mass with a multi-segmental line sliding surface morphology, and the earth pressure is calculated using the finite soil mass theory; when 1, it represents a semi-infinite soil mass with a straight-line sliding surface, and the earth pressure is calculated using the classical Coulomb theory. The width-height ratio n and the internal friction angle are two common parameters in engineering practice. The fitting Eq. (5) has the advantages of simple parameters, easy calculation, and simple determination in the application process of engineering design and construction guidance.
5. Conclusions
The width-height ratio and internal friction angle are significant factors influencing the morphology of sliding failure surfaces. Through conducting model tests and numerical simulation analyses, the influence of the width-height ratio and internal friction angle on the sliding failure surfaces of limited soil masses is analyzed. The “length factor” is introduced to conduct quantitative research on the sliding failure surfaces. The main conclusions are as follows:
1) Under the TT mode, the morphology of the finite soil sliding surface is a series of “curves” starting from the wall heel. The smaller the width-height ratio and the internal friction angle, the more curve segments the sliding surface.
2) The length factor of sliding fracture surface vary with width-height ratio and internal friction angle are linear fitting as shown in Eq. (3) and Eq. (4), with the correlation coefficients 0.983 and 0.851, respectively, showing a high degree of linear correlation.
3) A study was conducted on the width-height ratio, internal friction angle and length factor, resulting in a binary quadratic surface function Eq. (5), with the correlation coefficients 0.922, showing a high degree of linear correlation. The isovalue lines of the length factor of the sliding fracture surface are distributed in an S shape curve pattern. Due to the limitations of the available verified data and statistical sources, the applicable range of the fitted Eq. (5) is defined as: 0.2 0.6 and 30° 43.1°.
4) By defining the length factor of the sliding surface, the influence of the width-height ratio and the internal friction angle on the folded-type sliding surface was obtained. A quantitative calculation formula for the determination of the finite soil mass was provided. The fitting Eq. (5) has the advantages of simple parameters, easy calculation and simple determination. Through indoor model tests, the formula is verified to be reliable and worthy of promotion.
5) In practical engineering applications, the length factor can be determined using Eq. (5), based on the width-to-height ratio and the internal friction angle of the fill material. This length factor is then compared with 1 to identify the potential failure mode of the soil mass, as 1, the soil mass is classified as finite. When the width-to-height ratio 0.3 and 35°, according to Eq. (5), it can be concluded that the length factor 2. At this time, the sliding surface is composed of multiple segments, forming a folded-line failure mode. In this case, the behavior of the finite soil becomes prominent, and its failure mechanism deviates significantly from the classical Coulomb failure model.
References
-
X. N. Gong, Soil Mechanics. Beijing, China: China Architecture and Building Press, 2002.
-
“Technical Code for Foundation Pit Support,” JGJ120-2012, The Professional Standards of the People’s Republic of China, China Architecture and Building Press, Beijing, 1999.
-
Y. Q. Zeng et al., “Sensitivity analysis of stability influencing factors for inverted t-type retaining wall in an active limit state based on strength reduction method and orthogonal experimental design,” IAENG International Journal of Applied Mathematics, Vol. 54, No. 11, pp. 2253–2265, 2024.
-
Y. Zeng, W. Hu, M. Chen, Y. Zhang, X. Liu, and X. Zhu, “Study on the failure characteristics of sliding surface and stability analysis of inverted t-type retaining wall in active limit state,” PLOS ONE, Vol. 19, No. 2, p. e0298337, Feb. 2024, https://doi.org/10.1371/journal.pone.0298337
-
W. Hu, Y. Zeng, X. Zhu, and T. Hu, “Determination of passive earth pressure on a cantilever retaining wall in a narrow foundation pit based on logarithmic spiral sliding surface,” International Journal of Geomechanics, Vol. 23, No. 8, pp. 1–9, Aug. 2023, https://doi.org/10.1061/ijgnai.gmeng-8516
-
W. Hu, X. Zhu, Y. Zeng, X. Liu, and C. Peng, “Active earth pressure against flexible retaining wall for finite soils under the drum deformation mode,” Scientific Reports, Vol. 12, No. 1, pp. 1–25, Jan. 2022, https://doi.org/10.1038/s41598-021-04411-4
-
X. N. Zhu, Y. Q. Zeng, W. D. Hu, X. H. Liu, and X. Y. Zhou, “Experimental study on passive earth pressure against flexible retaining wall with drum deformation,” Engineering Letters, Vol. 29, No. 2, pp. 339–350, 2021.
-
X. N. Zhu, W. D. Hu, Y. Q. Zeng, T. Hu, S. Q. Jiang, and W. W. Wang, “Experimental study on deformation characteristics and active earth pressure against the flexible retaining wall with limited width soil in foundation pit,” IAENG International Journal of Applied Mathematics, Vol. 52, No. 4, pp. 875–889, 2022.
-
X. H. Liu, S. Q. Jiang, Y. Q. Zeng, W. D. Hu, Y. Gong, and J. L. Chen, “The plastic zone of clay under foundation load: an experimental and numerical analysis,” International Journal of Simulation Modelling, Vol. 22, No. 1, pp. 145–156, Mar. 2023, https://doi.org/10.2507/ijsimm22-1-co3
-
C. Y. Wang, X. P. Liu, Z. H. Cao, X. Jiang, and J. Q. Zhang, “Experimental study on characteristics of active slip surface of limited width soil behind rigid wall,” (in Chinese), Rock and Soil Mechanics, Vol. 42, No. 11, pp. 2943–2952, 2021.
-
M. H. Yang, X. B. Dai, M. H. Zhao, and H. Luo, “Experimental study on active earth pressure of cohesionless soil with limited width behind retaining wall,” (in Chinese), Chinese Journal of Geotechnical Engineering, Vol. 38, No. 1, pp. 131–137, 2016.
-
T. Fang, S. H. Sun, C. J. Xu, H. L. Wang, R. R. Yang, and N. Wang, “Earth pressure experimental study of limited soil considering the mode of displacement of retaining wall,” (in Chinese), Journal of Railway Science and Engineering, Vol. 16, No. 5, pp. 1178–1185, 2019.
-
M. H. Khosravi, T. Pipatpongsa, and J. Takemura, “Experimental analysis of earth pressure against rigid retaining walls under translation mode,” Géotechnique, Vol. 63, No. 12, pp. 1020–1028, Sep. 2013, https://doi.org/10.1680/geot.12.p.021
-
M. X. Xia, “Experimental analysis on mechanical characteristics of narrow backfill behind foundation pit diaphragm wall,” (in Chinese), Chinese Journal of Underground Space and Engineering, Vol. 18, No. 2, pp. 546–553, 2022.
-
X. B. Dai, “Experimental study of active earth pressure of cohesionless soil with limited width behind the retaining wall and numerical simulation,” (in Chinese), Hunan University, Hunan, China, 2016.
-
S. M. Yang, “Experimental research on active earth pressure of limited cohesionless soil under immersed,” School of Civil Engineering and Architecture, East China Jiaotong University, 2018.
-
X. Jiang, “Experimental study of deformation and failure characteristics with limited width behind the retaining wall and numerical simulation,” School of Hydraulic and Environmental Engineering, Changsha University of Science and Technology, 2018.
-
Y. Y. Zhou and M. L. Ren, “An experimental study on active earth pressure behind rigid retaining wall,” Chinese Journal of Geotechnical Engineering, Vol. 12, No. 2, pp. 19–26, 1990.
-
L. Wan, X. Z. Zhang, Y. F. Wang, L. M. Xu, and C. J. Xu, “DEM study on active failure and earth pressure of cohesionless soil with limited width behind retaining wall,” (in Chinese), Journal of Civil and Environmental Engineering, Vol. 41, No. 3, pp. 19–26, 2019.
-
H. Z. Zhang, C. J. Xu, Z. B. He, Z. J. Huang, and X. H. He, “Study of active earth pressure of finite soils under different retaining wall movement modes based on discrete element method,” (in Chinese), Rock and Soil Mechanics, Vol. 43, No. 1, pp. 257–267, 2022.
-
H. Z. Zhang, C. J. Xu, L. J. Liang, S. L. Hou, R. D. Fan, and G. H. Feng, “Discrete element simulation and theoretical study of active earth pressure against rigid retaining walls under RB mode for finite soils,” (in Chinese), Rock and Soil Mechanics, Vol. 42, No. 10, pp. 2895–2907, 2021.
-
H. Z. Zhang, “Study on active earth pressure of finite soils under different retaining wall movement modes,” (in Chinese), Zhejiang University, 2022.
-
K. Fang, S. Wang, and N. W. Liu, “Active earth pressure analysis of adjacent foundation pits excavated,” (in Chinese), Journal of Henan Polytechnic University (Natural Science), Vol. 44, No. 3, pp. 1–10, 2025.
-
Z. B. Zhang, J. D. Zhou, M. L. Sun, Z. C. Liu, and Z. N. Hu, “Finite soil pressure calculation method of excavation closing to existing underground structure,” (in Chinese), Journal of Railway Science and Engineering, Vol. 20, No. 6, pp. 2091–2102, 2023.
-
X. X. Liu, B. Li, W. W. Wang, C. He, and S. Li, “Calculation of active earth pressure of finite soil based on layered principal stress trajectory,” (in Chinese), Rock and Soil Mechanics, Vol. 43, No. 5, pp. 1175–1186, 2022.
-
H. L. Wang, E. X. Song, and F. Y. Song, “Calculation of active earth pressure for limited soil between existing building and excavation,” (in Chinese), Engineering Mechanics, Vol. 31, No. 4, pp. 76–81, 2014.
-
R. Q. Xu, Y. B. Xu, K. Cheng, S. Y. Feng, and S. Shen, “Method to calculate active earth pressure considering soil arching effect under nonlimit state of clay,” (in Chinese), Chinese Journal of Geotechnical Engineering, Vol. 42, No. 2, pp. 362–371, 2020.
-
S. M. Ahmed and B. M. Basha, “Seismic active earth pressure on narrow backfill retaining walls considering strain localization,” Indian Geotechnical Journal, Vol. 51, No. 6, pp. 1263–1282, Feb. 2021, https://doi.org/10.1007/s40098-021-00514-x
-
S. Q. Yue, R. Y. Zuo, and Z. Lu, “A method for calculating active earth pressure of soil piece with a finite width between adjacent foundation pits,” (in Chinese), Rock and Soil Mechanics, Vol. 37, No. 7, pp. 2063–2069, 2016.
-
Q. F. Chen, S. X. Lei, W. Zhao, Q. H. Xiao, and C. M. Li, “Study of the earth pressure for the limited soil adjacent to underground space in urban areas based on the asymptotic method,” (in Chinese), Journal of Railway Science and Engineering, Vol. 19, No. 10, pp. 3025–3034, 2022.
-
L. Xu, H.-B. Chen, F.-Q. Chen, Y.-J. Lin, and C. Lin, “An experimental study of the active failure mechanism of narrow backfills installed behind rigid retaining walls conducted using Geo-PIV,” Acta Geotechnica, Vol. 17, No. 9, pp. 4051–4068, Feb. 2022, https://doi.org/10.1007/s11440-021-01438-9
-
J. C. Zhang, T. S. Hou, H. Y. Liu, C. Yang, and Y. S. Luo, “Model test of the active earth pressure characteristics of lightweight soil behind rigid retaining walls,” (in Chinese), China Earthquake Engineering Journal, Vol. 45, No. 6, pp. 1397–1407, Jun. 2023.
-
B. Deng, M. H. Yang, and M. H. Zhao, “Experimental study on failure mode and lateral earth pressure distribution of unsaturated sand behind retaining walls under active translation mode,” (in Chinese), Chinese Journal of Geotechnical Engineering, Vol. 45, No. 1, pp. 94–102, Jan. 2023.
-
A. S. S. Raghuram, N. Mounika, B. M. Basha, and A. A. B. Moghal, “Soil Water Characteristic Curves of Soils Exhibiting Different Plasticity,” International Journal of Geosynthetics and Ground Engineering, Vol. 9, No. 3, pp. 1–14, Apr. 2023, https://doi.org/10.1007/s40891-023-00444-z
-
A. El Hariri, A. E. E. Ahmed, and P. Kiss, “Sandy Loam Soil Shear Strength Parameters and Its Colour,” Applied Sciences, Vol. 13, No. 6, p. 3847, Mar. 2023, https://doi.org/10.3390/app13063847
-
M. Yang et al., “Study of the shear strength model of unsaturated soil in the Benggang area of southern China,” Water, Vol. 16, No. 23, p. 3528, Dec. 2024, https://doi.org/10.3390/w16233528
-
J. Niu, J. Zhang, S. Yan, X. Jiang, and F. Wang, “Seismic stability analysis of shallow overburden slopes with vegetation protection,” Environmental Earth Sciences, Vol. 83, No. 16, pp. 1–14, Aug. 2024, https://doi.org/10.1007/s12665-024-11782-0
-
L. Lin, C. S. Tang, Q. Cheng, H. Zeng, and B. Shi, “Desiccation cracking behavior of soils based on digital image correlation technique,” (in Chinese), Chinese Journal of Geotechnical Engineering, Vol. 41, No. 7, pp. 1311–1318, 2019.
-
N. Benmebarek, H. Labdi, and S. Benmebarek, “A numerical study of the active earth pressure on a rigid retaining wall for various modes of movements,” Soil Mechanics and Foundation Engineering, Vol. 53, No. 1, pp. 39–45, Apr. 2016, https://doi.org/10.1007/s11204-016-9362-z
-
K. Huang, R. Liu, Y. Sun, L. Li, Y. Xie, and X. Peng, “Study on the calculation method of active earth pressure and critical width for finite soil behind the retaining wall,” Frontiers in Earth Science, Vol. 10, No. 1, pp. 1–9, May 2022, https://doi.org/10.3389/feart.2022.883668
-
X. Liu, Y. Wang, Y. Zeng, Y. Ye, Y. Liu, and H. Cai, “The critical width-height ratio of finite soil behind retaining wall considering the compaction degree of fill under RB mode,” Journal of Measurements in Engineering, Vol. 13, No. 2, pp. 344–361, Jun. 2025, https://doi.org/10.21595/jme.2024.24457
-
X. H. Liu, Y. C. Liu, Z. F. Liu, Y. Q. Zeng, Y. X. Wang, and S. X. Liu, “Study on the influence of compaction degree of fill behind the retaining wall to the critical width-height ratio of finite soil in active failure under TT mode,” Engineering Letters, Vol. 33, No. 4, pp. 1145–1156, 2025.
About this article

The study was supported by the Natural Science Foundation of Hunan Province of China (Grant No. 2022JJ40160), the Key Scientific Program of Hunan Education Department, China (Grant No. 22A0472), the Postgraduate Scientific Research Innovation Project of Hunan Province, China (Grant No. CX20231231), and The school-enterprise research and development project of Yueyang Planning, Survey and Design Institute Co., Ltd. of Hunan Province (No. 2024430607002014).
The datasets generated during and/or analyzed during the current study are available from the corresponding author on reasonable request.
Sanxian Liu, Zuhui Long and Xiaohong Liu: conceptualization, data curation, data analysis, original draft preparation. Yongqing Zeng and Yuchen Liu: funding acquisition, investigation and methodology. Yuxing Wang and Yanzhao Liu: review and editing with constructive discussions.
The authors declare that they have no conflict of interest.
