Abstract
Engineering Asset Management (EAM) is a strategic approach focused on the optimal management of physical assets throughout their lifecycle. By integrating engineering principles with financial and operational strategies, EAM aims to enhance asset performance, reliability, and longevity while minimizing risks and costs. This holistic methodology ensures that machinery, equipment, and infrastructure operate efficiently, thereby reducing failures and maximizing productivity. A critical component of EAM is understanding the criticality of each asset within a system. Criticality analysis evaluates the potential impact of different failure modes, considering factors such as failure likelihood, consequences, system interdependencies, cost implications, and associated risks. This analysis is essential for prioritizing maintenance efforts and allocating resources effectively. Risk assessment plays a pivotal role in this context, involving the systematic identification, analysis, evaluation, and management of potential risks associated with asset failures. However, traditional risk assessment methods often face challenges due to subjectivity and variability in evaluations, which can lead to inconsistencies in maintenance decision-making. To address these challenges, this paper proposes a novel multi-stage quantitative Failure Modes, Effects, and Criticality Analysis (FMECA) framework. This approach systematically analyses failure rates, downtime, and cost implications, providing a comprehensive understanding of each failure mode's impact. By integrating these quantitative parameters, the framework enhances objectivity in risk assessment and supports more informed decision-making. It enables organisations to systematically prioritize maintenance activities and optimize resource allocation. This approach not only mitigates operational risks but also aligns asset management practices with overarching business objectives, leading to improved efficiency and reduced costs. The proposed methodology is particularly beneficial in industries such as mining, manufacturing, and aerospace, where unplanned downtime and maintenance costs can have significant operational and financial repercussions. By adopting this multi-dimensional approach, organizations can improve asset performance, enhance safety, and achieve more sustainable operations.
Highlights
- Maintenance priorities are derived from actual industry records, ensuring that strategy selection is based on real asset performance rather than assumptions.
- The proposed approach is cross-checked with both the traditional criticality assessment method and the company’s generic approach before applying the novel framework, ensuring reliability and credibility of results.
- Downtime, failure rate, and maintenance cost are integrated into a single evaluation structure, with each parameter reinforcing the others to minimise uncertainty in the final risk profile.
1. Introduction
Engineering Asset Management (EAM) is a systematic approach towards managing and maintaining physical assets throughout their lifecycle. EAM plays a crucial role in ensuring optimal performance, reliability, and longevity of physical assets. It integrates engineering, financial, and operational strategies to enhance asset reliability and performance while minimizing risks and costs. Proper asset management ensures that machinery, equipment, and infrastructure operate at peak efficiency, minimizing failures and maximizing productivity. A study by Amadi-Echendu, et al. [1] highlights that asset management plays a vital role in mitigating operational risks and ensuring compliance with safety and environmental laws. According to ISO 55000 standards [2], sustainable asset management supports efficient resource utilization, waste reduction, and compliance with environmental policies. Asset Management (AM) has traditionally been regarded as a routine discipline. However, it should now be seen as a strategic philosophy that must be integrated across all levels of an industry. By fostering awareness throughout the industry, AM can enhance the understanding of the importance of optimizing engineering asset performance, ensuring alignment between industry objectives and asset management goals [3].
The industry consists of different types of equipment that work together synchronously to form a network of equipment, which can deliver the desired output with maximum efficiency. To maintain maximum equipment efficiency, it is important to understand the criticality of every network element. Criticality is a means of assessing the effect of each failure mode within the equipment portfolio and assessing their associated risks. Criticality analysis can be an essential step in reliability engineering, providing a systematic way to identify high-risk assets and prioritize maintenance efforts. The key factors which might help to assess the criticality are failure likelihood, failure consequences, interdependency of the systems and sub-systems, cost implications and associated risks.
Risk is a very subjective topic and a very important at the same time. The understanding of the risk of a failure mode depends on the perspective of the observer which can also influence the criticality of that failure mode. Risk can be driven by one or multiple defined factors and must be assessed against these to determine the level of focus necessary to manage it. Risk management includes the application of logical and systematic methods for establishing the process of identifying, analysing, evaluating, treating, monitoring, reviewing, reporting, and recording risks. Risk assessment is that part of risk management which will help to identify and analyse the criticality of a failure mode and its consequences [4]. Risk assessment involves identifying, evaluating, and communicating the presence, characteristics, extent, frequency, influencing factors, and uncertainties associated with potential losses [5]. It has been considered a powerful approach to address public concerns and to develop sound policy and design strategy [6]. Several benchmark studies have shown that risk assessment results might differ depending on the industry professionals performing the analysis and the clients requesting them [7]. This subjectivity in the assessment process raises the question of uncertainties. Also, the future development and maintenance of the infrastructure of society will even more likely demand an intensified and quantified focus on risk [7]. Thus, due to tremendous demand of risk-based decision-making in engineering applications and a significant lack of recognition of risk analysis as a necessary discipline, there has been development of a range of practices for risk analysis [7]. These practices have been published and well defined by author Valis and Koucky [4].
In this paper we have proposed a novel means of applying common Failure Mode and Effects Analysis (FMEA)/ Failure Mode, Effects, and Criticality Analysis (FMECA) – centred tools to identify ‘critical’ process systems. This multi-layered risk assessment practice will be applied to a critical system to evaluate the influence of individual equipment failure risks within it. The paper uses a case study data for implementing the novel approach of risk assessment and compare various risk assessment methods, and parameters evaluated for the implementation of multi-stage risk assessment framework. The paper critically reviews all the results derived through different implemented risk assessment methods in this paper and showcases the advantages and limitations of the proposed novel approach.
2. Review of FMEA and FMECA methods
The advancement of mining technology has led to the creation of complex technical systems that require a systematic analytical and methodological approach to be properly understood. These systems have emerged due to the increasing demand for and interest in resource extraction. Effective risk analysis and management play a crucial role in ensuring quality and reliability within the mining industry. However, one of the main challenges in technical systems is conducting thorough risk assessments. Historically, risk management in mining has not been given sufficient attention, but there is now an urgent need for change [8]. A key approach to risk analysis involves proactive error identification through methods such as FMEA and FMECA. These methodologies break down systems at a functional level, considering failure modes as the loss of specific component functions.
The concept of FMEA originated in the 1940s within the U.S. military and was later adapted by the aerospace, automotive, and manufacturing industries [9]. FMEA is a methodology designed to identify the ways in which components, systems, or processes can fail. FMEA identifies all the potential failure modes associated with core function/s of a system or process and their effects respectively. It also evaluates the risk of each failure mode that may disrupt any such function. A failure mode is the observed reason of failure or the reason of incorrect performance [4]. To avoid failures above a nominated risk threshold, appropriate corrective actions are drafted as outputs for implementation. As per McDermott, et al. [10], FMEA has evolved into a widely used technique for improving quality and minimizing failures in both product and process design. Generally, FMEA’s are performed during the design or process development of a greenfield project or modification stages.
The applications of FMEA can be found across many industries like machinery [11-14], electronics [15], chemical [16], medicine [17, 18], textile [19, 20], aerospace, nuclear, mining and other manufacturing industries [8, 21-23]. Focusing more closely on the mining industry as an application, these practices demand strong, decision-making criteria to help define site-relevant factors that influence the detectability, severity and occurrence of each failure mode; many of which are complex and multi-dimensional in nature. These criteria help to define and understand the availability, reliability, maintainability and overall criticality of the systems. In the mining industry, this decision-making process is challenging and complex, as failure of a single item of equipment can lead to a sudden or delayed system-wide stoppage. Furthermore, buffers may also exist between adjacent systems (for example, stockpiles) which make the actual effect of a failure difficult to determine across the broader process at large. In such cases, decisions are likely focused around the system’s availability, with maintenance strategy improvement and subsequent reliability gains acting as controls to mitigate associated risks. Currently, in the mining industry decision-making processes for asset investment are largely qualitative, with assets being monitored and managed via qualitative FMEA tools or other risk-based methods [3]. Author Duda and Juzek [24] illustrates the application of FMEA method for hazard identification and process risk assessment in a coal mine which is a crucial step in risk assessment and safety management, helping to prevent accidents and ensure operational reliability. Paper [25] highlights the use of FMEA to overcome the uncertainty in the decision-making process of an underground coal mine. Most recent application of FMEA method is highlighted in a case study on risk analysis of a machine breakdown in a cement factory in Indonesia [26].
When used as a top-down analysis tool, FMEA may only identify the most significant failure modes within a system. However, when applied as a bottom-up approach, FMEA can complement Fault Tree Analysis method by uncovering additional causes and failure modes that contribute to top-level system issues. Despite its widespread adoption, traditional FMEA has limitations, including subjectivity in RPN scoring (different assessors may assign different scores), lack of consideration for failure interdependencies and inability to predict unknown failure modes. It cannot effectively detect complex failure modes involving multiple failures within a subsystem or predict the failure intervals of specific failure modes at higher system levels. Additionally, the method of calculating the Risk Priority Number (RPN) by multiplying severity, occurrence, and detection rankings can lead to inconsistencies, sometimes assigning a higher RPN to a less critical failure mode than a more severe one. This issue arises because these rankings use an ordinal scale, where the numerical values indicate relative order but not precise magnitude. For example, a ranking of “2” is not necessarily twice as severe as a ranking of “1”, nor is an “8” necessarily twice as bad as a “4”. However, multiplication treats them as if they are proportional, leading to misleading prioritization [27].
To address these limitations, modern approaches like FMECA offers an extension to FMEA theory, allowing each failure mode to be ranked according to its importance or criticality. This critical analysis is usually qualitative or semi-quantitative but may be quantified using actual failure rates [27]. The FMECA is the result of two steps: – Failure Mode and Effect Analysis (FMEA) and Criticality Analysis (CA). The CA can be aligned with two distinct alternatives: qualitatively or quantitatively. The implementation of the quantitative analysis method is well explained by author Lipol and Haq [27]. FMEA and FMECA are methodologies used to identify potential failures in a product or process. While both follow the same fundamental approach, they differ in key aspects. FMEA provides qualitative insights, whereas FMECA incorporates some quantitative data that can be measured. FMEA is commonly used in industries as a “what-if” analysis tool and is an integral part of NASA’s flight assurance program for spacecraft. On the other hand, FMECA assigns a criticality level to failure modes and is used by the U.S. Army to evaluate mission-critical equipment and systems [27]. FMECA is essentially an extended version of FMEA. To conduct FMECA, analysts first perform an FMEA and then carry out a CA. FMEA identifies failure modes and their effects, while CA ranks these failures based on their severity and occurrence rate, prioritizing the most critical ones [27].
The most recent application of FMECA can be found in the field of medicine [28, 29], manufacturing [30-34], machinery [35-38], aerospace [39, 40], and automobile [41]. Cheng, et al. [42] applied FMECA to assess the reliability of a metro door system. They compiled failure statistics for various metro door subsystems and determined their criticality levels. The analysis identified the EDCU function as the most critical subsystem. Ćatić, et al. [43] conducted a criticality analysis of the steering tie-rod joint. They first created a layout of the joint using a tree diagram, outlining its various components. Subsequently, they performed a Fault Tree Analysis (FTA) for the steering tie-rod joint. Focusing on the recent applications of FMECA in mining industry, paper [44] successfully assessed the criticality of dumper subsystems using the FMECA methodology. Criticality indices for each failure mode were determined based on failure rate, frequency, and operating time. The impact of different operating time modes on criticality rankings was also analysed. Among the eight dumper subsystems, the engine component was identified as the most critical, ranking first. Additionally, the relationship between failure occurrences and criticality was examined and validated using Spearman’s correlation test, confirming that higher failure occurrence values correspond to greater criticality. Paper [45] highlights the application of FMECA to assess and design the reliability of the coal system in the Oslomej surface mine. This approach helped identify potential failure modes, enhance reliability evaluation, and conduct a qualitative criticality analysis. As a result, key insights were gained, guiding attention toward the highest-risk areas. Paper [46] introduces a method for supporting occupational risk management in quarry blasting operations using a modified FMECA algorithm. The proposed approach systematically identifies risks and highlights key occupational hazards that should be prioritized for preventive measures. These preventive actions can be incorporated during the design phase by modifying technology or work organization, depending on the specific quarry's available options. Table 1 summarises the reviewed literature and their corresponding research gaps, and highlights how the proposed research offers improvements over existing approaches.
While the reviewed literature provides valuable contributions, the comparison in Table 1 underscores a clear and recurring gap across existing studies. These gaps collectively point to the need for a more comprehensive and data-driven approach to maintenance decision-making, one that aligns more closely with the operational realities of the mining industry. This broader need forms the foundation and motivation for the present study. As mining operations grow increasingly complex and cost-sensitive, the ability to make informed, data-driven maintenance decisions has become more critical than ever. Traditional tools such as FMEA and FMECA, while widely adopted, often rely on static and qualitative assessments that do not fully capture the dynamic and economic nature of equipment failures. There is a growing need for approaches that can translate real-world failure behaviour into actionable insights for minimizing downtime, reducing costs, and improving asset reliability. This study responds to that need by proposing a novel multi-stage quantitative risk assessment framework centred around a unique application of conventional FMEA/FMECA theory. This practice will be used to compare the influence of equipment failure modes on the overall criticality of the system in which they function. The multi-stage quantitative risk assessment framework assesses failure rate (likelihood), downtime and cost (Consequence) as quantitative elements in the FMECA framework. The work is focused on the mining industry and the data for the study was sourced from a gold mining company in Australia.
Table 1Summary of reviewed literature and their corresponding research gaps
Reviewed literature | Contribution | Research gaps | Benefits of proposed research over existing approaches |
Duda and Juzek [24] | Applies traditional FMEA for hazard identification in mining roadway development. Uses RPN scores based on severity, occurrence, and detection. | Static model with subjective RPN; lacks cost, downtime, and interdependency modelling. | Dynamic FMECA with cost/failure/downtime metrics. Supports risk updates and optimal strategy choice. |
Shariati [25] | Introduces a fuzzy FMEA approach for mining hazard analysis using linguistic variables to address uncertainty. | Handles uncertainty but lacks integration of cost/downtime and real-time data feedback. | Quantitative integration of failure data and cost; enables uncertainty-aware decision optimization. |
Fithri, et al. [26] | Conducts risk analysis of machine breakdown in a cement factory using traditional FMEA with RPN rankings. | No quantitative modelling or optimization; analysis is one-time and based on subjective scores. | Quantifies criticality using downtime/cost. Supports real-time updates and decision optimization. |
Kumar and Kumar [8] | Uses FMEA/FMECA to assess mining excavator risks and prioritize components for preventive maintenance. | Semi-quantitative; lacks cost integration and dynamic reassessment or optimization. | Adds cost/failure data into strategy prioritization with multi-stage adaptability. |
Franceschini and Galetto [21] | Applies traditional RPN using a qualitative scale method to reflect criticality. | Improves scoring logic but lacks real-world failure/cost data or dynamic system updates. | Complements scoring improvements with cost-driven maintenance optimization framework. |
KUMAR, et al. [44] | Applies FMECA to dumper subsystems using failure frequency and operating time in criticality ranking. | Based only on historical frequency and does not adapt dynamically or optimise strategy. | Integrates cost/time impact dynamically; enables adaptive criticality ranking and optimization. |
Rika, et al. [45] | Conducts FMECA for mechanical failures in a surface mine coal system; prioritizes failure modes qualitatively. | Focuses only on qualitative failure ranking; lacks cost/time modelling or iterative strategy. | Introduces economic logic to FMECA prioritization with cost-driven maintenance feedback. |
Dworzak [46] | Modifies FMECA for occupational risk in quarry blasting, emphasizing safety-based preventive strategies. | Targets safety hazards but not broader reliability, cost, or system-wide performance. | Expands scope from safety to asset-level cost-reliability prioritization under dynamic inputs. |
Daya and Leonard [47] | Proposes maintenance planning using FMECA and optimal replacement time in mining with historical failure data. | Uses historical failure data only; does not optimize across maintenance strategies. | Supports maintenance scheduling using real-world failure data and downtime cost modelling. |
Chennoufi and Chakhrit [48] | Develops a multi-dimensional, fuzzy-AHP-enhanced FMECA prioritization method across several impact domains. | Prioritization is multi-dimensional but does not account for evolving failure data or budget. | Aligns risk prioritization with multiple impact areas, adaptable to cost-aware extensions. |
ElKasrawy, et al. [49] | Implements modified FMECA with operational factors to optimize maintenance schedules in industrial case study. | No dynamic updating; cost savings shown but not embedded in a strategic decision framework. | Provides a quant model framework to balance failure impacts, operational needs, and cost. |
Zhu, et al. [50] | Proposes a multi-stage stochastic program for optimizing component maintenance over a planning horizon. | Addresses maintenance optimization but lacks component interaction and cost breakdown. | Multi-stage decision-making framework for failure-based strategy optimization. |
Zhu and Xiang [51] | Presents a CBM optimization model for multi-component systems using a multi-stage stochastic framework. | Focuses on CBM but does not link with broader FMECA or cost-centric prioritization models. | Condition-based maintenance over time optimized with real-time system health and strategy cost. |
3. Data
The work presented in the paper is based on the case study of a gold mining company in Australia. The industry failure data was collected from two different sources, one providing maintenance work order information and another providing downtime information. These were labelled ‘Selective work orders.xlsx’ and ‘Downtime.xlsx’ respectively. The raw data was recorded manually over different periods for different systems, downloaded in comma-separated value (CSV) format, and was initially analysed in MS Excel. Through this process, a new dataset was created which was largely tailored to this undertaking. The initial exploratory analysis using information originally from the ‘Downtime.xlsx’ client spreadsheet. The major focus was on extracting variables like failure modes, downtime associated with those failure modes and finally the downtime cost associated with each failure mode. As the industry manually records the data, it was difficult to find consistency in the data across the time frames as highlighted in Table 2.
Table 2Data summary
System | Time stamp |
Mill | January 2021 – October 2021 |
Crusher 1 | July 2021 – April 2022 |
Modular crusher | January 2021 – April 2022 |
Nolans crusher | January 2021 – April 2022 |
The identified critical system based on downtime from Table 2 is Modular Crusher as highlighted in Fig. 1, with its year-wise downtime bifurcation. The downtime history of individual systems presented in Fig. 1 are in minutes.
Fig. 1Analysis of system downtime
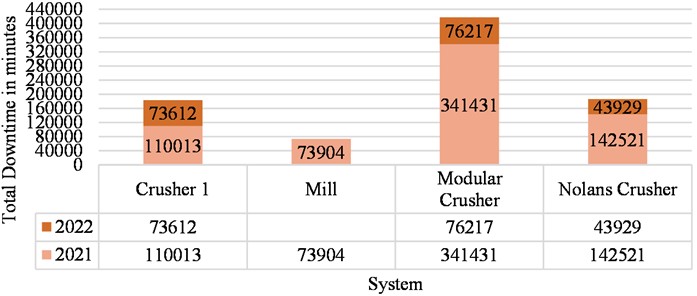
Table 3 shows the different failure modes of all the equipment associated with the Modular Crusher system.
Table 3Failure modes of all the equipment associated within the critical system
Critical system | Equipment | Failure modes |
Modular crusher | Crusher | Blocked Jaw |
Grizzly Bar Breakdown | ||
Electrical fault | ||
Hydraulic Leak | ||
Liners /Bolts | ||
Motor Breakdown | ||
Oil & Lubrication | ||
Bins Issue | ||
Maintenance | ||
Other | ||
CV 201 | Belt damaged | |
Chute Issues | ||
Electrical fault | ||
Mechanical Fault | ||
Bins Issue | ||
Other | ||
Feeder | Blockage | |
Mechanical Fault | ||
Bins Issue | ||
Electrical Fault | ||
Maintenance | ||
Liners/Bolts | ||
Others | ||
Fines conveyor | Belt damaged | |
Conveyor bogged | ||
Electrical Fault | ||
Truck delay | ||
Others | ||
Loader | Loader Unavailable | |
Maintenance | ||
Hydraulic leak | ||
Low Manning | ||
Others | ||
Product stacker | Conveyor bogged | |
Electrical Fault | ||
Commissioning | ||
Others | ||
Reject stacker | Bearings failure | |
Belt damaged | ||
Blockage | ||
Conveyor bogged | ||
Electrical fault | ||
Maintenance | ||
Mechanical fault | ||
Liners/Bolts | ||
Others | ||
Rock breaker | Hydraulic leak | |
Noise | ||
Others | ||
Screen | Bearings failure | |
Belt damaged | ||
Conveyor bogged | ||
Maintenance | ||
Electrical fault | ||
Liners/Bolts | ||
Mechanical fault | ||
Oil & Lubrication | ||
Blockage | ||
Screen mats | ||
Others | ||
Total circuit | Belt damaged | |
Blocked Jaw | ||
Conveyor bogged | ||
Maintenance | ||
Commissioning | ||
Electrical fault | ||
Low Manning | ||
Liners/Bolts | ||
Mechanical fault | ||
Noise | ||
Screen mats | ||
Others |
Some commonly observed failure modes were blockage of jaws, damaged belt, bogged conveyor, bearing failure, liners/bolts failure, oil and lubrication issues, chute issues, electrical issues, etc.
However, ‘Total Circuit’ does not resemble any equipment but rather it was a qualitative choice made by the operator to record a downtime event. for instance, if a conveyor bearing fails and interrupts the entire circuit, some operators recorded this as a ‘Total Circuit’ failure. from an asset criticality perspective, it had to be assigned to ‘conveyor’ otherwise it had no use. Some of the undefined failure modes were listed under ‘others’, and were omitted as they could not be processed.
4. Comparison of risk assessment frameworks
Using a dataset derived from the equipment listed in Table 3, outcomes from two, industry-adopted qualitative risk assessment processes will be compared against a novel, multi-stage quantitative approach. Firstly, risk assessment outcomes forwarded by traditional FMEA practices will be shown. These will be followed by outcomes from a common industry-based method. Lastly, a novel, multi-stage quantitative FMECA practice will be introduced for comparison. Not only will this highlight the influence of ‘subjectivity’ in the repeatability of qualitative risk assessment outcomes, but it will also help us understand the concept of risk by looking through different lenses.
4.1. Traditional FMEA (Failure modes and effect analysis)
The implementation of FMEA is a structured and progressive process, where each step directly influences the overall outcome. Research indicates that the effectiveness of FMEA throughout a product’s life cycle hinges on two critical factors: ensuring a comprehensive system that accurately identifies all potential failure modes and scientifically assessing the risk levels associated with these failures [52]. The traditional FMEA process follows a structured methodology consisting of seven key steps, as recommended by AIAG and VDA [53]. First step is to identify product, system, or process to be analysed. Later defining the scope, operating conditions, limitations, customer requirements and system boundaries. The next step is to identify and listing all potential failure modes for each component. Followed by determining failure effects by identifying consequences of each failure mode. Also, define the severity levels based on type of impact (Low, Medium, High). The next step is to identify failure causes and determine the root cause of each failure mode. in the next step, Risk Priority Numbers (RPN) are assigned, where risk is evaluated using three parameters; Severity (S), Occurrence (O) and Detection (D). Basically, RPN is the product of the Severity (S), Occurrence (O) and Detection (D) of a failure. (RPN = O * S * D). Higher RPN values indicate high-risk failure modes requiring immediate action. The next step is to develop risk mitigation strategies by proposing corrective actions to reduce S, O, D. Lastly, implement the corrective actions, monitor the effectiveness of risk reduction measures and conduct periodic reviews. To showcase the subjectivity of traditional FMEA risk scores, this paper reveals results from the same dataset that was analysed by three individuals, highlighted in Table 4. Due to this observed difference of opinion between the three individuals, there is always presence of uncertainties in the decision-making process. This subjectivity is largely adjudicated by those more senior in both equipment knowledge and experience. Subsequent outcomes typically form the baseline of the decisions regarding maintenance activities.
Table 4Qualitative Analysis – Standard FMEA of industry failure data from the mining company
Equipment | Failure modes | Standard FMEA | ||||||||
1st Person | 2nd Person | 3rd Person | ||||||||
Likelihood | Consequence | RPN | Likelihood | Consequence | RPN | Likelihood | Consequence | RPN | ||
Crusher | Blocked Jaw | 9 | 9 | 81 | 8 | 9 | 72 | 7 | 7 | 49 |
Grizzly Bar Breakdown | 7 | 9 | 63 | 9 | 7 | 63 | 7 | 8 | 56 | |
Electrical fault | 9 | 10 | 90 | 9 | 9 | 81 | 8 | 10 | 80 | |
Hydraulic Leak | 3 | 8 | 24 | 2 | 8 | 16 | 3 | 6 | 18 | |
Liners /Bolts | 10 | 5 | 50 | 7 | 4 | 28 | 9 | 7 | 63 | |
Motor Breakdown | 3 | 10 | 30 | 2 | 8 | 16 | 5 | 5 | 25 | |
Oil & Lubrication | 7 | 7 | 49 | 5 | 6 | 30 | 5 | 5 | 25 | |
Bins Issue | 7 | 7 | 49 | 7 | 7 | 49 | 5 | 6 | 30 | |
Maintenance | 5 | 5 | 25 | 5 | 5 | 25 | 5 | 5 | 25 | |
Other | 5 | 5 | 25 | 5 | 5 | 25 | 5 | 5 | 25 | |
CV 201 | Belt damaged | 5 | 9 | 45 | 6 | 10 | 60 | 7 | 9 | 63 |
Chute Issues | 5 | 6 | 30 | 3 | 4 | 12 | 4 | 5 | 20 | |
Electrical fault | 9 | 10 | 90 | 9 | 9 | 81 | 8 | 10 | 80 | |
Mechanical Fault | 10 | 7 | 70 | 8 | 7 | 56 | 9 | 7 | 63 | |
Bins Issue | 7 | 7 | 49 | 7 | 7 | 49 | 5 | 6 | 30 | |
Other | 5 | 5 | 25 | 5 | 5 | 25 | 5 | 5 | 25 | |
Feeder | Blockage | 9 | 9 | 81 | 8 | 9 | 72 | 7 | 7 | 49 |
Mechanical Fault | 10 | 7 | 70 | 8 | 7 | 56 | 9 | 7 | 63 | |
Bins Issue | 7 | 7 | 49 | 7 | 7 | 49 | 5 | 6 | 30 | |
Electrical Fault | 9 | 10 | 90 | 9 | 9 | 81 | 8 | 10 | 80 | |
Maintenance | 5 | 5 | 25 | 5 | 5 | 25 | 5 | 5 | 25 | |
Liners/Bolts | 10 | 5 | 50 | 7 | 4 | 28 | 9 | 7 | 63 | |
Others | 5 | 5 | 25 | 5 | 5 | 25 | 5 | 5 | 25 | |
Fines conveyor | Belt damaged | 5 | 9 | 45 | 6 | 10 | 60 | 7 | 9 | 63 |
Conveyor bogged | 5 | 9 | 45 | 6 | 10 | 60 | 7 | 9 | 63 | |
Electrical Fault | 9 | 10 | 90 | 9 | 9 | 81 | 8 | 10 | 80 | |
Truck delay | 5 | 5 | 25 | 5 | 5 | 25 | 5 | 5 | 25 | |
Others | 5 | 5 | 25 | 5 | 5 | 25 | 5 | 5 | 25 | |
Loader | Loader Unavailable | 9 | 8 | 72 | 7 | 8 | 56 | 7 | 9 | 63 |
Maintenance | 5 | 5 | 25 | 5 | 5 | 25 | 5 | 5 | 25 | |
Hydraulic leak | 3 | 8 | 24 | 2 | 8 | 16 | 3 | 6 | 18 | |
Low Manning | 5 | 5 | 25 | 5 | 5 | 25 | 5 | 5 | 25 | |
Others | 5 | 5 | 25 | 5 | 5 | 25 | 5 | 5 | 25 | |
Product stacker | Conveyor bogged | 5 | 9 | 45 | 6 | 10 | 60 | 7 | 9 | 63 |
Electrical Fault | 9 | 10 | 90 | 9 | 9 | 81 | 8 | 10 | 80 | |
Commissioning | 5 | 5 | 25 | 5 | 5 | 25 | 5 | 5 | 25 | |
Others | 5 | 5 | 25 | 5 | 5 | 25 | 5 | 5 | 25 | |
Reject stacker | Bearings failure | 1 | 10 | 10 | 3 | 8 | 24 | 4 | 8 | 32 |
Belt damaged | 5 | 9 | 45 | 6 | 10 | 60 | 7 | 9 | 63 | |
Blockage | 9 | 9 | 81 | 8 | 9 | 72 | 7 | 7 | 49 | |
Conveyor bogged | 5 | 9 | 45 | 6 | 10 | 60 | 7 | 9 | 63 | |
Electrical fault | 9 | 10 | 90 | 9 | 9 | 81 | 8 | 10 | 80 | |
Maintenance | 5 | 5 | 25 | 5 | 5 | 25 | 5 | 5 | 25 | |
Mechanical fault | 10 | 9 | 90 | 8 | 7 | 56 | 9 | 7 | 63 | |
Liners/Bolts | 10 | 5 | 50 | 7 | 4 | 28 | 9 | 7 | 63 | |
Others | 5 | 5 | 25 | 5 | 5 | 25 | 5 | 5 | 25 | |
Rock breaker | Hydraulic leak | 3 | 8 | 24 | 2 | 8 | 16 | 3 | 6 | 18 |
Noise | 10 | 9 | 90 | 9 | 9 | 81 | 9 | 10 | 90 | |
Others | 5 | 5 | 25 | 5 | 5 | 25 | 5 | 5 | 25 | |
Screen | Bearings failure | 1 | 10 | 10 | 3 | 8 | 24 | 4 | 8 | 32 |
Belt damaged | 5 | 9 | 45 | 6 | 10 | 60 | 7 | 9 | 63 | |
Conveyor bogged | 5 | 9 | 45 | 6 | 10 | 60 | 7 | 9 | 63 | |
Maintenance | 5 | 5 | 25 | 5 | 5 | 25 | 5 | 5 | 25 | |
Electrical fault | 9 | 10 | 90 | 9 | 9 | 81 | 8 | 10 | 80 | |
Liners/Bolts | 10 | 5 | 50 | 7 | 4 | 28 | 9 | 7 | 63 | |
Mechanical fault | 10 | 9 | 90 | 8 | 7 | 56 | 9 | 7 | 63 | |
Oil & Lubrication | 7 | 7 | 49 | 5 | 6 | 30 | 5 | 5 | 25 | |
Blockage | 9 | 9 | 81 | 8 | 9 | 72 | 7 | 7 | 49 | |
Screen mats | 8 | 6 | 48 | 5 | 5 | 25 | 5 | 6 | 30 | |
Others | 5 | 5 | 25 | 5 | 5 | 25 | 5 | 5 | 25 | |
Total circuit | Belt damaged | 5 | 9 | 45 | 6 | 10 | 60 | 7 | 9 | 63 |
Blocked Jaw | 9 | 9 | 81 | 8 | 9 | 72 | 7 | 7 | 49 | |
Conveyor bogged | 5 | 9 | 45 | 6 | 10 | 60 | 7 | 9 | 63 | |
Maintenance | 5 | 5 | 25 | 5 | 5 | 25 | 5 | 5 | 25 | |
Commissioning | 5 | 5 | 25 | 5 | 5 | 25 | 5 | 5 | 25 | |
Electrical fault | 9 | 10 | 90 | 9 | 9 | 81 | 8 | 10 | 80 | |
Low Manning | 5 | 5 | 25 | 5 | 5 | 25 | 5 | 5 | 25 | |
Liners/Bolts | 10 | 5 | 50 | 7 | 4 | 28 | 9 | 7 | 63 | |
Mechanical fault | 10 | 9 | 90 | 8 | 7 | 56 | 9 | 7 | 63 | |
Noise | 10 | 9 | 90 | 9 | 9 | 81 | 9 | 10 | 90 | |
Screen mats | 8 | 6 | 48 | 5 | 5 | 25 | 5 | 6 | 30 | |
Others | 5 | 5 | 25 | 5 | 5 | 25 | 5 | 5 | 25 | |
4.2. Generic risk assessment framework implemented by the mining company
The gold mining company examined in this paper adopts a generic risk assessment framework which follows a risk matrix based on consequence and likelihood. Table 5 shows the supporting information table used to determine the overall consequence score that should be applied to a risk matrix when assessing each failure mode. a series of metric that aligns with the greatest ‘fears’ of the business and are separately assessed. Depending on the process adopted by an organisation, either the average score of all metrics becomes the ‘overall’ consequence rating, or the most severe rating of any one metric. Table 6 also shows a similar information table to assist with ‘likelihood’ ratings. in this case, both ‘likelihood’ and ‘consequence’ tables offer 5 possible rating scores; leading to a 5x5 risk matrix with 25 possible risk score outcomes.
Table 5Generic risk consequence matrix used by the mining company
Description | |||
Consequence | Injury or Illness | Environment | Property damage |
Insignificant | No treatment required | Category 1 - Little or no environmental impact (e.g. Minor contained spill) | < $20,000 |
Minor | First aid treatment required | Category 2 - Small and/or localised impact. Large, contained spill. (e.g. mill spillage outside bund) | $20,000 - $200,000 |
Moderate | Medical treatment required | Category 3 - Substantial environmental impact. (e.g. Breach of license conditions) | $200,000 - $2,000,000 |
Major | Hospitalisation and/or specialist treatment required | Category 4 - Serious environmental impact. May impact off-lease areas | $2,000,000 - $10,000,000 |
Catastrophic | Fatality or Permanently Disabling Injury | Category 5 - Disastrous and/or widespread environmental impact. (Tails dam beach) | > $10,000,000 |
Table 6Generic risk likelihood matrix used by the mining company
Likelihood | Description | |
Almost certain | The event is most likely to occur in most circumstances | > once per week |
Likely | The event will probably occur in most circumstances | > once per month |
Possible | The event might occur at some point | > once per year |
Unlikely | The event could occur at some time | > once per two years |
Rare | The event may occur only in exceptional circumstances | < once per two years |
Once the consequence of the risk has been established, the risk ranking can be obtained by aligning this with the probability of the consequence being realised. The subsequent information table to determine the probability is provided in Table 7.
Table 7Generic risk matrix
Likelihood | Consequence | ||||
Insignificant | Minor | Moderate | Major | Catastrophic | |
Almost certain | H(11) | H(16) | E(20) | E(23) | E(25) |
Likely | M(7) | H(12) | H(17) | E(21) | E(24) |
Possible | L(4) | M(8) | H(13) | E(18) | E(22) |
Unlikely | L(2) | L(5) | M(9) | H(14) | E(19) |
Rare | L(1) | L(3) | M(6) | H(10) | H(15) |
Risk Score is derived by combining estimates of consequence and likelihood (probability) in the context of existing control measures. The results of the risk assessment are then compiled into a ranked list for further evaluation. Following this, appropriate controls are determined for risks above a predefined level of business exposure. Table 8 highlights the results of the qualitative risk assessment procedure performed on the same identified failure modes using the company’s generic approach.
Table 8Qualitative analysis – company’s generic framework
Equipment | Failure modes | Generic procedure | ||
Likelihood | Consequence | Risk score | ||
Crusher | Blocked Jaw | Almost Certain | Major | E23 |
Grizzly Bar Breakdown | Possible | Insignificant | L4 | |
Electrical fault | Almost Certain | Major | E23 | |
Hydraulic Leak | Possible | Major | E18 | |
Liners /Bolts | Almost Certain | Moderate | E20 | |
Motor Breakdown | Rare | Major | H10 | |
Oil & Lubrication | Almost Certain | Minor | H16 | |
Bins Issue | Likely | Minor | H12 | |
Maintenance | Possible | Moderate | H13 | |
Other | Possible | Moderate | H13 | |
CV 201 | Belt damaged | Rare | Major | H10 |
Chute Issues | Likely | Minor | H12 | |
Electrical fault | Almost Certain | Major | E23 | |
Mechanical Fault | Almost Certain | Moderate | E20 | |
Bins Issue | Likely | Minor | H12 | |
Other | Possible | Moderate | H13 | |
Feeder | Blockage | Almost Certain | Major | E23 |
Mechanical Fault | Almost Certain | Moderate | E20 | |
Bins Issue | Likely | Minor | H12 | |
Electrical Fault | Almost Certain | Major | E23 | |
Maintenance | Possible | Moderate | H13 | |
Liners/Bolts | Almost Certain | Moderate | E20 | |
Others | Possible | Moderate | H13 | |
Fines conveyor | Belt damaged | Rare | Major | H10 |
Conveyor bogged | Almost Certain | Major | E23 | |
Electrical Fault | Almost Certain | Major | E23 | |
Truck delay | Possible | Minor | M8 | |
Others | Possible | Moderate | H13 | |
Loader | Loader Unavailable | Almost Certain | Major | E23 |
Maintenance | Possible | Moderate | H13 | |
Hydraulic leak | Possible | Major | E18 | |
Low Manning | Possible | Minor | M8 | |
Others | Possible | Moderate | H13 | |
Product stacker | Conveyor bogged | Almost Certain | Major | E23 |
Electrical Fault | Almost Certain | Major | E23 | |
Commissioning | Rare | Minor | L3 | |
Others | Possible | Moderate | H13 | |
Reject stacker | Bearings failure | Almost Certain | Catastrophic | E25 |
Belt damaged | Rare | Major | H10 | |
Blockage | Almost Certain | Major | E23 | |
Conveyor bogged | Almost Certain | Major | E23 | |
Electrical fault | Almost Certain | Major | E23 | |
Maintenance | Possible | Moderate | H13 | |
Mechanical fault | Almost Certain | Moderate | E20 | |
Liners/Bolts | Almost Certain | Moderate | E20 | |
Others | Possible | Moderate | H13 | |
Rock breaker | Hydraulic leak | Possible | Major | E18 |
Noise | Almost Certain | Minor | H16 | |
Others | Possible | Moderate | H13 | |
Screen | Bearings failure | Almost Certain | Catastrophic | E25 |
Belt damaged | Rare | Major | H10 | |
Conveyor bogged | Almost Certain | Major | E23 | |
Maintenance | Possible | Moderate | H13 | |
Electrical fault | Almost Certain | Major | E23 | |
Liners/Bolts | Almost Certain | Moderate | E20 | |
Mechanical fault | Almost Certain | Moderate | E20 | |
Oil & Lubrication | Almost Certain | Minor | H16 | |
Blockage | Almost Certain | Major | E23 | |
Screen mats | Likely | Moderate | H17 | |
Others | Possible | Moderate | H13 | |
Total circuit | Belt damaged | Rare | Major | H10 |
Blocked Jaw | Almost Certain | Major | E23 | |
Conveyor bogged | Almost Certain | Major | E23 | |
Maintenance | Possible | Moderate | H13 | |
Commissioning | Rare | Minor | L3 | |
Electrical fault | Almost Certain | Major | E23 | |
Low Manning | Possible | Minor | M8 | |
Liners/Bolts | Almost Certain | Moderate | E20 | |
Mechanical fault | Almost Certain | Moderate | E20 | |
Noise | Almost Certain | Minor | H16 | |
Screen mats | Likely | Moderate | H17 | |
Others | Possible | Moderate | H13 | |
4.3. Multi-stage quantitative FMECA (failure modes, effects and criticality analysis) - a novel approach
The multi-stage quantitative FMECA framework introduced in this paper has been designed in multiple stages and is a novel quantitative way to remove uncertainties from the decision-making process. It also offers a means of ranking the most critical equipment of an identified critical system. Multi-stage quantitative FMECA framework is essential because it provides a comprehensive, structured, and adaptive approach to identifying, analysing, and mitigating risks. It enhances thoroughness, prioritization, and adaptability, making it an essential strategy for effective risk management. It reduces uncertainties, improves system reliability, and helps organizations take proactive, data-driven decisions to prevent failures and accidents. While traditional FMEA and standard FMECA are widely used for risk assessment, they have certain limitations, such as subjectivity, lack of dynamic analysis, and difficulty in handling complex failure interactions. A multi-stage quantitative FMECA framework approach helps overcome these challenges in the following ways by filtering a failure mode through different quantitative elements. This helps in reducing the uncertainty in the decision-making process, addresses complex failure interactions, improves risk prioritisation and decision-making, enhances adaptability to different risk environments, etc. Each stage of this process is designed to assess failure rate (likelihood), downtime and cost (Consequence) as presented in Table 9.
The framework is designed by defining the system and functional decomposition; where the identified critical system is analysed and breakdown into subsystems, components, and failure modes. Later, assess the failure rate (likelihood) of failure modes with the help of Table 6. Followed by the assessment of the event total downtime in hours. Lastly, the cost parameter is evaluated with the help of Table 5 to assess the total loss per event which is the consequence of the failure mode. Finally, the risk score is evaluated by referring the ‘Generic Risk Matrix’ highlighted in Table 7.
Table 9Quantitative Analysis – Multi-Stage FMECA (A novel approach)
Equipment | Failure modes | Quantitative Analysis | ||||||||
Failure rate (likelihood) | Event total downtime in minutes | Event total downtime in Hrs | Total loss/event (consequence) | Risk score | ||||||
Crusher | Blocked Jaw | 183 | > once per week | Almost Certain | 11167 | 186.12 | $18,306.56 | <$20K | Insignificant | H11 |
Grizzly Bar Breakdown | 10 | > once per month | Likely | 3105 | 51.75 | $93,150.00 | $20K - $200K | Minor | H12 | |
Electrical fault | 27 | > once per week | Almost Certain | 1833 | 30.55 | $20,366.67 | $20K - $200K | Minor | H16 | |
Hydraulic Leak | 1 | > once per week | Almost Certain | 180 | 3.00 | $54,000.00 | $20K - $200K | Minor | H16 | |
Liners /Bolts | 9 | > once per month | Likely | 5400 | 90.00 | $180,000.00 | $20K - $200K | Minor | H12 | |
Motor Breakdown | 15 | > once per month | Likely | 6193 | 103.22 | $123,860.00 | $20K - $200K | Minor | H12 | |
Oil & Lubrication | 2 | > once per month | Likely | 110 | 1.83 | $16,500.00 | <$20K | Insignificant | M7 | |
Bins Issue | 19 | > once per month | Likely | 337 | 5.62 | $5,321.05 | <$20K | Insignificant | M7 | |
Maintenance | 8 | > once per month | Likely | 1123 | 18.72 | $42,112.50 | $20K - $200K | Minor | H12 | |
Other | 16 | > once per month | Likely | 1691 | 28.18 | $31,706.25 | $20K - $200K | Minor | H12 | |
CV 201 | Belt damaged | 12 | > once per month | Likely | 7060 | 117.67 | $176,500.00 | $20K - $200K | Minor | H12 |
Chute Issues | 32 | > once per month | Likely | 410 | 6.83 | $3,843.75 | <$20K | Insignificant | M7 | |
Electrical fault | 45 | > once per week | Almost Certain | 1594 | 26.57 | $10,626.67 | <$20K | Insignificant | H11 | |
Mechanical Fault | 2 | > once per year | Possible | 30 | 0.50 | $4,500.00 | <$20K | Insignificant | L4 | |
Bins Issue | 1 | > once per year | Possible | 720 | 12.00 | $216,000.00 | $200K - $2000K | Moderate | H13 | |
Other | 7 | > once per month | Likely | 651 | 10.85 | $27,900.00 | $20K - $200K | Minor | H12 | |
Feeder | Blockage | 23 | > once per week | Almost Certain | 2293 | 38.22 | $29,908.70 | $20K - $200K | Minor | H16 |
Mechanical Fault | 12 | > once per week | Almost Certain | 5118 | 85.30 | $127,950.00 | $20K - $200K | Minor | H16 | |
Bins Issue | 99 | > once per week | Almost Certain | 1705 | 28.42 | $5,166.67 | <$20K | Insignificant | H11 | |
Electrical Fault | 10 | > once per week | Almost Certain | 6497 | 108.28 | $194,910.00 | $20K - $200K | Minor | H16 | |
Maintenance | 1 | > once per year | Possible | 300 | 5.00 | $90,000.00 | $20K - $200K | Minor | M8 | |
Liners/Bolts | 1 | > once per year | Possible | 390 | 6.50 | $117,000.00 | $20K - $200K | Minor | M8 | |
Others | 5 | > once per month | Likely | 44 | 0.73 | $2,640.00 | <$20K | Insignificant | M7 | |
Fines Conveyor | Belt damaged | 1 | > once per year | Possible | 75 | 1.25 | $22,500.00 | $20K - $200K | Minor | M8 |
Conveyor bogged | 1 | > once per year | Possible | 15 | 0.25 | $4,500.00 | <$20K | Insignificant | L4 | |
Electrical Fault | 8 | > once per week | Almost Certain | 416 | 6.93 | $15,600.00 | <$20K | Insignificant | H11 | |
Truck delay | 1 | > once per year | Possible | 720 | 12.00 | $216,000.00 | $200K - $2000K | Moderate | H13 | |
Others | 9 | > once per month | Likely | 159 | 2.65 | $5,300.00 | <$20K | Insignificant | M7 | |
Loader | Loader Unavailable | 72 | > once per week | Almost Certain | 1123 | 18.72 | $4,679.17 | <$20K | Insignificant | H11 |
Maintenance | 2 | > once per year | Possible | 29 | 0.48 | $4,350.00 | <$20K | Insignificant | L4 | |
Hydraulic leak | 2 | > once per year | Possible | 85 | 1.42 | $12,750.00 | <$20K | Insignificant | L4 | |
Low Manning | 11 | > once per month | Likely | 427 | 7.12 | $11,645.45 | <$20K | Insignificant | M7 | |
Others | 19 | > once per month | Likely | 231 | 3.85 | $3,647.37 | <$20K | Insignificant | M7 | |
Product stacker | Conveyor bogged | 1 | > once per year | Possible | 60 | 1.00 | $18,000.00 | <$20K | Insignificant | L4 |
Electrical Fault | 3 | > once per year | Possible | 60 | 1.00 | $6,000.00 | <$20K | Insignificant | L4 | |
Commissioning | 1 | > once per year | Possible | 730 | 12.17 | $219,000.00 | $200K - $2000K | Moderate | H13 | |
Others | 5 | > once per month | Likely | 42 | 0.70 | $2,520.00 | <$20K | Insignificant | M7 | |
Reject Stacker | Bearings failure | 2 | > once per year | Possible | 1140 | 19.00 | $171,000.00 | $20K - $200K | Minor | M8 |
Belt damaged | 5 | > once per year | Possible | 2838 | 47.30 | $170,280.00 | $20K - $200K | Minor | M8 | |
Blockage | 13 | > once per week | Almost Certain | 692 | 11.53 | $15,969.23 | <$20K | Insignificant | H11 | |
Conveyor bogged | 38 | > once per week | Almost Certain | 2143 | 35.72 | $16,918.42 | <$20K | Insignificant | H11 | |
Electrical fault | 42 | > once per week | Almost Certain | 1551 | 25.85 | $11,078.57 | <$20K | Insignificant | H11 | |
Maintenance | 9 | > once per month | Likely | 898 | 14.97 | $29,933.33 | $20K - $200K | Minor | H12 | |
Mechanical fault | 3 | > once per month | Likely | 740 | 12.33 | $74,000.00 | $20K - $200K | Minor | H12 | |
Liners/Bolts | 1 | > once per year | Possible | 70 | 1.17 | $21,000.00 | $20K - $200K | Minor | M8 | |
Others | 14 | > once per month | Likely | 421 | 7.02 | $9,021.43 | <$20K | Insignificant | M7 | |
Rock Breaker | Hydraulic leak | 1 | > once per year | Possible | 60 | 1.00 | $18,000.00 | <$20K | Insignificant | L4 |
Noise | 1 | > once per year | Possible | 720 | 12.00 | $216,000.00 | $200K - $2000K | Moderate | H13 | |
Others | 1 | > once per year | Possible | 5 | 0.08 | $1,500.00 | <$20K | Insignificant | L4 | |
Screen | Bearings failure | 12 | > once per week | Almost Certain | 8180 | 136.33 | $204,500.00 | $200K - $2000K | Moderate | E20 |
Belt damaged | 5 | > once per week | Almost Certain | 1730 | 28.83 | $103,800.00 | $20K - $200K | Minor | H16 | |
Conveyor bogged | 15 | > once per week | Almost Certain | 945 | 15.75 | $18,900.00 | <$20K | Insignificant | H11 | |
Maintenance | 22 | > once per week | Almost Certain | 2202 | 36.70 | $30,027.27 | $20K - $200K | Minor | H16 | |
Electrical fault | 4 | > once per month | Likely | 185 | 3.08 | $13,875.00 | <$20K | Insignificant | M7 | |
Liners/Bolts | 4 | > once per month | Likely | 312 | 5.20 | $23,400.00 | $20K - $200K | Minor | H12 | |
Mechanical fault | 33 | > once per week | Almost Certain | 18720 | 312.00 | $170,181.82 | $20K - $200K | Minor | H16 | |
Oil & Lubrication | 1 | > once per year | Possible | 120 | 2.00 | $36,000.00 | $20K - $200K | Minor | M8 | |
Blockage | 3 | > once per month | Likely | 78 | 1.30 | $7,800.00 | <$20K | Insignificant | M7 | |
Screen mats | 7 | > once per month | Likely | 1810 | 30.17 | $77,571.43 | $20K - $200K | Minor | H12 | |
Others | 6 | > once per month | Likely | 230 | 3.83 | $11,500.00 | <$20K | Insignificant | M7 | |
Total Circuit | Belt damaged | 5 | > once per month | Likely | 1039 | 17.32 | $62,340.00 | $20K - $200K | Minor | H12 |
Blocked Jaw | 9 | > once per week | Almost Certain | 448 | 7.47 | $14,933.33 | <$20K | Insignificant | H11 | |
Conveyor bogged | 15 | > once per month | Likely | 1234 | 20.57 | $24,680.00 | $20K - $200K | Minor | H12 | |
Maintenance | 226 | > once per week | Almost Certain | 40065 | 667.75 | $53,183.63 | $20K - $200K | Minor | H16 | |
Commissioning | 7 | > once per year | Possible | 4445 | 74.08 | $190,500.00 | $20K - $200K | Minor | M8 | |
Electrical fault | 28 | > once per week | Almost Certain | 3098 | 51.63 | $33,192.86 | $20K - $200K | Minor | H16 | |
Low Manning | 16 | > once per week | Almost Certain | 4904 | 81.73 | $91,950.00 | $20K - $200K | Minor | H16 | |
Liners/Bolts | 6 | > once per month | Likely | 3270 | 54.50 | $163,500.00 | $20K - $200K | Minor | H12 | |
Mechanical fault | 29 | > once per week | Almost Certain | 16416 | 273.60 | $169,820.69 | $20K - $200K | Minor | H16 | |
Noise | 294 | > once per week | Almost Certain | 203155 | 3385.92 | $207,301.02 | $200K - $2000K | Moderate | E20 | |
Screen mats | 1 | > once per year | Possible | 105 | 1.75 | $31,500.00 | $20K - $200K | Minor | M8 | |
Others | 792 | > once per month | Likely | 30052 | 500.87 | $11,383.33 | <$20K | Insignificant | M7 | |
5. Comparison of the three methods
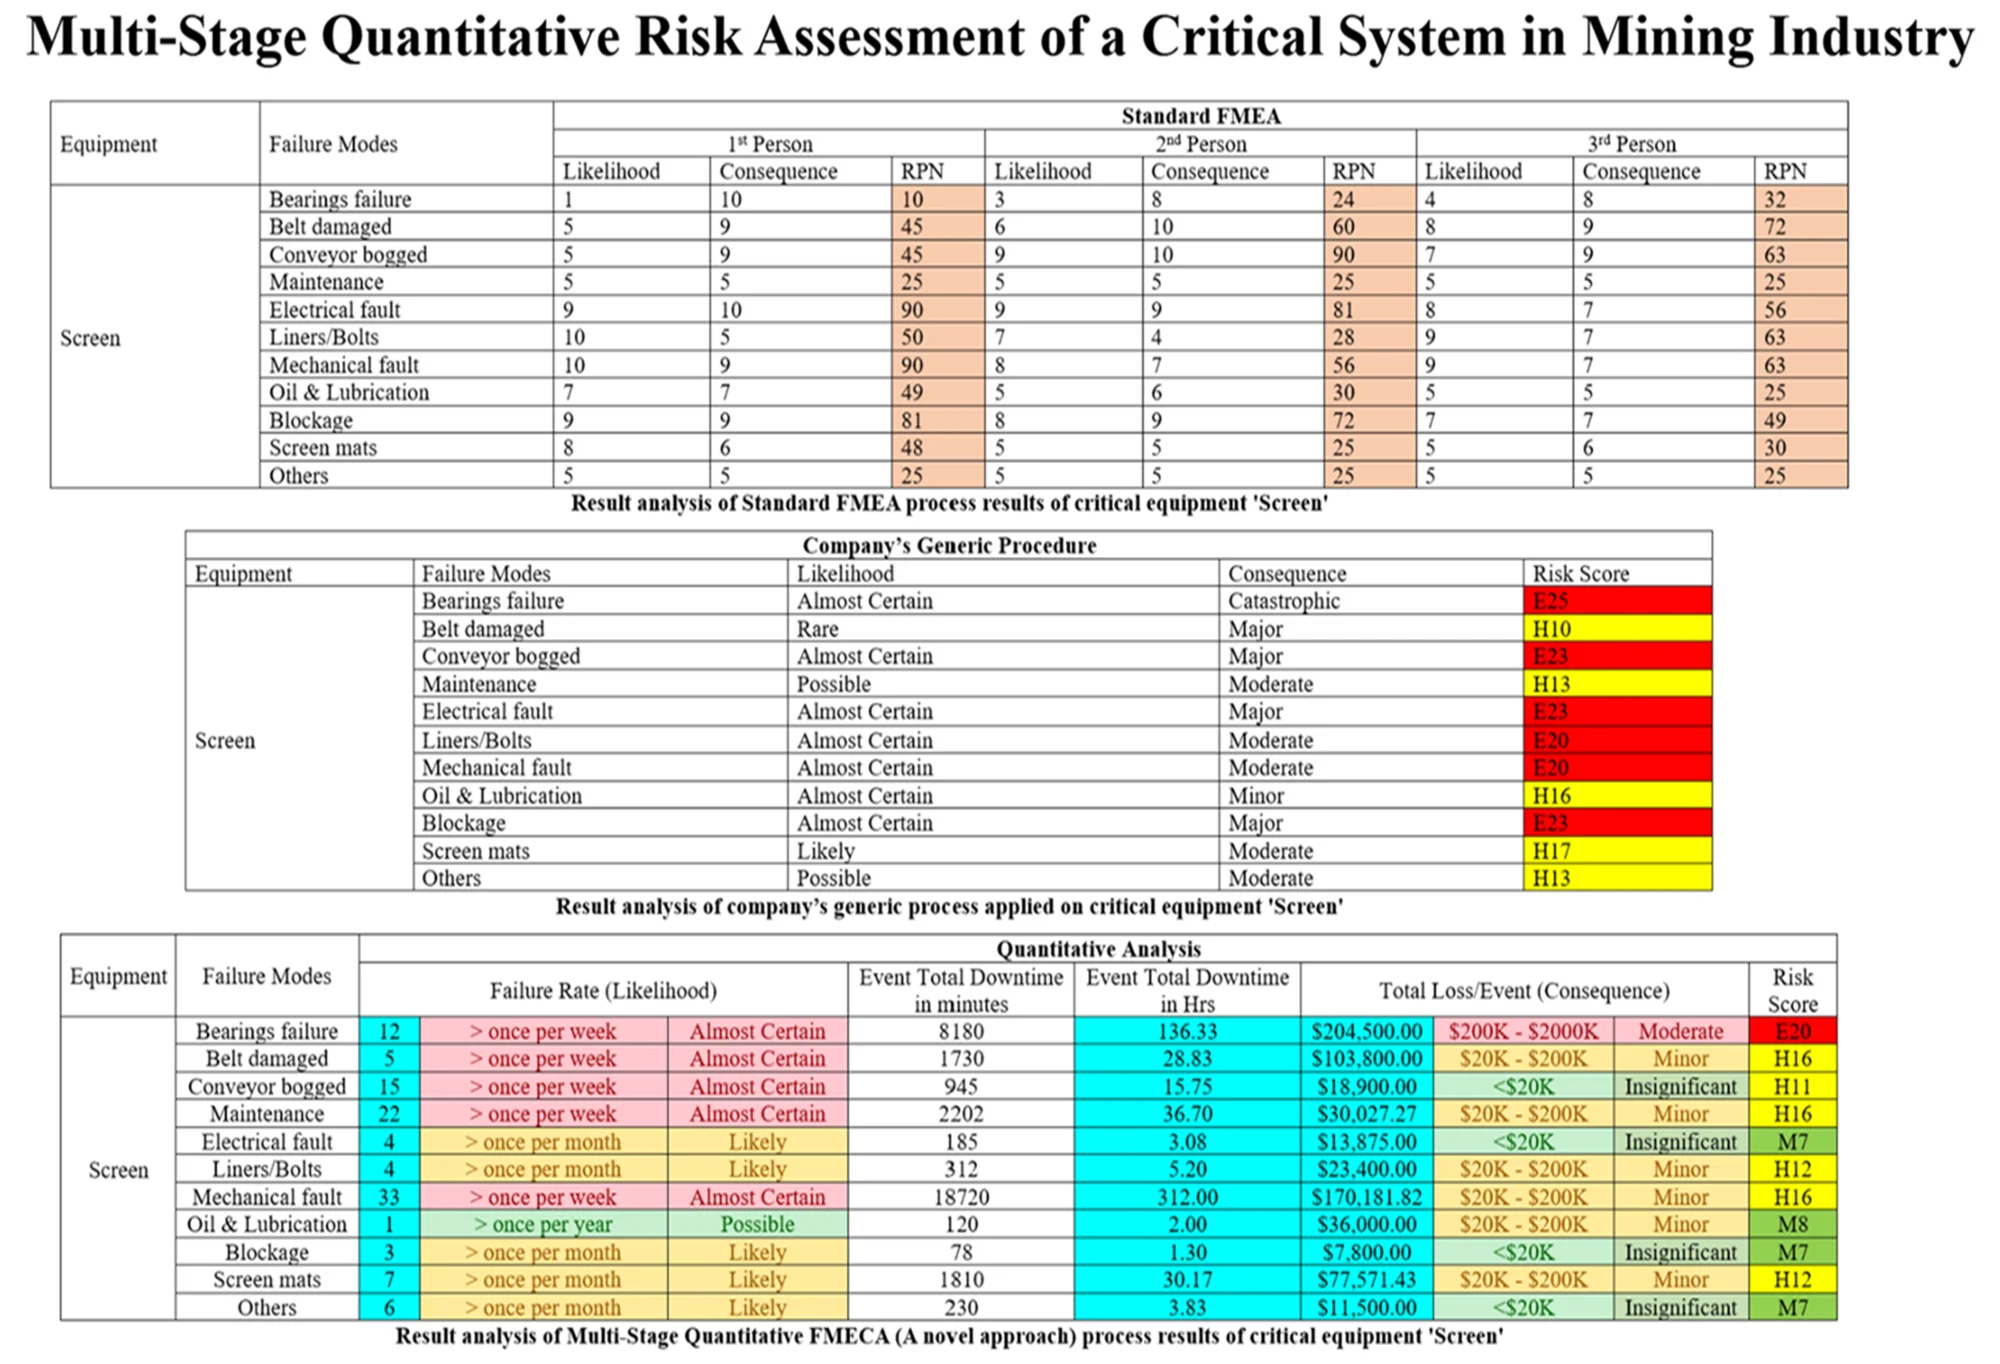
The three different approaches explained in this paper yields three different results. to understand these better, this section, compares each of these approaches by focusing on a specific critical equipment, the ‘Screen’. Table 10 displays the standard FMEA process results. as mentioned earlier in Section 4.1, the RPN is the product of the occurrence (O), severity (S) and detection (D) of a failure (RPN = O * S * D). in this example, we will focus on the occurrence (O) and severity (S) to measure the likelihood and consequence of the failure mode respectively. Further to this, detectability is an additional measure associated with the ‘monitoring effectiveness’ of a failure mode. It requires an intricate knowledge of the maintenance strategies that safeguard the failure mode to be applied consistently. This factor has been omitted from this study due to this ‘intricate knowledge’ being largely unavailable. if the data is more granular and if more strategy information is available then ‘detectability’ should be included, unfortunately that is the constraint of this study.
According to the 1st person, risk-prone failure modes include ‘Electrical fault’ and ‘Mechanical fault’ which have been assigned an RPN of 90. Conversely, the 2nd and 3rd identify the most risk-prone failure modes to be ‘conveyor bogged’ and ‘belt damaged’ respectively. Along with the inconsistency in identifying the most risk-prone failure mode, there is also widespread variation when the RPN value is ranked highest to lowest in each case. This indicates that there is significant uncertainty in the maintenance decision-making process.
Table 10Analysis of standard FMEA process results of critical equipment “Screen”
Equipment | Failure modes | Standard FMEA | ||||||||
1st person | 2nd person | 3rd person | ||||||||
Likelihood | Consequence | RPN | Likelihood | Consequence | RPN | Likelihood | Consequence | RPN | ||
Screen | Bearings failure | 1 | 10 | 10 | 3 | 8 | 24 | 4 | 8 | 32 |
Belt damaged | 5 | 9 | 45 | 6 | 10 | 60 | 8 | 9 | 72 | |
Conveyor bogged | 5 | 9 | 45 | 9 | 10 | 90 | 7 | 9 | 63 | |
Maintenance | 5 | 5 | 25 | 5 | 5 | 25 | 5 | 5 | 25 | |
Electrical fault | 9 | 10 | 90 | 9 | 9 | 81 | 8 | 7 | 56 | |
Liners/Bolts | 10 | 5 | 50 | 7 | 4 | 28 | 9 | 7 | 63 | |
Mechanical fault | 10 | 9 | 90 | 8 | 7 | 56 | 9 | 7 | 63 | |
Oil & Lubrication | 7 | 7 | 49 | 5 | 6 | 30 | 5 | 5 | 25 | |
Blockage | 9 | 9 | 81 | 8 | 9 | 72 | 7 | 7 | 49 | |
Screen mats | 8 | 6 | 48 | 5 | 5 | 25 | 5 | 6 | 30 | |
Others | 5 | 5 | 25 | 5 | 5 | 25 | 5 | 5 | 25 | |
Table 11 highlights the application of the company’s generic process to the same piece of critical equipment, the ‘Screen’. According to generic approach the most risk-prone is ‘bearings failure’ with risk score as E25.
Table 11Result analysis of company’s generic process applied on critical equipment, the “Screen”
Company’s generic procedure | ||||
Equipment | Failure modes | Likelihood | Consequence | Risk score |
Screen | Bearings failure | Almost Certain | Catastrophic | E25 |
Belt damaged | Rare | Major | H10 | |
Conveyor bogged | Almost Certain | Major | E23 | |
Maintenance | Possible | Moderate | H13 | |
Electrical fault | Almost Certain | Major | E23 | |
Liners/Bolts | Almost Certain | Moderate | E20 | |
Mechanical fault | Almost Certain | Moderate | E20 | |
Oil & Lubrication | Almost Certain | Minor | H16 | |
Blockage | Almost Certain | Major | E23 | |
Screen mats | Likely | Moderate | H17 | |
Others | Possible | Moderate | H13 | |
Before explaining the proposed approach of this paper, which is known as multi-stage quantitative FMECA, the different parameters of this framework are analysed. This is important for understanding, as there are specific factors that are assessed individually using a more defined classification system. This helps to significantly improve decision-making uncertainty from the previous approach.
Turning our attention to the novel approach, the failure modes will be assessed quantitatively using two parameters. the first being ‘failure rate’, which is a ‘likelihood’ measure, and the second being ‘downtime’, which is often a dominant measure for ‘consequence’ in the context of equipment failure modes. Initially, the failure rate of all failure modes in the example will be calculated, followed by its corresponding downtime in hours. Table 12 and Table 13 display the corresponding results.
Thus, in the first stage, ‘Mechanical fault’ failure mode is of high priority with 33 failure occurrences over an annualised period. This corresponds to an ‘Almost Certain’ rating when the company’s generic (industry-aligned) risk likelihood matrix is applied.
Table 12Analysis of failure rate
Equipment | Failure modes | Failure rate (likelihood) | ||
Screen | Bearings failure | 12 | > once per week | Almost Certain |
Belt damaged | 5 | > once per week | Almost Certain | |
Conveyor bogged | 15 | > once per week | Almost Certain | |
Maintenance | 22 | > once per week | Almost Certain | |
Electrical fault | 4 | > once per month | Likely | |
Liners/Bolts | 4 | > once per month | Likely | |
Mechanical fault | 33 | > once per week | Almost Certain | |
Oil & Lubrication | 1 | > once per year | Possible | |
Blockage | 3 | > once per month | Likely | |
Screen mats | 7 | > once per month | Likely | |
Others | 6 | > once per month | Likely | |
If the company’s generic (industry-aligned) consequence matrix is applied, a ‘high’ consequence rating is appropriate to this failure mode given it has amassed a total of 312 hours of downtime per event. as highlighted in Fig. 2, the top three critical failure modes based on their likelihood are ‘Mechanical fault’, ‘Maintenance activities’ and ‘bogged conveyor’.
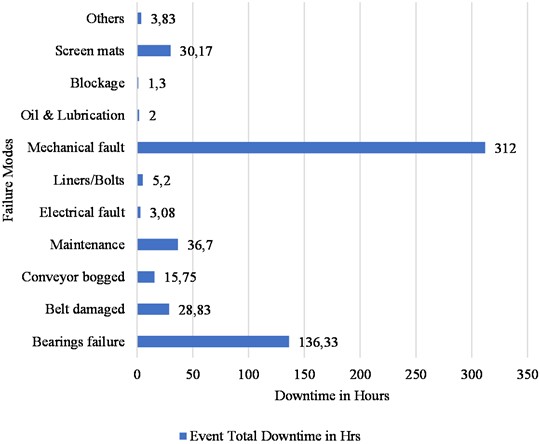
If a decision-maker had to rely on just the likelihood score, then the most frequently occurring failure mode will be attended first. in this case the ‘Mechanical fault’ followed by the other in sequential order. But if a different person tries to analyse the same failure modes through the lens of ‘downtime’ alone, the priority changes. as seen in the Fig. 3, the topmost critical failure modes coincidently reoccur, but this time they are reordered, “mechanical fault”, “bearing failure” and then “maintenance activities”. Thus, both the parameters yield different priorities thus creating uncertainties in the decision-making process.
Fig. 2Analysis of failure rate (likelihood)
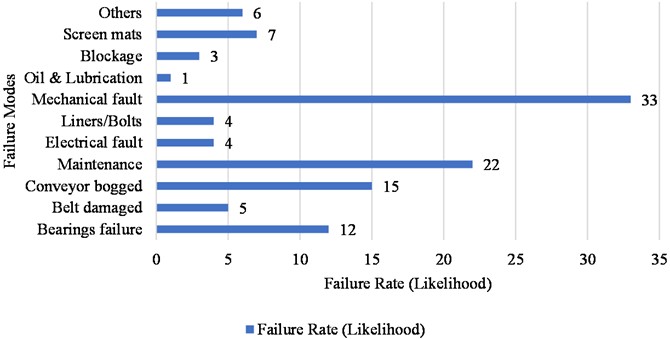
Table 13Analysis of downtime
Equipment | Failure modes | Event total downtime in minutes | Event total downtime in Hrs |
Screen | Bearings failure | 8180 | 136.33 |
Belt damaged | 1730 | 28.83 | |
Conveyor bogged | 945 | 15.75 | |
Maintenance | 2202 | 36.70 | |
Electrical fault | 185 | 3.08 | |
Liners/Bolts | 312 | 5.20 | |
Mechanical fault | 18720 | 312.00 | |
Oil & Lubrication | 120 | 2.00 | |
Blockage | 78 | 1.30 | |
Screen mats | 1810 | 30.17 | |
Others | 230 | 3.83 |
Fig. 3Analysis of failure modes of an identified critical equipment
After this individual analysis of this parameters, Table 14 showcases their role in the novel quantitative approach proposed in this paper.
This approach reveals why it is important to consider both ‘failure rate’ and ‘downtime’ to highlight the likelihood and consequences of the risk associated with an event caused by each particular failure mode. It is important to understand that we are analysing historical data, and we are analysing risk per event as we do not want another event to occur. Risk is an event-based measure, and a quality decision-making process must therefore assess the risk associated with each unique event-type.
The higher the frequency of failure in a particular period of time then it is more likely that event is to occur again. The risk matrix (Likelihood x Consequence) presented in this framework indicates the risk per event. The downtime parameter is important, but it doesn’t belong in likelihood space. Only the failure rate belongs in the likelihood space because its matrix describes classifies the time period between failure events due to a specific failure mode. Similarly, the downtime is important when we are discussing consequence. The consequence is described by the cost parameter because the cost is inherently related to the production downtime per event, contributed by the same failure mode.
Table 14Analysis of multi-stage quantitative FMECA (A novel approach) process results of critical equipment “Screen”
Equipment | Failure modes | Quantitative analysis | ||||||||
Failure rate (likelihood) | Event total downtime in minutes | Event total downtime in Hrs | Total loss/event (consequence) | Risk score | ||||||
Screen | Bearings failure | 12 | > once per week | Almost Certain | 8180 | 136.33 | $204,500.00 | $200K - $2000K | Moderate | E20 |
Belt damaged | 5 | > once per week | Almost Certain | 1730 | 28.83 | $103,800.00 | $20K - $200K | Minor | H16 | |
Conveyor bogged | 15 | > once per week | Almost Certain | 945 | 15.75 | $18,900.00 | <$20K | Insignificant | H11 | |
Maintenance | 22 | > once per week | Almost Certain | 2202 | 36.70 | $30,027.27 | $20K - $200K | Minor | H16 | |
Electrical fault | 4 | > once per month | Likely | 185 | 3.08 | $13,875.00 | <$20K | Insignificant | M7 | |
Liners/Bolts | 4 | > once per month | Likely | 312 | 5.20 | $23,400.00 | $20K - $200K | Minor | H12 | |
Mechanical fault | 33 | > once per week | Almost Certain | 18720 | 312.00 | $170,181.82 | $20K - $200K | Minor | H16 | |
Oil & Lubrication | 1 | > once per year | Possible | 120 | 2.00 | $36,000.00 | $20K - $200K | Minor | M8 | |
Blockage | 3 | > once per month | Likely | 78 | 1.30 | $7,800.00 | <$20K | Insignificant | M7 | |
Screen mats | 7 | > once per month | Likely | 1810 | 30.17 | $77,571.43 | $20K - $200K | Minor | H12 | |
Others | 6 | > once per month | Likely | 230 | 3.83 | $11,500.00 | <$20K | Insignificant | M7 | |
This framework generates a risk score which is basically dependent on the total loss per event (Consequence). The total loss is basically the downtime in hours due to each occurred event which is then multiplied by the production loss cost per hour. Thus, by using Table 5, 6 and 7 we can evaluate the risk per failure mode, per event. The risk score of the ‘Bearing failure’ event is ‘E20’ which is a high priority considering the consequence of that failure mode. By comparing it with the individual parameter analysis; with respect to failure rate displayed in Table 12, a ‘Bearing failure’ was not even in the top three in the priority list, but with respect to downtime it would have been addressed, but not as a high priority. This shows how much the cost parameter makes difference in the perspective of decision-makers, as it results in the development of more robust maintenance strategies and utilises funds in a more efficient and effective way.
The findings of this research contribute meaningfully to both theoretical development and practical decision-making in the context of maintenance management within the mining industry. The proposed multi-stage risk assessment approach based on quantitative FMECA framework introduces a novel way to assess failure criticality by incorporating failure rate, downtime, and cost into a dynamic and repeatable analysis process. This approach moves beyond the limitations of traditional RPN-based methods, which often rely on static, subjective evaluations, and instead supports a continuous reassessment of risk as operational conditions evolve. From a theoretical perspective, this research enhances the existing body of work on reliability-centered maintenance by integrating data-driven, multi-criteria decision-making into the FMECA process. The inclusion of time-sensitive and cost-related parameters makes the framework especially relevant to industries like mining, where equipment downtime directly impacts productivity and revenue. On the managerial side, the framework provides maintenance planners and operations managers with a transparent and systematic tool to prioritise interventions based on measurable outcomes. By linking technical degradation with economic impact, it facilitates more accurate forecasting, targeted resource allocation, and improved maintenance planning. This alignment between technical risk and financial consequence also enables better justification of maintenance strategies to senior management, reinforcing accountability and supporting long-term asset performance optimisation.
6. Conclusions
The aim of every industry is to reduce the risk associated with their assets operation. the risk generally increases with the ageing of the assets and every industry has a different approach towards assessing this risk. Assessing risk is a crucial phase of the maintenance decision-making process and it is very important to complete this process as consistently as possible. There are different qualitative and quantitative risk assessment techniques adopted throughout industry to help reduce uncertainty. Each of these techniques are often universally applied to equipment and systems; regardless of criticality. Every technique has some level of uncertainty or limitation. for example, different likelihood and consequence factors may be relevant to different organisations, or, different organisations may record events differently or inadequately, which may influence the risk assessment approach that can be applied. Without question, it can be stated that a lack of quality data increases the challenges of the risk assessment process.
Risk assessment is a very time consuming, and a costly process and every industry adopts, to some extent, a fixed annual budget for asset maintenance and improvement activities. in such scenarios, industries go for the most affordable and quick options to arrive at a decision, which is not always a recommended approach. This is a widespread problem that is a result of pace of development, production targets and ever-changing market demands. in this style of workplace, it is very important to equip the decision-making process or the decision-maker with multiple decision parameters which can be selected based on data that is readily available throughout industry at a relatively high quality (i.e. availability, downtime and budget figures).
The aim of this paper was to design a framework based on multiple quantitative parameters. in this paper, a novel quantitative risk assessment approach has been introduced. This approach is based on quantitative FMECA. The entire framework is designed with different decision-making parameters, represented as a standalone individual decision-making practice. This gives flexibility to the decision-making committee to plan the maintenance activities in accordance with time and budget availability. The novel risk assessment approach considers assessing, analysing and prioritising the failure modes using a multi-stage, quantitative approach. Whilst it is important to note that all three approaches yield results that will reduce overall risk, the cost and timeframe needed to do so will vary dramatically. Ultimately, the management team can select an option that better suits their needs and maturity. However, this paper has determined that a quantitative influence is required to streamline decision-making processes and reduce outcome subjectivity.
By breaking down risk assessment into distinct stages, this methodology addresses key limitations of traditional FMEA/FMECA. The inclusion of failure rate in the first stage helps to quantify the likelihood of failures occurring. The second stage, which assesses downtime, allows for a more comprehensive understanding of how failures impact system availability and overall productivity. Finally, integrating cost analysis in the third stage provides financial justification for prioritizing maintenance and reliability improvements. This multi-dimensional approach ensures a balanced decision-making process that aligns with both technical performance and economic feasibility. Furthermore, applying multi-stage quantitative FMECA in industries such as mining, manufacturing, and aerospace can significantly reduce unplanned downtime, optimize maintenance planning, and enhance system reliability. As industries continue to adopt data analytics and predictive maintenance, this approach can be further refined by integrating machine learning algorithms and real-time monitoring to improve risk prediction accuracy.
In conclusion, the multi-stage quantitative FMECA methodology presented in this paper represents a critical advancement in reliability engineering and risk management. By systematically analysing failure rate, downtime, and cost, organizations can enhance safety, improve asset performance, and reduce operational losses, leading to more efficient and sustainable industrial operations. It also shows how important it is to filter the failure modes through an economic lens along with other quantitative risk assessment parameters which yield results in a more effective and efficient way.
References
-
J. E. Amadi-Echendu et al., Engineering Asset Management Review. London: Springer London, 2010, pp. 3–16, https://doi.org/10.1007/978-1-84996-178-3_1
-
“55000 Asset management-Overview, principles and terminology,” ISO: Geneva, Switzerland, 2014.
-
S. More, R. Tuladhar, D. Grainger, and W. Milne, “Maintenance decision-making and its relevance in engineering asset management,” Maintenance, Reliability and Condition Monitoring, Vol. 4, No. 1, pp. 1–17, Jun. 2024, https://doi.org/10.21595/marc.2024.23687
-
D. Valis and M. Koucky, “Selected overview of risk assessment techniques,” Problemy Eksploatacji, No. 4, pp. 19–32, 2009.
-
G. Gavrilovs and S. Vitolina, “Identification of power transformer’s failure and risk source,” in Proceedings of the 52nd Annual International Scientific Conference of Riga Technical University, 2011.
-
M. Modarres, Risk Analysis in Engineering. CRC Press, 2016, https://doi.org/10.1201/b21429
-
M. H. Faber and M. G. Stewart, “Risk assessment for civil engineering facilities: critical overview and discussion,” Reliability Engineering and System Safety, Vol. 80, No. 2, pp. 173–184, May 2003, https://doi.org/10.1016/s0951-8320(03)00027-9
-
P. Kumar and A. Kumar, “Methods for risk management of mining excavator through FMEA and FMECA,” the International Journal of Engineering and Science (IJES), Vol. 5, No. 6, pp. 57–63, 2016.
-
K. Sharma and S. Srivastava, “Failure mode and effect analysis (FMEA) implementation: a literature review,” Journal of Advance Research in Aeronautics and Space Science, Apr. 2018.
-
M. A. Bennett, R. Mcdermott, and M. Beauregard, the Basics of FMEA. Productivity Press, 2017, https://doi.org/10.1201/b16656
-
H.-W. Lo, J. J. H. Liou, C.-N. Huang, and Y.-C. Chuang, “A novel failure mode and effect analysis model for machine tool risk analysis,” Reliability Engineering and System Safety, Vol. 183, pp. 173–183, Mar. 2019, https://doi.org/10.1016/j.ress.2018.11.018
-
X. Su, Y. Deng, S. Mahadevan, and Q. Bao, “An improved method for risk evaluation in failure modes and effects analysis of aircraft engine rotor blades,” Engineering Failure Analysis, Vol. 26, pp. 164–174, Dec. 2012, https://doi.org/10.1016/j.engfailanal.2012.07.009
-
M. Baghery, S. Yousefi, and M. J. Rezaee, “Risk measurement and prioritization of auto parts manufacturing processes based on process failure analysis, interval data envelopment analysis and grey relational analysis,” Journal of Intelligent Manufacturing, Vol. 29, No. 8, pp. 1803–1825, Apr. 2016, https://doi.org/10.1007/s10845-016-1214-1
-
G. Sakthivel and B. W. Ikua, “Failure mode and effect analysis using fuzzy analytic hierarchy process and GRA TOPSIS in manufacturing industry,” International Journal of Productivity and Quality Management, Vol. 22, No. 4, p. 466, Jan. 2017, https://doi.org/10.1504/ijpqm.2017.087864
-
Z. Wang, J.-M. Gao, R.-X. Wang, K. Chen, Z.-Y. Gao, and Y. Jiang, “Failure mode and effects analysis using Dempster-Shafer theory and TOPSIS method: Application to the gas insulated metal enclosed transmission line (GIL),” Applied Soft Computing, Vol. 70, pp. 633–647, Sep. 2018, https://doi.org/10.1016/j.asoc.2018.06.015
-
J. Ahn, Y. Noh, S. H. Park, B. I. Choi, and D. Chang, “Fuzzy-based failure mode and effect analysis (FMEA) of a hybrid molten carbonate fuel cell (MCFC) and gas turbine system for marine propulsion,” Journal of Power Sources, Vol. 364, pp. 226–233, Oct. 2017, https://doi.org/10.1016/j.jpowsour.2017.08.028
-
H.-C. Liu, X.-Y. You, F. Tsung, and P. Ji, “An improved approach for failure mode and effect analysis involving large group of experts: an application to the healthcare field,” Quality Engineering, Vol. 30, No. 4, pp. 762–775, Oct. 2018, https://doi.org/10.1080/08982112.2018.1448089
-
L. Wang, Y.P. Hu, H.C. Liu, and H. Shi, “A linguistic risk prioritization approach for failure mode and effects analysis: a case study of medical product development,” Quality and Reliability Engineering International, Vol. 35, No. 6, pp. 1735–1752, Mar. 2019, https://doi.org/10.1002/qre.2472
-
N. G. Mutlu and S. Altuntas, “Hazard and risk analysis for ring spinning yarn production process by integrated FTA-FMEA approach,” Tekstil ve Konfeksiyon, Vol. 29, No. 3, pp. 208–218, Sep. 2019, https://doi.org/10.32710/tekstilvekonfeksiyon.482167
-
N. G. Mutlu and S. Altuntas, “Risk analysis for occupational safety and health in the textile industry: Integration of FMEA, FTA, and BIFPET methods,” International Journal of Industrial Ergonomics, Vol. 72, pp. 222–240, Jul. 2019, https://doi.org/10.1016/j.ergon.2019.05.013
-
F. Franceschini and M. Galetto, “A new approach for evaluation of risk priorities of failure modes in FMEA,” International Journal of Production Research, Vol. 39, No. 13, pp. 2991–3002, Jan. 2001, https://doi.org/10.1080/00207540110056162
-
D. C. Dunkle, “Prioritizing human interface design issues for range safety systems using human factors process FMEA,” in NASA Risk Management Conference, 2005.
-
D. Smith, “FMEA: Preventing a failure before any harm is done,” Isixsigma Magazine, Nov. 2008.
-
A. Duda and T. Juzek, “Use of the method FMEA for hazard identification and risk assessment in a coal mine,” Management Systems in Production Engineering, Vol. 31, No. 3, pp. 332–342, Sep. 2023, https://doi.org/10.2478/mspe-2023-0037
-
S. Shariati, “Underground mine risk assessment by using FMEA in the presence of uncertainty,” Decision Science Letters, Vol. 3, No. 3, pp. 295–304, Jan. 2014, https://doi.org/10.5267/j.dsl.2014.4.002
-
P. Fithri, A. Hasan, Wisnel, and R. Sultan Fauzi Kesogihan, “A case study on risk analysis of machine breakdown using the FMEA method,” in E3S Web of Conferences, Vol. 604, p. 12001, Jan. 2025, https://doi.org/10.1051/e3sconf/202560412001
-
L. S. Lipol and J. Haq, “Risk analysis method: FMEA/FMECA in the organizations,” International Journal of Basic and Applied Sciences, Vol. 11, No. 5, pp. 74–82, 2011.
-
S. El Medkouri, N. Bhirich, M. J. Belahcen, and Y. Rahali, “Retrospective and FMECA analysis of failures in closed-system devices,” Journal of Oncology Pharmacy Practice, Vol. 31, No. 1, pp. 39–48, Dec. 2023, https://doi.org/10.1177/10781552231221229
-
S. El Baraka et al., “Optimizing chemotherapy medication leftover management circuit in a centralized chemotherapy preparation unit: a comprehensive FMECA risk analysis and continuous improvement approach,” Journal of Oncology Pharmacy Practice, Vol. 31, No. 1, pp. 49–57, Dec. 2023, https://doi.org/10.1177/10781552231221450
-
R. A. Mentaram and M. L. Singgih, “Improving boiler performance with failure mode effect and criticality analysis (FMECA),” 14th International Seminar on Industrial Engineering and Management, Vol. 13, pp. 3–9, Jan. 2025, https://doi.org/10.4028/p-ahgzb3
-
B. Yeter, F. Brennan, and J. Harris, “System FMECA of floating offshore structures for green hydrogen production and storage,” in Innovations in Renewable Energies Offshore, CRC Press, 2025, pp. 923–932.
-
H. Tian et al., “A novel FMECA method for CNC machine tools based on D-GRA and data envelopment analysis,” Scientific Reports, Vol. 14, No. 1, p. 26596, Nov. 2024, https://doi.org/10.1038/s41598-024-77920-7
-
M. H. El Mansouri, H. Sekkat, M. Talbi, Z. Tahiri, and O. Nhila, “FMECA process analysis for managing the failures of 16-slice CT scanner,” Journal of Failure Analysis and Prevention, Vol. 24, No. 1, pp. 436–442, Jan. 2024, https://doi.org/10.1007/s11668-023-01853-y
-
Y. Degu and S. Moorthy, “Implementation of machinery failure mode and effect analysis in Amhara pipe factory,” American Journal of Engineering Research (AJER), Vol. 3, pp. 57–63, Jan. 2014.
-
M. P. Kumar, N. V. S. Raju, M. V. S. Kumar, and G. Gupta, “Risk assessment and prioritization using fuzzy FMECA: a case study of dumper breakdowns,” International Journal of System Assurance Engineering and Management, pp. 1–15, Sep. 2024, https://doi.org/10.1007/s13198-024-02506-5
-
Q. Zhou, H. Li, X. Zeng, L. Li, S. Cui, and Z. Du, “A quantitative safety assessment for offshore equipment evaluation using fuzzy FMECA: a case study of the hydraulic submersible pump system,” Ocean Engineering, Vol. 293, p. 116611, Feb. 2024, https://doi.org/10.1016/j.oceaneng.2023.116611
-
M. Catelani, L. Ciani, D. Galar, G. Guidi, S. Matucci, and G. Patrizi, “FMECA assessment for railway safety-critical systems investigating a new risk threshold method,” IEEE Access, Vol. 9, pp. 86243–86253, Jan. 2021, https://doi.org/10.1109/access.2021.3088948
-
Z. Wang, R. Wang, W. Deng, and Y. Zhao, “An integrated approach-based FMECA for risk assessment: application to Offshore wind turbine pitch system,” Energies, Vol. 15, No. 5, p. 1858, Mar. 2022, https://doi.org/10.3390/en15051858
-
A. M. S. Nascimento, G. P. Garbi, M. A. F. Dos Santos, and M. J. M. de Carvalho, “Functional cause analysis (FCA) adaptation of FMEA and FTA: a Case Study of a Cubesat,” International Journal of Advances in Engineering and Technology, Vol. 17, No. 3, pp. 277–288, Jun. 2024, https://doi.org/10.5281/zenodo.12771024
-
G. Sudipto et al., “Digital twin-driven process and equipment FMECA generation for smart manufacturing applications,” in Annual Conference of the PHM Society, Vol. 13, No. 1, Nov. 2021, https://doi.org/10.36001/phmconf.2021.v13i1.3085
-
D. Ćatić, J. Glisovic, J. Miković-Blagojević, and S. Gajević, “Analysis of failure causes and the criticality degree of elements of motor vehicle’s drum brakes,” Tribology in Industry, Vol. 316, pp. 316–325, Sep. 2014.
-
X. Cheng, Z. Xing, Y. Qin, Y. Zhang, S. Pang, and J. Xia, “Reliability analysis of metro door system based on FMECA,” Journal of Intelligent Learning Systems and Applications, Vol. 5, No. 4, pp. 216–220, Jan. 2013, https://doi.org/10.4236/jilsa.2013.54024
-
D. Ćatić, B. Jeremić, Z. Djordjević, and N. Miloradović, “Criticality analysis of the elements of the light commercial vehicle steering tie-rod joint,” Strojniški vestnik – Journal of Mechanical Engineering, Vol. 57, No. 6, pp. 495–502, Jun. 2011, https://doi.org/10.5545/sv-jme.2010.077
-
M. P. Kumar, N. Raju, and M. S. Kumar, “Criticality analysis of dumper components in open cast mining using FMECA,” International Journal of Mechanical and Production Engineering Research and Development (IJMPERD), Vol. 10, No. 3, pp. 298–305, 2020.
-
S. Rika, E. Hristovska, Z. Sovreski, and S. Stavreva, “FMECA analysis of random mechanical failures of a coal system in a surface mine,” International Transaction Journal of Engineering, Management, and Applied Sciences and Technologies, Vol. 15, No. 1, pp. 1–12, 2024.
-
M. Dworzak, “Occupational risk management method for quarry blasting operations based on modified FMECA algorithm,” Inżynieria Mineralna, Vol. 1, No. 1, Aug. 2023, https://doi.org/10.29227/im-2023-01-30
-
A. Daya and L. Joel, “Maintenance plan improvement using failure mode effect and criticality analysis: a case study on mining equipment,” Engineering Science and Technology Journal, Vol. 6, No. 3, pp. 86–103, Apr. 2025, https://doi.org/10.51594/estj.v6i3.1879
-
M. Chennoufi and A. Chakhrit, “An extended FMECA approach using new risk assessment and prioritization based approach,” International Journal of Information Technology, Vol. 16, No. 3, pp. 1595–1604, Sep. 2023, https://doi.org/10.1007/s41870-023-01455-9
-
N. H. Elkasrawy, H. A. Farouk, and Y. M. Youssef, “Maintenance optimization based on modified FMECA: a case study applied to a spinning factory,” International Journal of System Assurance Engineering and Management, Vol. 16, No. 1, pp. 73–88, Nov. 2024, https://doi.org/10.1007/s13198-024-02617-z
-
Z. Zhu, Y. Xiang, and B. Zeng, “Multicomponent maintenance optimization: a stochastic programming approach,” INFORMS Journal on Computing, Vol. 33, No. 3, pp. 898–914, Jul. 2021, https://doi.org/10.1287/ijoc.2020.0997
-
Z. Zhu and Y. Xiang, “Condition-based maintenance for multi-component systems: modeling, structural properties, and algorithms,” IISE Transactions, Vol. 53, No. 1, pp. 88–100, Jan. 2021, https://doi.org/10.1080/24725854.2020.1741740
-
Z. Wu, W. Liu, and W. Nie, “Literature review and prospect of the development and application of FMEA in manufacturing industry,” the International Journal of Advanced Manufacturing Technology, Vol. 112, No. 5-6, pp. 1409–1436, Jan. 2021, https://doi.org/10.1007/s00170-020-06425-0
-
“Failure mode and effects analysis-FMEA handbook: design FMEA, process FMEA, supplemental FMEA for monitoring et system response,” Automotive Industry Action Group, Southfield, MI, 2019.
About this article

This study is supported by the engineering department of James Cook University, Australia and Rockfield Technologies Pty Ltd, Australia.
The datasets generated during and/or analyzed during the current study are available from the corresponding author on reasonable request.
Sagar More: writing-original draft preparation, conceptualization, methodology. William Milne: writing-review and editing, conceptualization, methodology. Rabin Tuladhar: writing-review and editing
The authors declare that they have no conflict of interest.
