Abstract
In the inkjet printing process, controlling the droplet size is essential to ensure uniform thin film, a critical factor for achieving high performance of electronic devices. In this study, we evaluate the accuracy and applicability of three droplet measurement methods using inks with different properties. The first method is the laser diffraction method, which measures individual droplets based on the Fraunhofer diffraction in real time. The second is the mass measurement method, which calculates the droplet mass using a microbalance and employs evaporation compensation to minimize evaporation effects, and the third method is the shadow imaging method, a widely adopted commercial technique based on the international standard. To evaluate the accuracy of these measurement methods with three inks having various boiling points (BP), laser diffraction serves as a benchmark here to compare the results of the shadow image and mass measurement methods. Laser diffraction was selected because it shows better coefficient of variation about 1.7 % than the coefficient of variation of mass measurement and shadow imaging methods about 8.7 % and 6.4 %, respectively. The BP of the ink and measurement precision based on laser diffraction results were proportional to each other. These insights guide the selection of optimal measurement method for inkjet printing applications with printed electronic inks. When printed electronic inks with various boiling points were used, the laser diffraction method consistently demonstrated better measurement errors in droplet size than the mass measurement and the shadow imaging method.
Highlights
- A comparative study evaluated three droplet sizing methods laser diffraction, mass measurement, and shadow imaging in inkjet printing.
- Laser diffraction demonstrated the highest accuracy with the lowest coefficient of variation (~1.7%) across inks with various boiling points.
- Measurement consistency across all three methods improved significantly with increasing ink boiling point.
- Mass and shadow imaging methods showed higher errors and evaporation sensitivity, especially for low-boiling-point inks.
- The findings guide optimal droplet measurement selection for printed electronics, OLED patterning, and biomedical applications.
1. Introduction
As inkjet technology continues to evolve, its applicability to the fabrication of display panels and semiconductor devices continues to increase [1]. Inkjet printing technology, which involves the controlled, non-contact transfer of liquid materials from the printhead nozzle to the substrate, exhibits exceptional flexibility in terms of substrate compatibility, including but not limited to flexible substrates [2, 3]. This technology significantly mitigates material usage limitations and is therefore established as a key tool for future technological innovations [4]. To comply with the increasing and diverging requirements for today’s inkjet technology, precision measurements of the inkjet droplet size are particularly important [5]. In the inkjet printing process, the size of the droplet determines the minimum feature size of the printed electronic device and the thickness of the functional film. To achieve better device performance, the stable jetting of droplets on the pico-liter scale is at present an important development trend in research on inkjet printing technology [6, 7]. The real-time detection of the droplet size is a crucial method for assessing inkjet printer performance capabilities. Currently, most standardized techniques for measuring inkjet droplets require that the droplet formation process be completed, with the formation of stable spherical droplets, before the droplet speeds, with the droplet volume able to be determined using in-flight imaging methods [8-10]. If the volume variation of an inkjet droplet is determined to be less than 3 %, the diameter variation of the droplet image must be less than 1 %. According to this standard, the error range is determined by the resolution and measurement performance of the equipment. A larger variation range can lead to poor performance of the produced devices (in, for example, OLED display manufacturing) [11].
To achieve real-time droplet measurements during the inkjet process, Shin et al. proposed a real-time measurement method that relied on laser diffraction to measure the size and drop speed of inkjet droplets [12, 13]. They confirmed the feasibility of their method with droplet sizes ranging from several micrometers to tens of micrometers. The Optical measurement method based on the scattering of light by spherical particles are described by the rigorous Mie theory [14, 15]. Interestingly, small angles scattered by large particles (compared to the wavelength) do not depend on particle substance and can be described as a diffraction that is sensitive to particle size only. This effect, discussed in the early book by Shifrin [16], was used by Shifrin to suggest a widely used method for determining the size of single spherical particles. This method, also known as the Chin–Shifrin inversion algorithm [17], has been employed to solve diverse problems, for example, for sizing alumina particles in the combustion products of solid-propellant rocket engines [18] and water droplets generated by atomizing superheated water [19]. Building on this theoretical framework, Shin et al. employed an approximated Fraunhofer diffraction model to estimate droplet volume from the diffraction patterns generated as inkjet droplets pass through a laser beam. This technique enables real-time, droplet-by-droplet volume measurement during printing, with software implemented in C/C++ used to capture diffraction images and calculate the corresponding droplet volumes on the fly.
Kwon et al. developed the mass measurement method to address the limitations of the shadow imaging method [20]. This method involves weighing a specified number of accumulated droplets and calculating their volume based on the measured weight [21]. During the droplet jetting point, convective evaporation occurs, followed by additional evaporation after the droplet settles [22, 23]. They examined the significant impacts of the jetting frequency and evaporation on the measurement accuracy, also considering the evaporation slope after the droplet's descent to improve the precision of the results. However, their method does not allow for real-time measurements of the droplet size during jetting.
A vision-based shadow imaging method has been extensively used to measure the droplet volume. This method, which measures the droplet volume by directly imaging the droplet's shadow, has been internationally standardized as an IEC standard (62899-302-2) [24, 25]. It involves visualizing the droplet using a charge-coupled (CCD) camera synchronized with a high-frequency strobe light. The advantage of this method is that it allows for an intuitive observation of the droplet's trajectory and formation quality [26]. However, given that the analysis and calculation are based on captured images, the method relies heavily on the resolution of the equipment. High-resolution camera devices, which are necessary to minimize error margins, often come with high costs. Various image-related errors can lead to low accuracy. For example, the lighting conditions and lens focus can affect the measurement of the droplet size [27]. Additionally, the measurement results can vary with the threshold setting, which is crucial for detecting the droplet’s edge position.
Currently, these three methods are the mainstream approaches for measuring the size of an inkjet droplet. Table 1 summarizes the principles behind each measurement technique as well as their characteristics. Although various measurement techniques have been proposed, no prior study has systematically compared these methods using inks with different boiling points.
Table 1Principles and characteristics of the three methods
Methods | Laser diffraction | Mass measurement | Shadow imaging |
Basics | Optics-based | Weight-based | Vision-based |
Analysis method | Optical diffraction calculation | Mass-volume conversion | Pixel count-volume conversion |
Currently, the laser diffraction method, the mass measurement method, and the shadow imaging method are used to measure the sizes of inkjet droplets. Each measurement method has own unique strengths and limitations. However, their performance outcomes can vary depending on the properties of the ink, the droplet size, and the specific measurement conditions, necessitating a comprehensive evaluation of their accuracy and applicability.
While these techniques have been individually studied in previous works, there remains a notable lack of comparative studies that systematically evaluate their performance using real printed electronic inks with various boiling points. This gap is particularly relevant for practical printed electronics applications, as ink volatility can significantly influence measurement accuracy.
In this study, we systematically analyzed the effect of the boiling point properties of various printable inks on the coefficient of variation and accuracy of inkjet droplet volume measurements by the laser diffraction method, the mass measurement method, and the shadow image method.
2. Experiment
2.1. Laser diffraction method
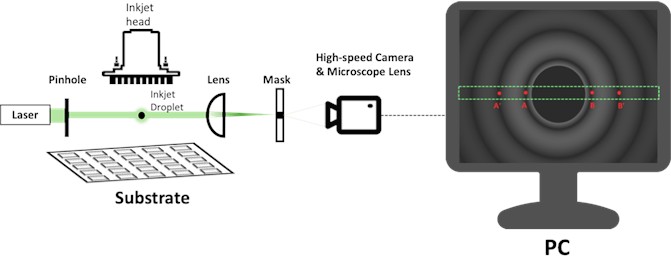
The laser diffraction method is based on the principle of optical diffraction to measure the droplet volume. When a laser with wavelength is directed at a spherical droplet with diameter , and the distance between the droplet and the screen is sufficiently large (), Fraunhofer diffraction occurs. As shown in Fig. 1, the experimental system consists of a 4.5 mW diode laser with a wavelength of 532 nm (Thorlabs, Inc., CPS532). The diameter of the laser beam was 3.5 mm. To measure the sizes of individual droplets during continuous jetting, a pinhole (Thorlabs, Inc., P1000K) with a diameter of 1000 µm was added behind the laser diode to adjust the laser beam size, thereby altering the measuring zone. A lens with a focal length of 50 mm was used, and the high-speed camera (Kaya Instrument, Inc., Jetcam 19) has a sensor size of 19.2×10.8 mm2, 1920 pixels × 1080 pixels, and a 10 µm pixel pitch. A microscope lens with a focal length of 95 mm was added to the camera. Because the central part of the diffracted light was extremely bright, it could affect the brightness around the center of the camera sensor. To prevent distortion of the diffraction image, a mask with the diameter of 3 mm was used to block the light in the center.
Based on this experimental setup, we could obtain diffraction images of droplets using the high-speed camera. Because the center of the diffraction pattern is blocked by the mask, we use the left side of the first secondary minimum, , and the right side of the first secondary minimum, , on the diffraction pattern to calculate the actual distance. The actual radius, , between these two positions is related to the pixel pitch of the high-speed camera and is expressed as follows:
Finally, we calculate the droplet diameter, , based on the actual radius using the following equation:
where 1.22 is a constant derived from the first kind of order 1 Bessel function () for circular aperture diffraction, is the distance associated with the pixel pitch, is the focal length of the lens, and is the magnification of the microscope lens. The measured diameter is then converted into the volume using the spherical volume formula.
Fig. 1Schematic representation of the laser diffraction method
2.2. Mass measurement method
The mass of the droplets is extremely small such that the measurement resolution of the microbalance is not sufficient to measure individual droplets. Therefore, with a jetting frequency of 1 kilohertz, we used a microbalance (CAS, CAUW-220D), which has sensitivity of 0.01 mg, to weigh one million jetted droplets. However, due to an uncertainty of ± 0.05 mg, we limited the precision of the measurement results to 0.1 mg in the experiment. A container was placed on the microbalance and tared to set zero. After halting the inkjet droplet jetting, the mass of the collected ink droplets was measured. The collected droplet mass can be used along with the jetting frequency and droplet density to calculate the droplet volume, as follows:
where is the mean volume of a single droplet, is the total mass of the accumulated droplets, is the number of droplets, and is the density of the ink. To account for the effect of evaporation, mass measurements during both the jetting and post-jetting periods should be carried out. Here, is the ending time of ink jetting. The collected data from the mass measurements can be fitted to a linear curve via a fitting method with respect to time, , using the equation below:
where, is the mass of the accumulated droplets, is the slope of the curve-fitted mass increase data during jetting, is time, and is the initial mass, which is set to 0. To consider the effect of evaporation, compensation must be considered. To include evaporation, the decreasing rate of mass was measured during the post-jetting period after jetting stopped. This is described by the following equation:
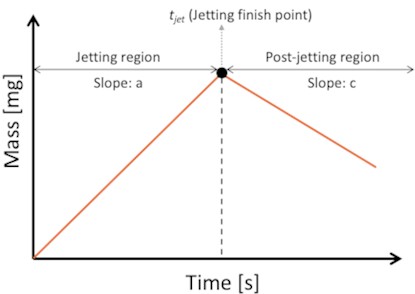
In this equation, is the evaporation mass of the accumulated droplets, is the slope of the curve-fitted mass data during post-jetting, considering evaporation, and is the initial mass at the time when jetting stopped to measure the effects of evaporation, and is the flow time. As shown in Fig. 2, the compensated average mass of the inkjet droplets jetted at jetting frequency can be calculated using the following equation:
The average mass of the inkjet droplet was determined by conducting three separate experiments. Each experiment involved continuous jetting of one million droplets. Given the jetting frequency, the time required to jet one million droplets was calculated to be 1000 seconds. Afterward, the jetting was stopped, and the mass of the droplets was recorded at 60-second intervals over a period of 1000 seconds under post-jetting conditions.
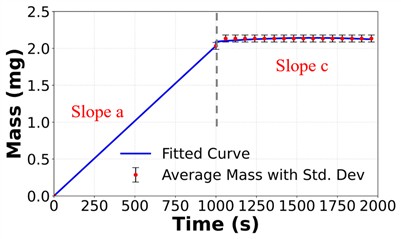
Fig. 2Relationship between the accumulated ink droplet mass and elapsed time, showing both the jetting and post-jetting phases
2.3. Shadow imaging method
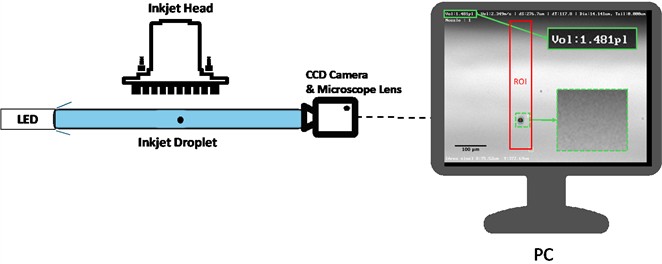
In this study, we employed an in-house inkjet printer and a drop-watcher system (shadow imaging system). In this experiment, a 2.4pL nozzle head (Dimatix, Samba Cartridge, USA) was used as the jetting device. The shadow imaging system utilizes a CCD camera (BASLER, acA640-90 gm, Japan) with a resolution of 659 pixels × 494 pixels and a sensor size of 4.9 mm × 3.7 mm to capture images of the inkjet droplets. A microscope lens with adjustable magnification is employed to capture magnified images of the droplets, as shown in Fig. 3. By synchronizing a LED light with the jetting trigger, images of the droplets in the region of interest (ROI) could be obtained. The software used (Marvel Engineering, South Korea) detects droplets within the specified ROI, separates them from the image background using an algorithm, and calculates the droplet volume by counting the number of pixels.
Fig. 3Schematic representation of the inkjet printer with a shadow-image-based drop watcher. The red box indicates the region of interest (ROI), while the green box highlights the volume results and the magnified portion of the droplet
2.4. Inks
To investigate the effects of different measurement methods, several inks with varying characteristics and boiling points were used in the test. These were an Ag nanoparticle ink (DGP 40LT-15C, ANP), composed primarily of triethylene glycol monoethyl ether (TGME) and the polar solvents ethyl alcohol and isopropyl alcohol (IPA); an OLED green ink for the emitting layer (EML), synthesized by mixing ethyl 4-methylbenzoate (EMB, 80 vol%) with 2-ethylhexylbenzoate (EHB, 20 vol%); and a red dye ink (XL0723R, Dimatix), which uses propylene carbonate as a high-boiling-point solvent. The characteristics of these inks are summarized in Table 2.
Table 2Characteristics and physical properties of the three types of ink
Ink (Main solvent) | Ag nanoparticle ink (TGME) | OLED green EML ink (EMB) | Red dye ink (Propylene carbonate) |
Boiling point of solvent [°C] | 122 | 183 | 240 |
Density of ink [g/cm3] | 1.50 | 0.98 | 1.12 |
Ink characteristics | Metal nanoparticle ink | Luminescent ink | Colorant ink |
3. Results
To prevent image distortion and magnification inaccuracies when capturing diffraction images with the camera, we introduced a correction factor into the original equation to enhance accuracy. The experiment utilized pinholes with dimensions closely matching those of inkjet droplets, and data were acquired using a laser diffraction system. The results highlight the discrepancies between the two measurement methods and provide the basis for calculating a correction factor to improve the accuracy.
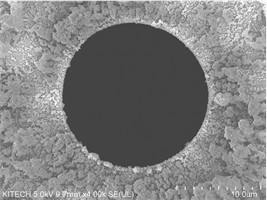
First, we applied the laser diffraction method to measure precision pinholes (Edmund, #56-278, USA) with diameters and dimensions closely comparable to those of inkjet droplets. The size of these pinholes was verified by scanning electron microscopy (SEM) (Hitachi, SU8010, Japan). The laser diffraction image and SEM measurement of the apertures are shown in Fig. 4. SEM measured the diameter of the pinhole as 17.325 µm, while the laser diffraction system measured it as 15.811 µm. Using the SEM measurement as a reference, we determined the measurement error of the laser diffraction system to be 8.74 %. Based on this error, a correction factor of 0.9126 was calculated. Incorporating this correction factor for laser diffraction, Eq. (2) was modified and rewritten as Eq. (7):
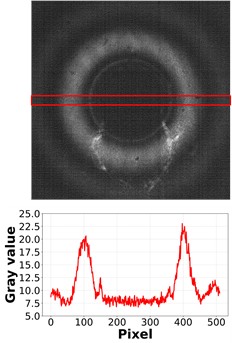
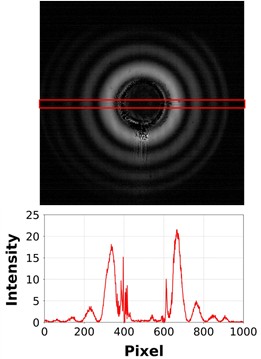
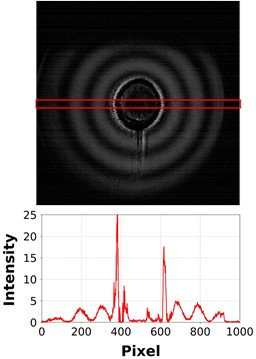
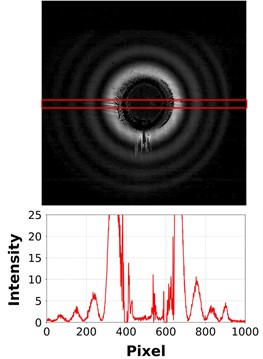
Using a laser diffraction system, the volumes of 200,000 consecutively jetted droplets were measured for each of the three inks. Fig. 5 shows the diffraction patterns captured by the camera as droplets of each ink passed through the laser beam, along with the corresponding grayscale intensity values at the image center as analyzed by the software. For the Ag nanoparticle ink, the average droplet volume with the correction factor applied was 1.54 pL, with coefficient of variation of 1.3 %; for the green EML ink, the average droplet volume with the correction factor applied was 1.17 pL, with coefficient of variation of 1.7 %; and in the case of the red dye ink, the average droplet volume with the correction factor applied was 1.75 pL, with coefficient of variation of 1.1 %.
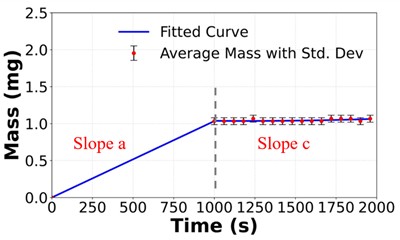
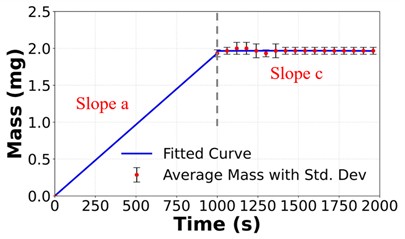
Fig. 6 presents the droplet mass measurement data from three measurements of each of the three inks, including the average mass curve with the standard deviation. For the Ag nanoparticle ink, curve fitting was applied to both the jetting and post-jetting regions, yielding a mean mass increase rate of 2.03 µg/s and a mean evaporation rate of 32.68 ng/s across the three experiments. The compensated mass was calculated and found to be 2.00 ng, and converting the mass to volume, the average droplet volume was determined to be 1.33 pL, with coefficient of variation of 3 %. Accounting for evaporation in the Ag nanoparticle ink resulted in a 0.03 pL reduction in the droplet volume compared to when evaporation was not considered. Regarding the green EML ink, the mass data during the post-jetting phase (from 1000 seconds to 2000 seconds) showed no observable decline; rather, it demonstrated slight fluctuations over time. Curve fitting yielded a mean mass increase rate of 1.03 µg/s and a mean evaporation rate of 25.9 ng/s across the three experiments. The compensated mass was calculated to be 1.01 ng, and the average droplet volume was calculated as 1.03 pL, with coefficient of variation of 8.7 %. Accounting for evaporation in the green EML ink resulted in a 0.02 pL reduction in the droplet volume compared to when evaporation was not considered. For the red dye ink, the mean mass increase rate was measured as 1.93 µg/s and the mean evaporation rate was determined to be 0 ng/s across the three experiments. The compensated mass was calculated to be 1.93 ng, and converting the mass to volume, the average droplet volume was calculated to be 1.73 pL with coefficient of variation of 6.4 %. As no evaporation effects were detected for the red dye ink, the droplet volume remained unchanged regardless of whether or not evaporation was considered.
Fig. 4Measured data of a 1.735 um diameter precision pinhole: a) FESEM image, and b) laser diffraction image (top) and diffraction intensity graph in the horizontal center line of the laser diffraction image (bottom)
a)
b)
Fig. 5Laser diffraction images (top) and diffraction intensity graphs (bottom) for droplets of a) Ag nanoparticle ink, b) green EML ink, and c) red dye ink
a)
b)
c)
Finally, a shadow imaging system was employed to capture the shadow images of the droplets for the three types of ink within the region of interest (ROI) during jetting. Due to camera frequency limitations, each captured image is a composite of 30 droplet images. In total, 667 images were captured, allowing for the calculation of the average droplet volumes of 20,020 droplets. The mean volume of the Ag nanoparticle ink droplets was 1.43 pL, with coefficient of variation of 4.9 %; the green EML ink droplets measured 1.14 pL with coefficient of variation of 5.3 %, and the red dye ink droplets had a volume of 1.72 pL with coefficient of variation of 6.4 %.
Fig. 6Average droplet mass depending on time with fitted curves and standard deviations for a) Ag nanoparticle ink with 2.03 µg/s in Slope a and 32.68 ng/s in Slope c, b) green EML ink with 1.03 µg/s in Slope a and 25.9 ng/s in Slope c, and c) red dye ink with 1.93 µg/s in Slope a and 0 ng/s in Slope c
a)
b)
c)
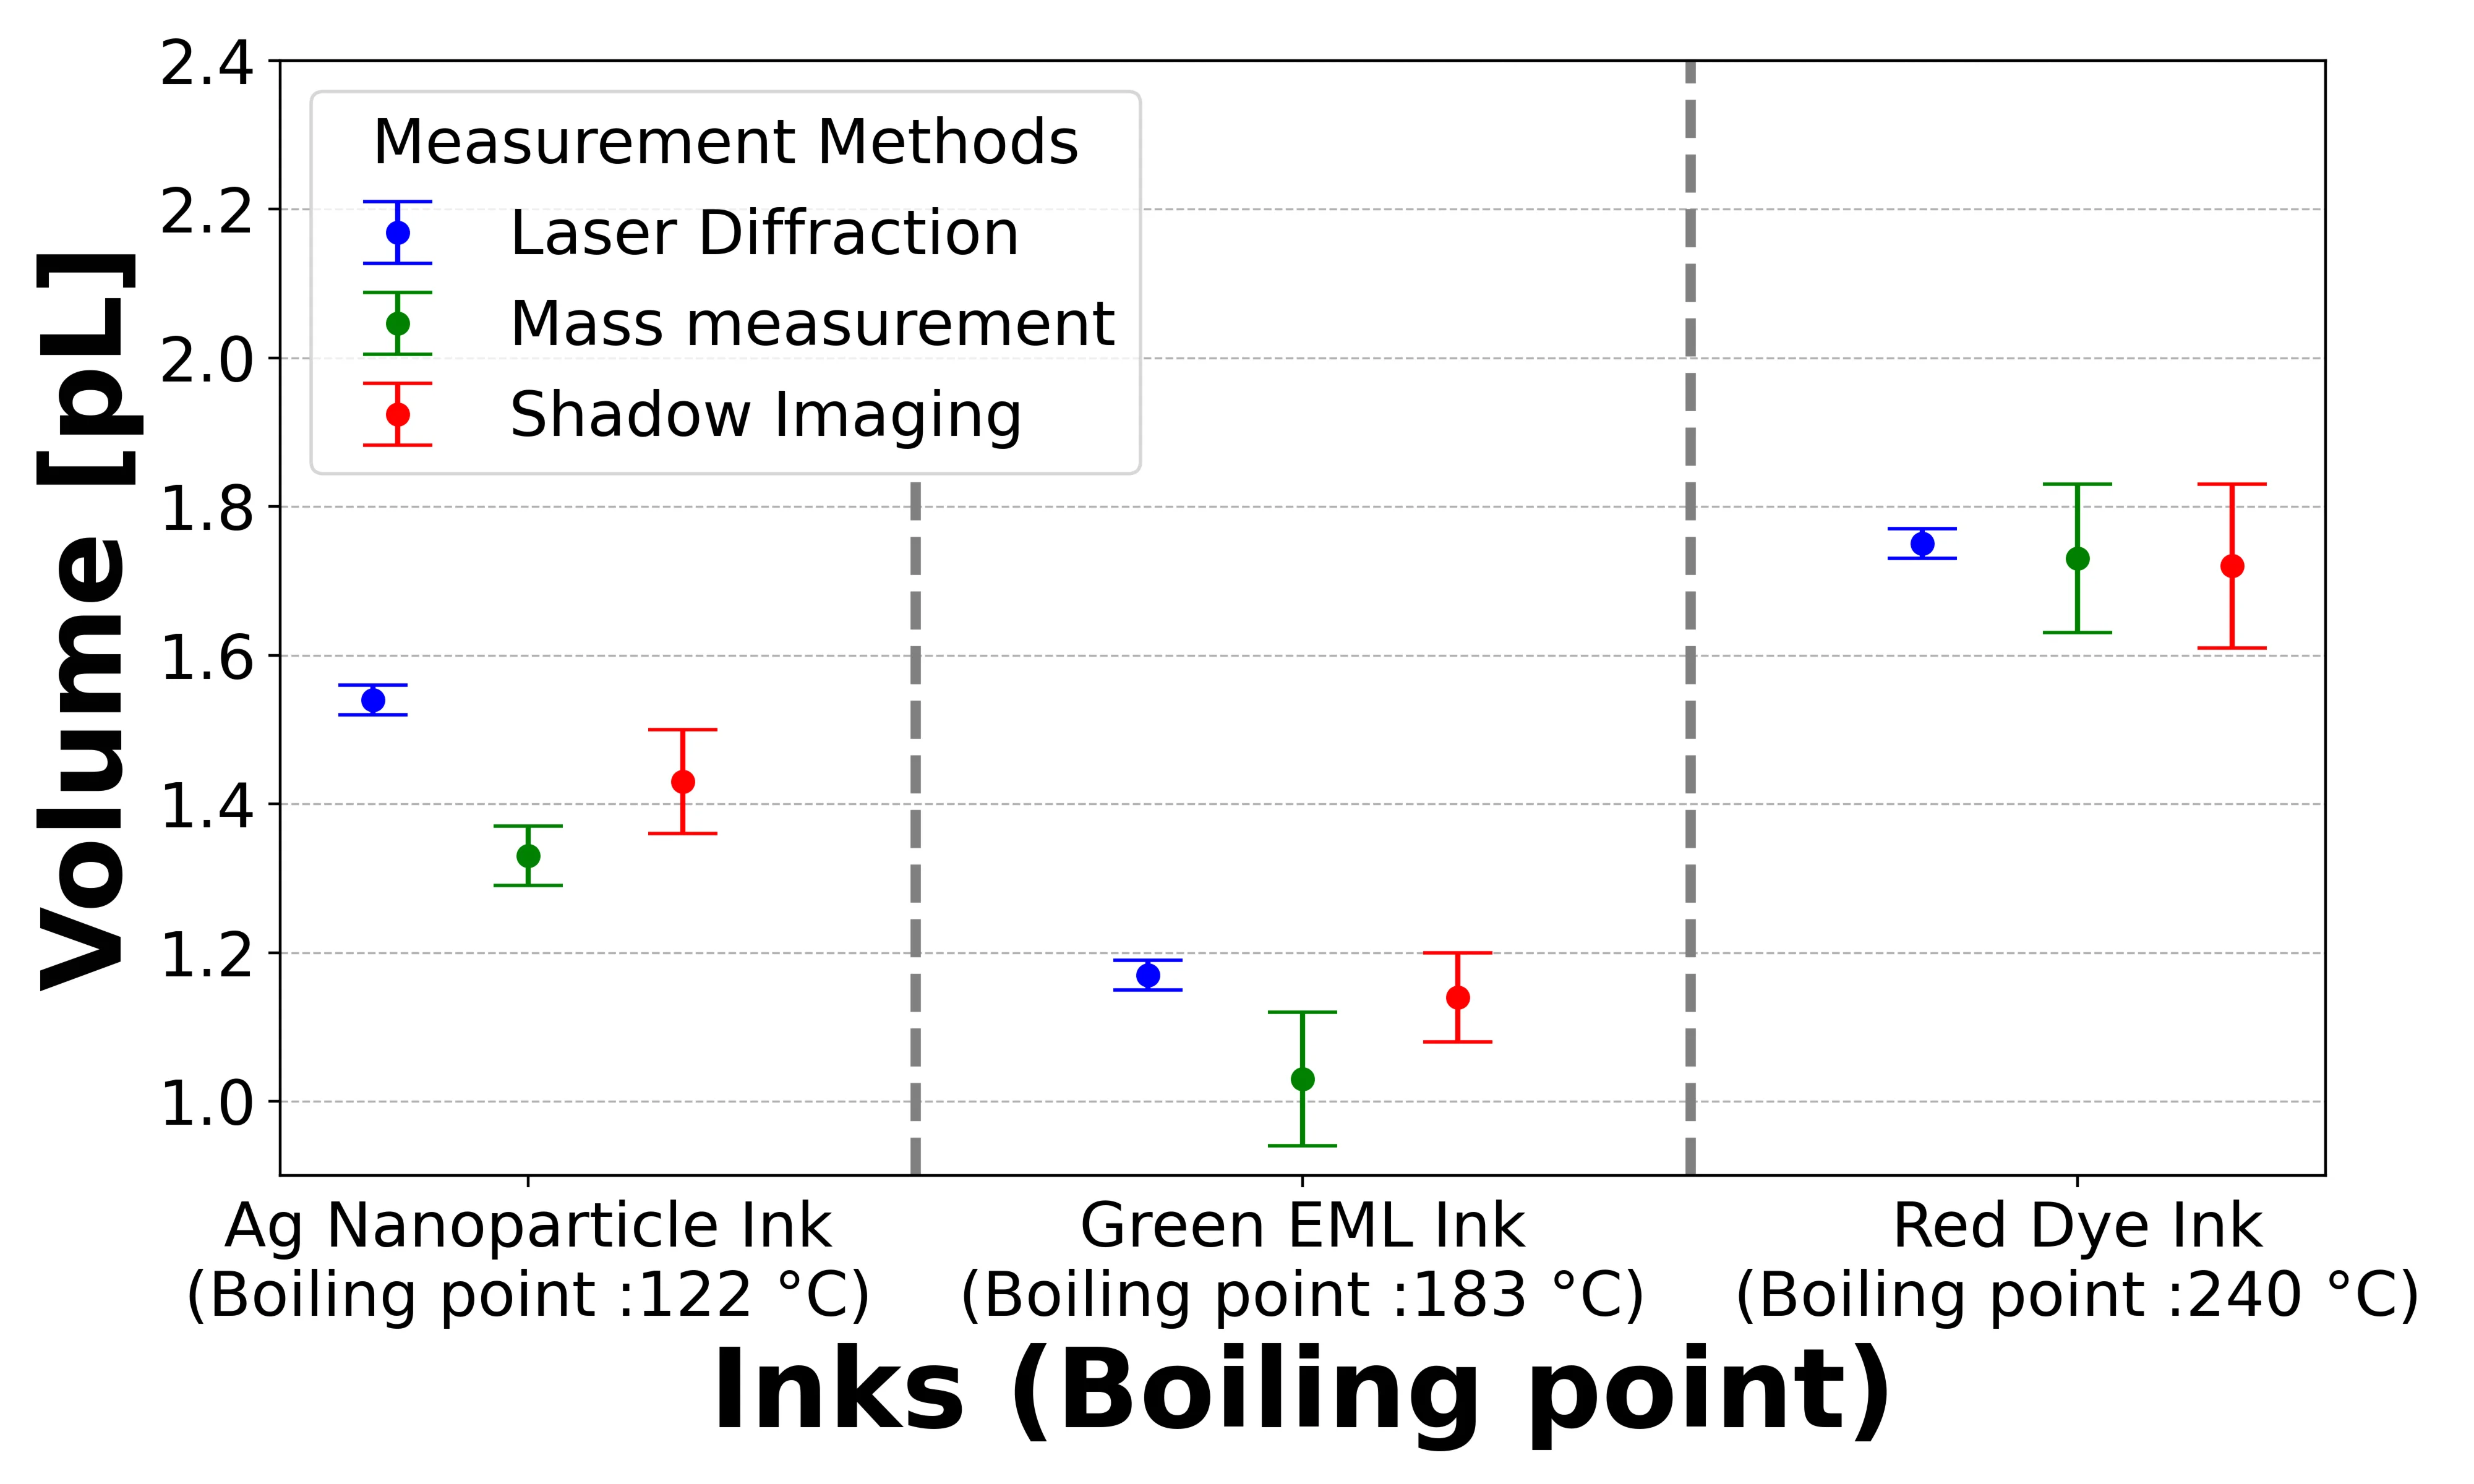
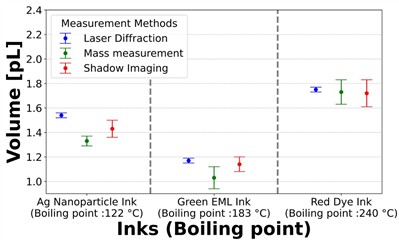
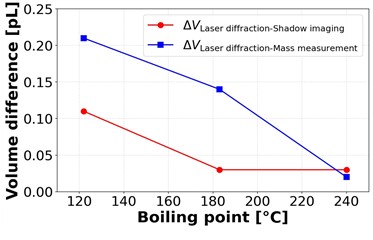
Fig. 7(a) compares the droplet volumes of three inks with different boiling points, measured using laser diffraction, mass measurement, and shadow imaging methods. For ease of comparison, the corresponding results and standard deviations are summarized in Table 3. Fig. 7(b) further presents the discrepancies between the laser diffraction method and the other two methods. A clear trend can be observed: as the boiling point increases, the discrepancies in measured droplet volume between the methods gradually diminish and approach zero. This suggests improved measurement consistency for high-boiling-point inks. In particular, the red dye ink (boiling point: 240 °C) exhibited almost negligible deviations across the three methods, whereas larger deviations were observed for the Ag nanoparticle ink (boiling point: 122 °C) and the green EML ink (183 °C). Specifically, for the Ag nanoparticle ink, the discrepancies between the laser diffraction method and the other two were 0.21 pL (mass measurement) and 0.11 pL (shadow imaging); for the green EML ink, 0.14 pL and 0.03 pL, respectively. For the red dye ink, the deviations were less than 0.02 pL. Hence, the boiling point is a key parameter influencing the reliability of volume measurements, especially when using methods sensitive to in-flight evaporation.
In the mass measurement method, we analyzed the results while accounting for evaporation effects, but none of the inks exhibited any apparent evaporation phenomena. However, when comparing this method with the other two approaches, we observed that the measured droplet volume for the OLED green ink and silver nanoparticles was lower than those obtained through alternative methods. Additionally, when droplets were heated to their boiling points, they evaporated rapidly, confirming the presence of evaporation effects.
Fig. 7a) Comparison of droplet volumes measured by three methods laser diffraction, mass measurement, and shadow imaging for inks with different boiling points (Ag nanoparticle, green EML, and red dye inks). b) Volume differences between laser diffraction and the other two methods (mass measurement and shadow imaging) as a function of ink boiling point
a)
b)
Table 3Volume measurement results obtained from three different methods (standard deviations in parentheses)
Ink | Ag nanoparticle | Green EML | Red Dye |
Laser diffraction | 1.54 [pL] (0.02 [pL]) | 1.17 [pL] (0.02 [pL]) | 1.75 [pL] (0.02 [pL]) |
Shadow imaging | 1.43 [pL] (0.07 [pL]) | 1.14 [pL] (0.06 [pL]) | 1.72 [pL] (0.11 [pL]) |
Mass measurement | 1.33 [pL] (0.04 [pL]) | 1.03 [pL] (0.09 [pL]) | 1.73 [pL] (0.10 [pL]) |
This observation suggests that droplet evaporation occurs in two distinct stages:
(1) In the jetting region, where the relative motion between the single droplet surface and the surrounding air enhances convective evaporation due to aerodynamic effects.
(2) After the post-jetting region, where evaporation is primarily concentrated at the accumulated droplet’s outer edges.
Kwon’s study [20] demonstrated that evaporation effects for low-boiling-point ink (BP: 82.6 °C) droplets produced by a relatively large nozzle with a 50 µm diameter could compensate for evaporation-induced errors during descent, but no such effects were observed in our experiments with a high-BP ink and a small nozzle with a diameter of 17 µm. This is a major limitation of the mass measurement method, i.e., the droplet size during ejection. For smaller droplets from a small nozzle as in our study, higher evaporation rates occur during the descent due to the relatively large surface area such that the evaporation rate slows significantly in the post-jetting region because most of the solvent in the droplets has already dried by this point. Therefore, for small-sized droplets, relying solely on post-jetting mass measurements to compensate for the mass loss during descent due to evaporation is unfeasible.
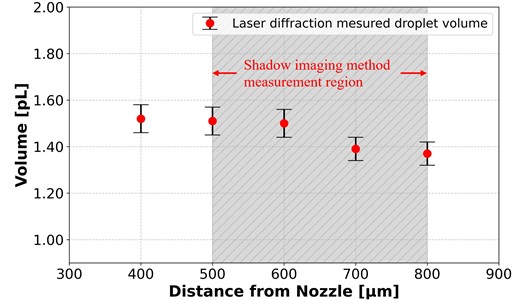
To confirm that low-boiling-point ink droplets undergo evaporation during descent, we employed the laser diffraction method to measure the volume of Ag nanoparticle ink droplets at various positions along their falling trajectory by adjusting the measurement points. The region for the measurements taken using the shadow imaging method is also indicated in Fig. 8 for comparison. The results from the laser diffraction method clearly demonstrate a decreasing trend in the droplet volume as the droplets descend, thus supporting the hypothesis that evaporation occurs during descent.
The shadow imaging method, utilizing an LED light source, cannot readily measure the volume of falling droplets accurately due to the large beam divergence angle inherent to LED illumination. This issue is particularly pronounced when measuring low-boiling-point (BP) inks, as the method is susceptible to convective evaporation effects during droplet descent. Additionally, the shadow imaging method employs a CCD camera to stack 30 frames into a single composite droplet image, thus introducing a measurement consistency limitation.
Fig. 8Measurement of droplet volumes at different positions using the laser diffraction method, where the gray region is the measurement region of the shadow imaging method
In contrast, the laser diffraction method, with its collimated laser beam positioned beneath the nozzle as a light source, effectively addresses these challenges. By incorporating a pinhole to narrow the laser diameter, this method ensures that only a single droplet interacts with the laser beam, minimizing the impact of evaporation during descent and achieving superior measurement consistency.
Notably, when analyzing the red dye ink (boiling point: 240 °C), the discrepancies observed across the three measurement methods were significantly reduced compared to those of the lower-boiling-point inks. This observation reinforces the conclusion that boiling point is a critical factor influencing measurement consistency. These findings are particularly relevant to high-precision inkjet applications such as printed electronics, OLED patterning, or biomedical droplet printing where evaporation-related inaccuracies can significantly affect process control and device performance.
4. Conclusions
In this study, three droplet measurement methods, specifically the laser diffraction, mass measurement, and shadow imaging methods, were evaluated using three inks with different boiling points to assess their accuracy, coefficient of variation, and applicability.
The results demonstrated that the laser diffraction method, based on Fraunhofer diffraction theory, offers superior performance in terms of real-time measurement capabilities, high coefficient of variation (maximum deviation of 1.7 %), and minimal sensitivity to evaporation effects, even with inks that have low boiling points. In contrast, the mass measurement and shadow imaging methods exhibited higher variability (maximum deviations of 8.7 % and 6.4 %, respectively) and were affected more by evaporation during the droplet descent point. Notably, the volume differences of the shadow imaging method and mass measurement method relative to laser diffraction decreased significantly from 0.11 pL and 0.21 pL, respectively. The volume differences were nearly zero as the boiling point of the inks increased, indicating that an ink with a low boiling point has a positive influence leading to high accuracy when the droplet descends.
For inks with low boiling points, laser diffraction was identified as the most reliable and feasible approach for single droplet volume measurements. These findings highlight the importance of selecting appropriate measurement techniques based on the ink properties to ensure precise control over the droplet size in inkjet printing applications.
This study emphasize that the boiling point of ink is a critical factor in selecting the measurement method. In particular, the laser diffraction method is most reliable for real-time, single-droplet measurements in high-precision applications such as printed electronics, OLED patterning, flexible displays, micro-patterned sensors, and bio-inkjet printing, where evaporation can significantly influence results.
References
-
T. Shimoda, K. Morii, S. Seki, and H. Kiguchi, “Inkjet printing of light-emitting polymer displays,” MRS Bulletin, Vol. 28, No. 11, pp. 821–827, Jan. 2011, https://doi.org/10.1557/mrs2003.231
-
Y.-H. Won et al., “Highly efficient and stable InP/ZnSe/ZnS quantum dot light-emitting diodes,” Nature, Vol. 575, No. 7784, pp. 634–638, Nov. 2019, https://doi.org/10.1038/s41586-019-1771-5
-
L. Nayak, S. Mohanty, S. K. Nayak, and A. Ramadoss, “A review on inkjet printing of nanoparticle inks for flexible electronics,” Journal of Materials Chemistry C, Vol. 7, No. 29, pp. 8771–8795, Jul. 2019, https://doi.org/10.1039/c9tc01630a
-
H. Wijshoff, “Drop dynamics in the inkjet printing process,” Current Opinion in Colloid and Interface Science, Vol. 36, pp. 20–27, Jul. 2018, https://doi.org/10.1016/j.cocis.2017.11.004
-
H. Y. Gan, X. Shan, T. Eriksson, B. K. Lok, and Y. C. Lam, “Reduction of droplet volume by controlling actuating waveforms in inkjet printing for micro-pattern formation,” Journal of Micromechanics and Microengineering, Vol. 19, No. 5, p. 055010, May 2009, https://doi.org/10.1088/0960-1317/19/5/055010
-
B. Derby, “Inkjet printing of functional and structural materials: fluid property requirements, feature stability, and resolution,” Annual Review of Materials Research, Vol. 40, No. 1, pp. 395–414, Jun. 2010, https://doi.org/10.1146/annurev-matsci-070909-104502
-
S. E. Burns, P. Cain, J. Mills, J. Wang, and H. Sirringhaus, “Inkjet printing of polymer thin-film transistor circuits,” MRS Bulletin, Vol. 28, No. 11, pp. 829–834, Jan. 2011, https://doi.org/10.1557/mrs2003.232
-
H. Wijshoff, “The dynamics of the piezo inkjet printhead operation,” Physics Reports, Vol. 491, No. 4-5, pp. 77–177, Jun. 2010, https://doi.org/10.1016/j.physrep.2010.03.003
-
C. D. Meinhart and H. Zhang, “The flow structure inside a microfabricated inkjet printhead,” Journal of Microelectromechanical Systems, Vol. 9, No. 1, pp. 67–75, Mar. 2000, https://doi.org/10.1109/84.825779
-
K.-S. Kwon, “Experimental analysis of waveform effects on satellite and ligament behavior via in situ measurement of the drop-on-demand drop formation curve and the instantaneous jetting speed curve,” Journal of Micromechanics and Microengineering, Vol. 20, No. 11, p. 115005, Nov. 2010, https://doi.org/10.1088/0960-1317/20/11/115005
-
S. Poozesh, K. Saito, N. K. Akafuah, and J. Graña-Otero, “Comprehensive examination of a new mechanism to produce small droplets in drop-on-demand inkjet technology,” Applied Physics A, Vol. 122, No. 2, Feb. 2016, https://doi.org/10.1007/s00339-016-9630-9
-
D. Y. Shin, Y. J. Moon, J. Y. Kim, and K.-T. Kang, “Measurement of inkjet droplet size based on Fraunhofer diffraction,” Review of Scientific Instruments, Vol. 94, No. 10, Oct. 2023, https://doi.org/10.1063/5.0159472
-
D. Y. Shin, Y. J. Moon, B.-K. Ju, and K.-T. Kang, “Measurement of inkjet droplet speed using interference fringe by diffracted light,” Springer Science and Business Media LLC, Scientific Reports, Sep. 2024.
-
H. C. van de Hulst, Light Scattering by Small Particles. New York: Dover Publications, 1981.
-
C. F. Bohren and D. R. Huffman, Absorption and Scattering of Light by Small Particles. New York: Wiley-VCH, 1998.
-
K. S. Shifrin, “Scattering of Light in a Turbid Medium,” NASA Technical Translation, Washington, D.C., 1968.
-
W. Wang, W. Liu, L. Yu, Y. Wang, J. Shen, and J. C. Thomas, “Optimal angular range for the Chin-Shifrin inversion algorithm in particle sizing by laser diffraction,” Journal of Quantitative Spectroscopy and Radiative Transfer, Vol. 224, pp. 319–324, Feb. 2019, https://doi.org/10.1016/j.jqsrt.2018.11.033
-
L. A. Dombrovsky, “Possibility of determining the disperse composition of a two-phase flow from the small-angle light scattering,” High Temperature, Vol. 20, No. 3, pp. 472–479, 1982.
-
L. A. Dombrovskii et al., “Atomization of superheated water: Results from experimental studies,” Thermal Engineering, Vol. 56, No. 3, pp. 191–200, Mar. 2009, https://doi.org/10.1134/s0040601509030021
-
K.-S. Kwon, D. Zhang, and H.-S. Go, “Jetting frequency and evaporation effects on the measurement accuracy of inkjet droplet amount,” Journal of Imaging Science and Technology, Vol. 59, No. 2, pp. 020401–1-020401-10, Mar. 2015, https://doi.org/10.2352/j.imagingsci.technol.2015.59.2.020401
-
R. M. Verkouteren and J. R. Verkouteren, “Inkjet metrology: high-accuracy mass measurements of microdroplets produced by a drop-on-demand dispenser,” Analytical Chemistry, Vol. 81, No. 20, pp. 8577–8584, Oct. 2009, https://doi.org/10.1021/ac901563j
-
M. Renksizbulut and M. C. Yuen, “Numerical study of droplet evaporation in a high-temperature stream,” Journal of Heat Transfer, Vol. 105, No. 2, pp. 389–397, May 1983, https://doi.org/10.1115/1.3245591
-
D. Lohse, “Fundamental fluid dynamics challenges in inkjet printing,” Annual Review of Fluid Mechanics, Vol. 54, No. 1, pp. 349–382, Jan. 2022, https://doi.org/10.1146/annurev-fluid-022321-114001
-
I. Hutchings, G. Martin, and S. Hoath, “High speed imaging and analysis of jet and drop formation,” Journal of Imaging Science and Technology, Vol. 51, No. 5, pp. 438–444, Sep. 2007, https://doi.org/10.2352/j.imagingsci.technol.(2007)51:5(438)
-
S. D. Hoath, “On international standards for in-flight measurements of inkjet drops,” Journal of Imaging Science and Technology, Vol. 62, No. 1, pp. 010401–1-010401-8, Jan. 2018, https://doi.org/10.2352/j.imagingsci.technol.2018.62.1.010401
-
H. Wijshoff, “Acoustic monitoring,” in Inkjet‐Based Micromanufacturing, Wiley, 2012, pp. 145–158, https://doi.org/10.1002/9783527647101.ch10
-
G. D. Martin, W. C. Price, and I. M. Hutchings, “Measurement of inkjet drop volume – the role of image processing,” Journal of Imaging Science and Technology, Vol. 60, No. 4, pp. 040401, Jul. 2016, https://doi.org/10.2352/j.imagingsci.technol.2016.60.4.040401
About this article

This study has been conducted with the support of the Korea Institute of Industrial Technology as Development of root technology for multi-product flexible production (KITECH EO-24-0009).
The datasets generated during and/or analyzed during the current study are available from the corresponding author on reasonable request.
Y. H. Hu conducted the experiment and wrote the main manuscript text. D. Y. Shin provided the development and design of the methodology. Y. J. Moon conducted the experiment with Y. H. Hu, J. K. Kim, and K.-T. Kang supervised and guided this study. All authors reviewed the manuscript.
The authors declare that they have no conflict of interest.
