Abstract
Efficient monitoring of metal-working fluids (MWFs) is crucial to maintaining optimal machining performance and ensuring the safety and health of workers in the metalworking industries. Knowledge of the performance of cutting fluids in the machining of various workpiece materials is very important to improve the efficiency of any machining process. Metal machining companies using MWS have the opportunity to choose the best product from the wide range offered, which can differ in physical parameters as it is designed to be best for the selected process. The unique adaptation to the manufacturing process poses certain challenges in monitoring MWS quality during machining. The importance of MWS quality is crucial, which can lead to costly defects and loss of workpieces. The monitoring only by the quality lab sometimes is insufficient. This article presents the development of a sensor for the indirect monitoring of MWFs, aiming to provide a cost-effective and nonintrusive solution to assess the quality and condition of these fluids. The measurement results are compared with those of other emulsion quality control protocols. Its implementation can significantly enhance the efficiency of MWF management, leading to improved machining performance, reduced downtime, and enhanced worker safety. The sensor's nonintrusive nature eliminates the need for frequent manual sampling, reducing costs and minimizing the environmental impact associated with traditional monitoring practices. Overall, the sensor described in this article offers a viable solution for indirect monitoring of MWFs, contributing to the advancement of smart manufacturing and the optimization of metalworking processes.
1. Introduction
Currently, in the engineering industry, many technological processes of metal processing are impossible without MWFs [1, 2], which contribute to the quality of the processing, and increase productivity and tool life. Lubrication and cooling enormously affect drill life and machining quality [3]. Generally, MWFs reduce not only the temperature but also friction between the tool and the workpiece, extend the useful life of the tool, and improve efficiency and surface quality [4]. During the machining process, the surfaces of the machine and tool experience high temperatures, which affect the quality of metal machining [1,5]. The high-pressure cooling supply, which was delivered to the tool, was facilitated in many metal machining processes of metal machining [6, 7]. The most common properties of MWFs are high flash point, high heat absorbency capacity, lubrication, odorless, stability in the required time, sustainability, environmentally friendly use of resources, and the possibility of regenerating auxiliary materials [8]. Oil-based MWFs are manufactured to inhibit shale, lubrication, and suspend cuttings [9], formulated to be pseudoplastic with weak yield stress [10] and withstand thermal damage [11]. The selection of MWFs results in a cooling effect, lubrication, and transportation of the chip formed from the cutting zone, or due to the cutting edges of the drill tool, when chlorine or sulfur additives are necessary to emulsion oils [5]. The machining of hard alloys plays an important role in the development of new technologies [12, 13]. Effectiveness can be assessed on certain process parameters such as flank wear, surface roughness, developed cutting forces, and temperature developed at the tool-chip interface [14]. Several researchers are investigating nanostructured microfiber structures with nanostructures and have a promising path for the machining industry [15-20]. Conventional MWFs provide an excellent environment for microorganisms. Hence, emerging methods for sustainable strategies to reduce MWF can significantly improve manufacturing processes [21]. Bio-oil as cutting fluids for metal machining have attracted interest [22].
Most often, there is a problem of compatibility between MWFs and workpiece materials when new chips appear, shortening the service life of the emulsion, and processes have to be stopped, increasing costs related not only to the price of the emulsion. Computational MWF dynamic analysis based on a three-dimensional turbulent model can usually be applied to investigate cooling possibilities [23]. A. Aggarwal [24] proposed a method to divide limitations for conventional MWFs. The permeability of emulsion droplets was measured first one hundred years ago by G. Clowes [25]. M. Abasi [26] represented the review of the emulsion. The emulsion purification method was proposed by Y. Zelenko [27]. Circulation as a purification method for MWFs was mentioned by X. Wu [28]. Taking into account the limitations of MWFs and cleaning techniques, a self-adaptive flow supply system, and an MWF adjustment mechanism can be applied [28, 29]. The MWFs depend on several factors, including the specific metalworking process, the cutting speed, the temperature, the material being machined, and environmental considerations [30, 31]. Identifying the changes that occur in MWFs during operation and the importance of carefully monitoring these changes. Development of methods for detailed analysis both on-site and in the laboratory [29, 32, 33].
To understand the complexity of our task, we must mention the difference between a simple solution with large metal shavings in it and a colloidal structure emulsion with microscopic particles and distributed colloidal particles. The system we investigate is metal shavings of various sizes dispersed in an emulsion of two phases liquid (oil in water), the stability of which is ensured by emulsifiers, and surfactants, and it is a complex phase distribution [34]. Two-phase systems, suspension, and emulsions are particularly prone to electrostatic charging during mixing [35]. The rate of particle migration in the electric field is proportional to the electrokinetic potential [36]. With a decrease in charge, the droplets tend to coalesce into a single phase. It is known that the surface charge depends on the pH of the system and that droplets can be reduced by adding pH-dependent surfactants. The mixing rate and the mixing time are other important factors to keep the emulsion stable [37].
The surfactant easily adsorbed at the oil-water interface can dissociate from the emulsion, with a coalescence destabilizing emulsion [38]. The electrical double layer on the surface is significant for particle agglomeration [39]. The initial colloidal system emulsion, which during machining, was transformed into a suspension containing different-sized metal particles. The organic molecules of emulsion located on the surface of the liquid drop are in contact with molecules of other phase molecules (water drop, air) that is, they don't have or are “missing” neighbors with whom they can construct intermolecular attractive interactions, resulting the higher energy in comparing with molecules that are in the bulk of solution surrounded by similar molecules is energetically different from that in the bulk [40], [41]. Typical interactions in suspension are the Derjaguin-Landau-Verwey-Overbeek (DLVO) potential, resulting from the sum of a screened Coulomb and van der Waals contributions [42], a short-range attraction represented by a square-well (SW) [43]. Changes in the composition of the colloidal system should be noticeable shortly before the aggregation of solid particles begins. The measurement of electrical resistance has been successfully applied in the food industry to measure electrical resistance to evaluate the emulsifying capacity [44], for asphalt studies [45], in bitumen emulsion [46], at the emulsification process [47], in oil microemulsions by H. Singh [48]. The droplet size distribution is monitored by electrical impedance spectroscopy [49]. The external electric field can break down water-in-oil emulsions [50]. G. Taylor [51] investigated the electro-hydrodynamics of emulsion droplets in the electric field. The leaky dielectric model assumes that there is no charge on the net interface and the electroneutrality of the bulk liquid [52]. The direction of the DC electric field is proportional to the droplets and their elongation. At the same time, the continuous phase will act as an insulator between two electrodes [50]. AC, DC, and pulsed DC act by different mechanisms on emulsion to enhance phase separation by droplet-to-droplet coalescence causing an agglomeration [53].
The adhesion between the MWFs and the mud is one of the important properties to maintain stability [9]. Surface active materials producing self-assembled monolayers have catalytic activity [54] but, in our case, complicated research. Adsorption is a very important interaction between metal and organic matter, which also affects our proposed quality assessment method [55-57]. The kinetics of adsorption on a metal electrode are influenced by factors: contact time, temperature, and concentration [58-61].
The purpose of the study is to develop a method for measuring the degree of contamination of the coolant, for a simple, but not required, analysis in a quality laboratory, for a quick determination of the fluid quality suitable for the metal cutting process. The hypothesis of the study is the possibility of measuring the degree of coolant contamination using electrical resistance and refractive index. The scientific novelty is the result of the experiment showing the relationship between the parameters of electrical resistance and the purity of the coolant.
This paper is dedicated to the research and analysis of early liquid pollution detection using indirect methods.
2. Methodology
Before conducting our measurements, a detailed literature analysis was conducted, and a comparison with industrial devices for evaluating emulsion quality was obtained. Based on collected information in publications, and knowledge of fundamental sciences, we conduct experiments to propose a simple way to instant assessment of metal-cutting emulsion status. The methodology of our research was to investigate the ability of simple assessment of metal cutting emulsion quality by application of simple devices and to compare resistance measurements using two electrode systems prepared from different metals and using a digital multimeter. The two-electrode system was manufactured for measurements in liquids by multi-meter. For resistance and all other experiments, the emulsion sample before metal cutting was selected as “pure” and the sample of emulsion removed from the machine as not suitable for metal cutting was set as 100 % contaminated, which diluted with deionized water was used for intermediate measurements. All measurements were performed 3 times to ensure minimal data compliance analysis. In parallel, we measured parameters of emulsions as usually investigated to submit emulsion quality status by turbidimetric measurements, conductivity, refractive index, and pH and optical microscopy of samples. The emulsion samples were taken in workplaces before metal cutting and after metal processing. The concentration of pollutants was determined using samples of processed emulsion removed from the machine. The calibration curves are calculated by measuring pH, resistance, refractive index, emulsion residence time, and turbidimetric measurements obtained from samples taken in different stages of emulsion quality. The obtained curves were fitted, and the angle of inclination of the curve was determined for the next measurements of specifically selected emulsions. Each emulsion from a different manufacturer requires its calibration curve. To demonstrate the accuracy of our chosen measurement, we selected emulsions from three different manufacturers from three different workplaces. The main goal of this paperwork was to investigate the possibilities of testing the quality of the metal cutting emulsion used using simple methods to reduce the costs of such testing and make it more accessible for emulsion quality monitoring in the absence of industrial facilities.
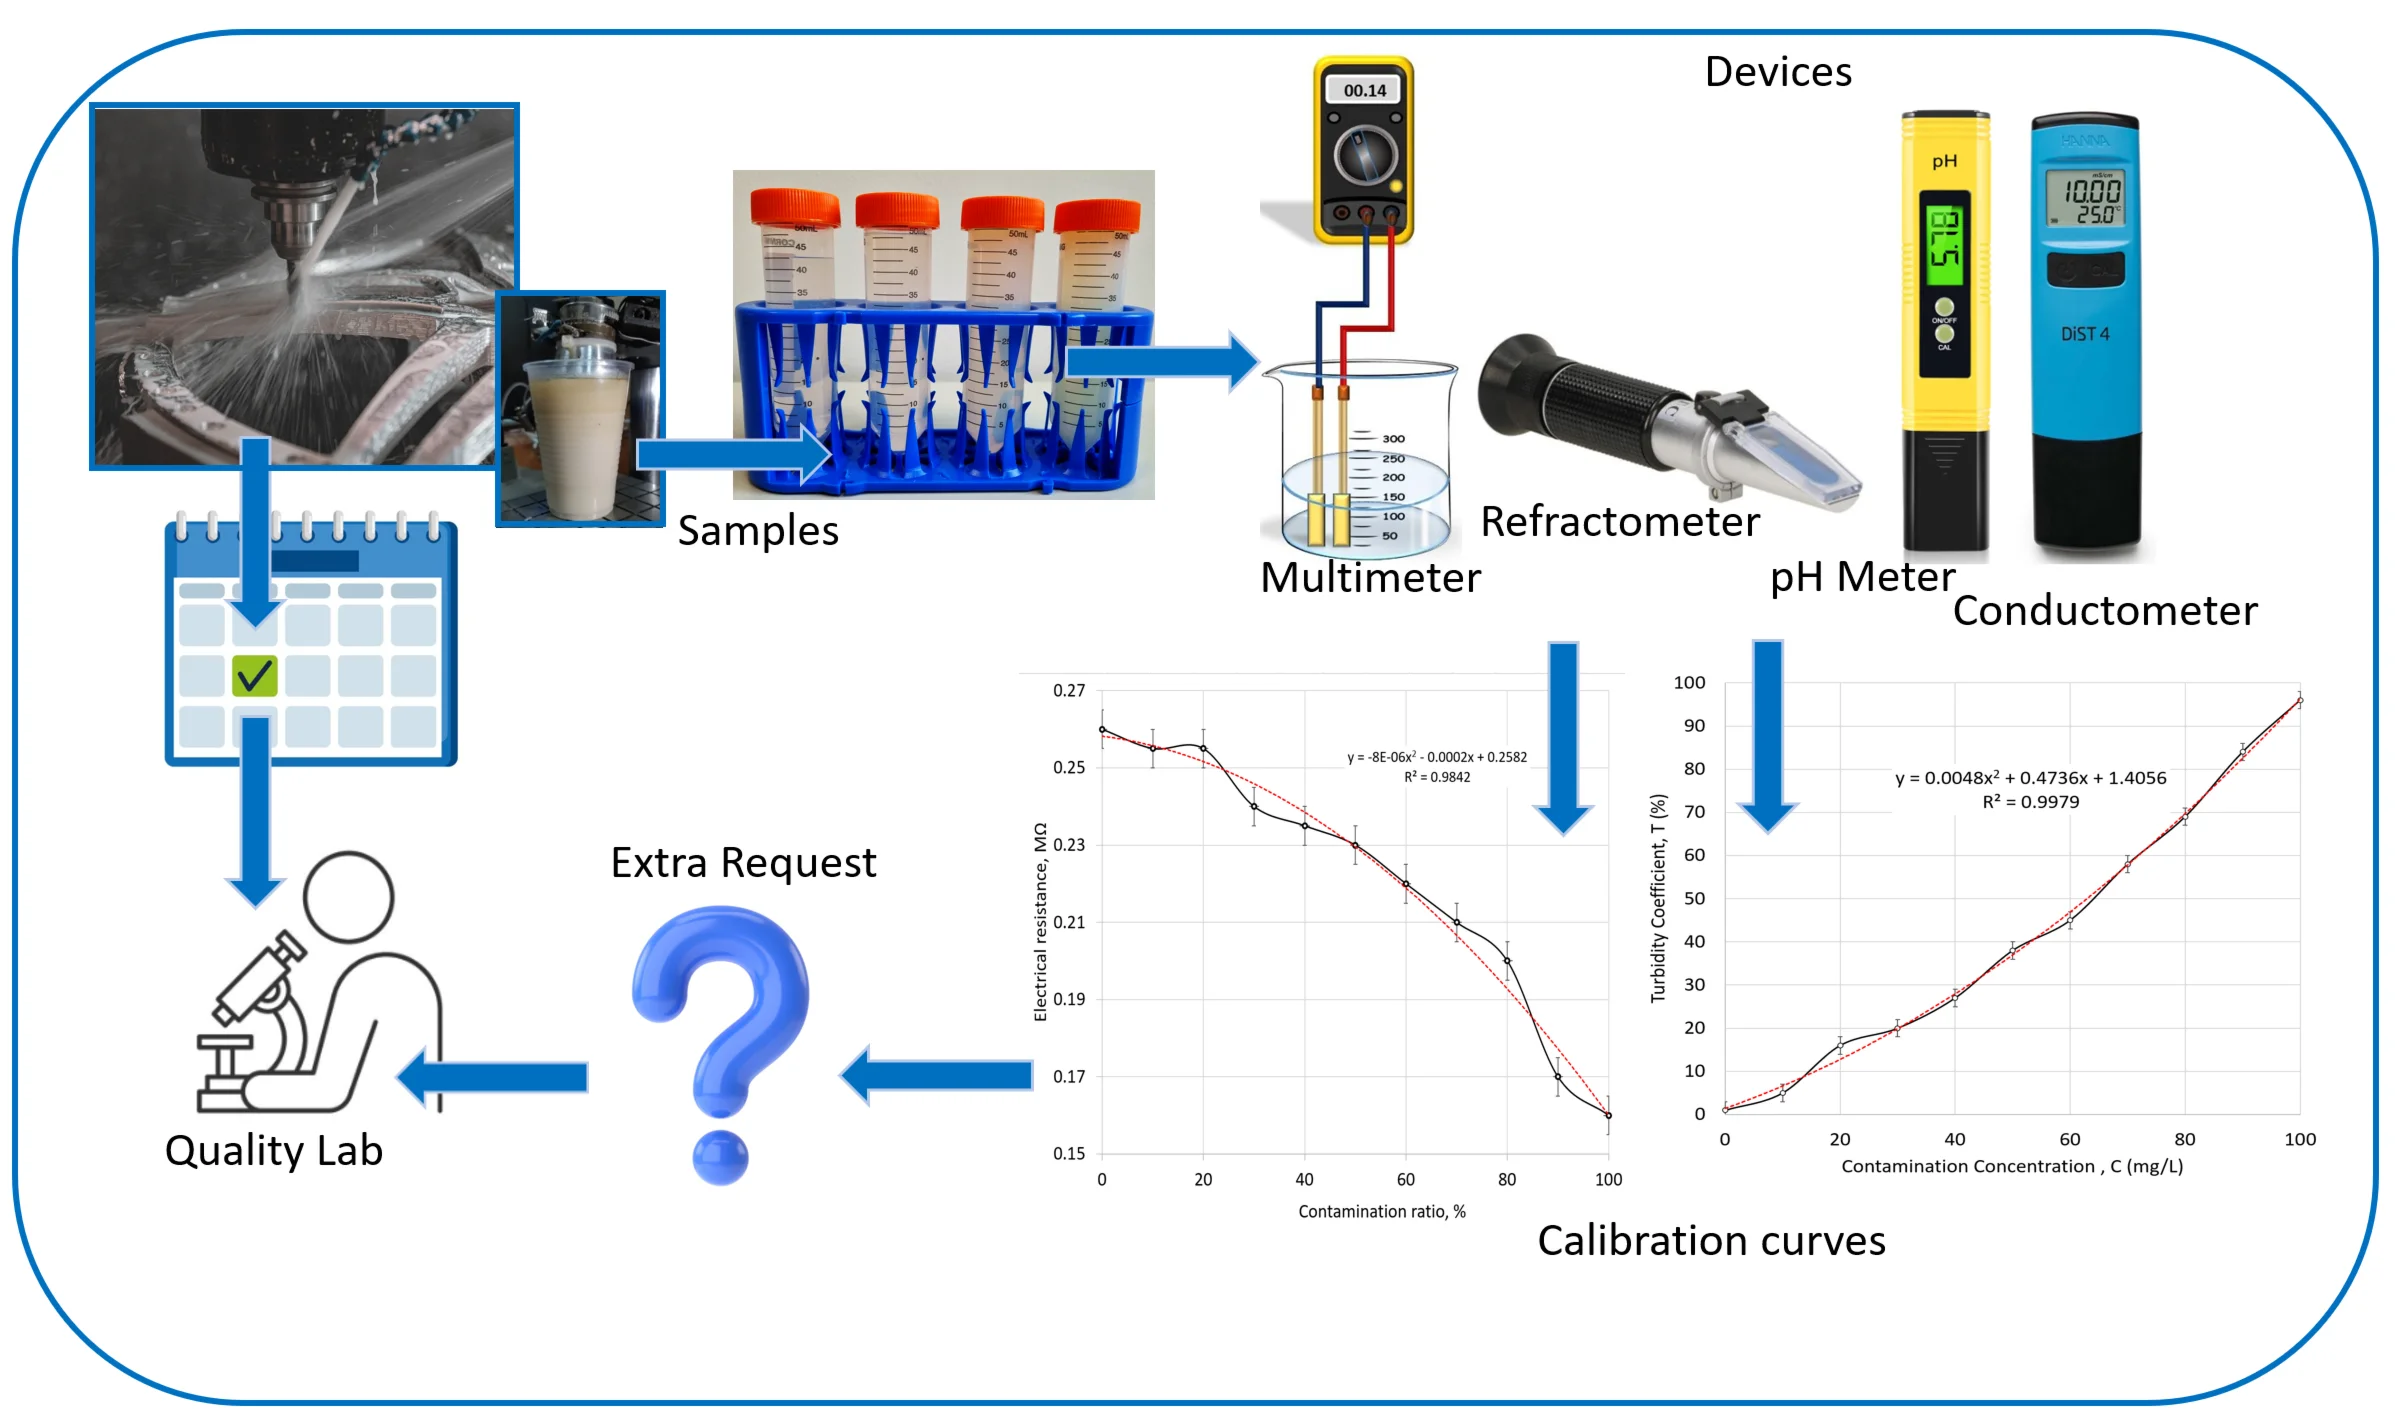
3. Devices for metal-cutting liquid quality investigation
Digital multimeters typically use the constant current method and voltage drop when conversion from current to resistance. For measurements of resistance in emulsion, the digital multimeter Vorel was applied with two copper electrodes placed at a constant distance between them. The electrode system for resistance measurements was made of a dielectric sheet with a copper coating, where two copper wires were soldered to the copper on the surface. Two separated plates were created by etching a line about 1 mm one wide in the middle of the sample for a constant distance between electrodes. The simple measurement stand is represented in Fig. 1(a). Before measurement, these prepared electrode system surfaces were cleaned with 1Mol/L KOH for a few seconds to remove grease and other contamination. The surface was washed in deionized water and dried. The liquid with different concentrations of emulsion samples was prepared according to the following procedure: 1 part of the initial liquid mixed with 9 parts of deionized water, next- 2 parts with 8, etc. Before every measurement, the liquid was shaken manually. The refractometer was used to measure the optical refractive index (Fig. 1(b)). The acidity or basicity of the emulsion was investigated by a pH meter (Fig. 1(c)), and the electrical conductivity of the liquid was measured by a conductivity meter to investigate the ability to transmit electrical charge in the emulsion (Fig. 1(d). As represented in Fig. 4, our selected pocket devices are a simple solution to collect additional data in the workplace of metal machining processes.
Fig. 1Simple investigation of emulsion quality: a) simple investigation of liquid by resistance measurement with the multimeter and two electrodes, b) refractive index measurement refractometer, c) pH meter, d) conductivity tester

a)
b)

c)
d)
All of our represented experiments are aimed at achieving simple metal-cutting emulsion quality control to tests immediately, not requiring quality laboratory tests, using handheld devices. We also conducted a second experiment by determining the degree of contamination of the liquid using the transillumination method. To experiment, a sample of coolant was taken from the working equipment and then poured into transparent glass containers. For comparison, clean coolant and distilled water in a separate container were used. The coolant container was placed in front of the light source. A white screen was placed behind the container on one side and a lux meter opposite the other to measure light transmission. To quantify pollution, the turbidity coefficient parameter was used, which was determined by measuring light transmittance. The data represented in graphs of the change in electrical resistance as a function of measurement time were plotted. Based on the experimental results, regression equations were compiled, and dependency graphs were constructed.
4. Analysis of the liquid refractive index dependence on the pollution level of metalworking fluid
Usually, emulsions are inspected by centrifugation, measuring Zeta potential, viscosity, vetting degree, turbidimetric evaluation, FT-IR Spectrometry, and contact angle investigation [62]. Not all these investigation methods can be applied to drilling emulsions, especially polluted ones. Oil-in-water emulsion can be investigated on buoyancy and refractive index changes [63]. The optical refractive index explains the permeability of the material to electromagnetic waves, and the dependency of the concentration of different materials on a refractive index is a common research method. The optical refractive index is defined by the formula:
where – optical refractive index, – relative dielectric permittivity of the material, – relative magnetic permeability.
The emulsion residence time can be calculated from the refractive index by converting to concentration and using a calibration curve [64]:
where is the time each measured .
5. Analysis of the liquid pollution stages
The analysis of contamination in MWFs involves assessing the presence and levels of pollutants in these fluids. MWFs can become contaminated with various substances during their use, storage, and handling, which can affect their performance and pose risks to human health and the environment. Here is a description of the analysis process for contamination in MWFs.
– Sample collection: Representative samples of MWFs are collected from different points in the manufacturing process. This includes sampling from fluid reservoirs, sumps, machine tools, filtration systems, and any other relevant locations. Samples can also be collected from wastewater discharges or spills of wastewater.
– Physical Examination: The collected samples are visually examined for signs of contamination, such as discoloration, sedimentation, or unusual odors. The appearance and physical properties of the fluids are noted, including color, clarity, viscosity, and acidity level.
– Chemical Analysis: Analytical techniques are employed to determine the presence and concentrations of contaminants in MWFs.
Common contaminants include:
a) Metals: Metal concentrations are measured using techniques such as inductively coupled plasma mass spectrometry (ICP-MS) or atomic absorption spectroscopy (AAS). Common metals of concern include lead, chromium, nickel, cadmium, and zinc [65].
b) Organic Compounds: Volatile organic compounds (VOCs) and semi-volatile organic compounds (SVOCs) can be analyzed using gas chromatography (GC) or liquid chromatography (LC) coupled with mass spectrometry (MS). These compounds can include hydrocarbons, cutting oils, coolants, and additives.
c) Microbial contamination: Microbiological analysis can be conducted to detect and quantify microbial contaminants, such as bacteria, fungi, and algae, which can degrade the performance and cause health risks [66].
There are also other methods of MWFs monitoring, one of these is monitoring and predicting the emulsion stability of MWFs using the salt titration and laser light scattering method [67].
By conducting a comprehensive analysis of contamination in MWFs, industries can effectively manage and control the quality of these fluids, minimize risks, and maintain optimal performance in metalworking processes. Monitoring of MWFs is an important stage in the life cycle of a liquid. In this article, the method of electrical resistance is proposed to assess the degree of contamination of MWFs.
Previously, we developed a method to clean the coolant with ultrasound, which showed the effectiveness of this method.
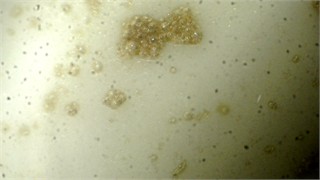
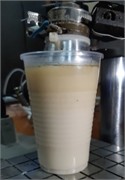
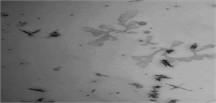
During the experiment, when exposed to ultrasound directly on the coolant, small black nodules appeared, which included metal particles, dust, and other debris (Fig. 2(a)).
When exposed to the vessel walls, air bubbles formed next to them, including more metal and debris than in the previous experiment (Fig. 2(b)). These bubbles rose to the center, creating a pattern, and gradually a contaminated layer formed at the top of the vessel (Fig. 2(c)).
Fig. 2Visual representation of MWFs in different stages of status: a) cavitation, leading formation of small vapor-filled cavities in the liquid, b) coagulation – when chemical destabilization is observed, c) separation, when stability of emulsion is lost due to large amount of floating metal particles
a)
b)
c)
In Fig. 1(a) is represents the view of the normal MWFs with emulsion droplets distributed even in the volume of liquid or dispersed liquid. As is represented in Fig. 1(c), the metal particles in small amounts demonstrate flotation, and when the amount of metal pollution becomes large, the sedimentation process begins, when aggregated particles of metal with emulsion droplets are collect on the bottom of the vessel. Based on the results obtained as a result of this study, it became necessary to develop a new method for determining the degree of coolant contamination, taking into account the separation resulting from ultrasonic cleaning. In this article, the use of the electrical resistance method is proposed to assess the degree of coolant contamination.
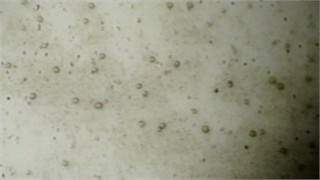
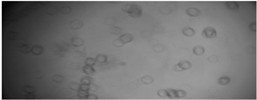
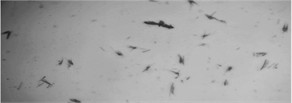
The initial liquid was investigated under the microscope scanning micro-robotic system. These micrographs are shown in Fig. 3.
Fig. 3Visual representation of different phases in MWFs: a) droplets of oil in the fluid emulsion. Mag 20×0.40×4, wd1.4; b) metal parts in emulsion, Mag 20×0.40×2, wd 10.4, c) contaminations in emulsion Mag 20×0.40×1.5, wd 10.4
a)
b)
c)
As represented in Fig. 3, the oil droplets in the emulsion are separated from each other at a distance larger than the diameter of the droplet, so it is a stable enough system. The metal contamination is the fluid’s sharp structure. Hence, the product for investigation contains two unmixable liquids, solid phase metal cuttings, and gas phase bubbles. In Fig. 3(c) there is a visible emulsion coalescence effect.
6. The electrical resistance of emulsion
As a result of the experiment, it was proved that with an increase in contamination of the liquid with metal shavings, the electrical resistance changes.
The high electrical conductivity of metals is because they have a large number of current carriers – conduction electrons formed from valence electrons of metal atoms that do not belong to a particular atom. An electric current in a metal arises under the action of an external electric field, which causes an ordered movement of electrons. Electrons moving under the action of the field are scattered inhomogeneities of the ion lattice (on impurities, lattice defects, as well as violations of the periodic structure associated with thermal fluctuations of ions). In this case, the electrons lose momentum, and the energy of their movement is converted into the internal energy of the crystal lattice, which leads to the heating of the conductor when an electric current passes through it.
With increasing contamination by metal particles, the conductivity of the liquid increases due to the large number of charge carriers (conduction electrons) in the metal, which, in turn, reduces the electrical resistance of the liquid. In this case, the regression equation describes how the concentration of metal particles in a liquid affects its electrical resistance.
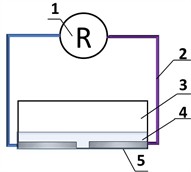
The resistance measurement using a multimeter schematic electrical circuit is represented in Fig. 4. To conduct the measurement, we selected Al, Cu, and Fe metal electrodes with a surface area of 50 mm2, the distance between electrodes was 1 mm, and the volume of solution used was 1 mL.
Fig. 4Resistance measurement visual representation: 1 – multimeter; 2 – connecting wires, 3 – container for liquid; 4 – liquid for measurement; 5 – metal electrodes
Currently, the methods elaborated to divide a pool of samples into calibration and validation subsets for multivariate modeling gained significant speedup during the last few decades including methods for selecting samples and parameters for quality parameters [68], [69], including simulation [70] where uncertainty quantification remains underexplored [71].
To perform an investigation on the dependence of pollution of drilling emulsion on the measured resistance of liquid, the calibration curve was built (Fig. 5). As represented in Fig. 5, the differences in resistance in MΩ vary from 0.26 to 0.16 MΩ. This could be a solution, but the calibration curve has to be created for each different emulsion by the users themselves.
As it is represented in Fig. 5, the linear trendline corresponds worse to experimental data, which is generally typical for most electrically conductive solutions measurements. Polynomial order 2 or quadratic polynomial This means that at least one of the variables should be raised to two, and the powers of the other variables will be less than or equal to two but greater than –1.
The graph shows how the electrical resistance of the liquid decreases with increasing contamination by metal shavings. The actual data (marked with dots) are compared with the predicted values of linear regression (red line), which demonstrates a close linear relationship between the degree of contamination and electrical resistance for this experiment. The decrease in resistance is due to an increase in the conductivity of the liquid as the concentration of metal particles increases since metals contain free electrons that facilitate the passage of electric current. It was performed an experiment in which the degree of coolant contamination was determined by light transmission. During the experiment, the degree of MWF contamination was assessed by the transillumination method. For a quantitative assessment of contamination, the turbidity coefficient (, %) parameter was used, which was determined by measuring light transmission. To analyze the dependence of the turbidity coefficient on the concentration of contaminants, the linear regression method is used:
where: – turbidity coefficient (%), – concentration of contaminants (mg/L), , – regression coefficients.
Fig. 5Calibration curve for electrical resistivity measurement with polynomial Order 2 trend line to represent the effect of contamination on electrical resistance of emulsion. The calibration curve for determination of pollution rate of drilling emulsion by measurement of resistance between two copper electrodes placed at a distance of 1 mm
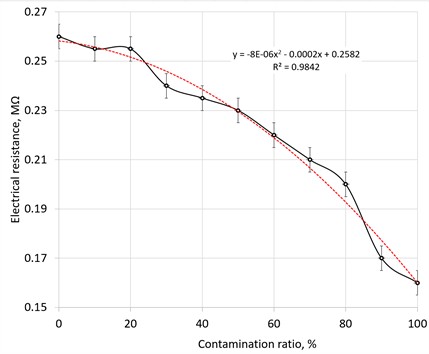
The determination coefficient shows a good fit of the experimental data to the linear model and for the quadratic polynomial (Order 2), which corresponds to other authors’ emulsion investigations [72-74].
Fig. 6Investigation of contamination degree of MWFs by turbidimetry. Dependence on turbidity on contamination concentration dependence curve (a) measurement results and linear fitting, (b) measurement results and fitting line polynomial Order 2
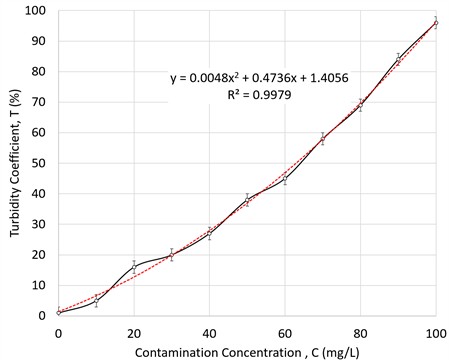
Fig. 6 represents how the turbidity coefficient varies with the degree of contamination of the liquid. The actual data (marked with dots) are compared with the predicted values of the linear regression (red line), which demonstrates a close linear relationship between the degree of contamination and the turbidity coefficient. This method is suitable for the presence of a Quality lab.
7. Measurements of emulsion physical parameters
In our investigation, we selected 3 emulsions from different manufacturers. The refractive index of the emulsion was measured at room temperature. The refractive index analysis, using a Fisher Scientific Abbe refractometer, followed a calibration protocol. The specific electrical conductivity, liquid pH, and resistance 10 times. The samples were shaken before measurements to distribute solid particles in the solution. The measurements were taken in sequence on the same day. The error bars are derived from all ten measurements. The measurements performed started with ‘clean’ samples. After every measurement, especially after contaminated emulsion samples, the devices were cleaned according to equipment usage procedures specified by the manufacturer. The results of all selected parameter measurements are represented in Table 1.
Table 1Results of parameters measurement of different metal-cutting liquids
Emulsion number | pH | Specific electrical conductivity, mS cm-1 | Optical refractive index | Resistance, MΩ | |
No. 1 | clean | 8,51 ±0,15 | 2,41±0,05 | 1,3522±0,0005 | 1,5±0,5 |
polluted | 8,67±0,12 | 3,28±0,1 | 1,3575±0,002 | 1,1±0,7 | |
No. 2 | clean | 9,47±0,1 | 0,23±0,02 | 1,3467±0,0002 | 1,1±0,2 |
polluted | 9,39±0,1 | 0,03±0,01 | 1,3589±0,001 | 1,92±0,3 | |
No. 3 | clean | 9.85±0,14 | 3.81±0,2 | 1.3557±0,0002 | 1,2±0,05 |
polluted | 9.48±0,2 | 2.49±0,2 | 1.3563±0,0003 | 3.62±0,3 | |
Water, deionized | 5,55 | 0.00002 | 1,3303 | 1,6±0,01 |
As it is represented in Table 1, the differences in pH, specific electrical conductivity, and optical refractive index depend on contamination concentrations, but increasing or decreasing measured results depends on the electrical conductivity of contaminations. Also, contamination causes emulsion degradation, so the refractive index may be determined by sampling method, when naturally near the liquid surface more organic molecules after degradation of emulsion, are collected. Hence, optical refractive index measurements are complicated by sampling. The measurement of emulsion pH depends on acidity and degree of dissociation of contamination material. Hence, it can’t be a proper measurement, because contamination is not always a dissociable substance. Specific electrical conductivity is facing a similar problem, where the reduction of the emulsifier is shown, but not other changes in emulsion composition. All these measurement methods require some preliminary work to create a calibration curve.
The resistance results depend on the metal of the electrodes. We selected 3 emulsions from different manufacturers to investigate how emulsion composition and different metal-cutting procedures influence measurements.
As it is represented in Table 2, the results influenced metal surfaces which can be chemically active- copper (Cu), and chemically inert- aluminum (Al) or aluminum oxide (Al2O3). The processes of electrode-electrolyte surface contact are influenced by the natural properties of the material nature. Steel is a metal popular in dialectical material tests, but common metals are copper and aluminum. Comparing the results measured with different metal electrodes is important. The definition of the electrochemical double layer is essential to understand the measured conductivity or resistivity under DC [75]. The limiting types in this measurement can be electron transfer, reactions when some material produces strong bonding with the electrode surface [76]. Hence, our chosen metals meet all theoretical considerations.
The estimation of errors in resistivity measurement arises because of the type of material applied for electrodes. The choice of electrode is very important in resistivity measurements. Practically, the measurement of contaminated emulsion and clean emulsion by resistance data corresponds to the stage of emulsion decomposition and metal selected for the electrode. Copper and iron are metals that can chemically react with hydroxides, electrolytes, and dissociated liquids. Aluminum has various oxide and hydroxide structures on the surface, but it suffers a decrease in clean surface area because organic compounds in the emulsion are polar and like all the surfactants can form a monolayer on all metals.
Table 2Results of resistance measurement of different metal-cutting liquids using Al and Cu electrodes
Emulsion No and status | Electrode metal Cu, Resistance, MΩ | Electrode metal Al, Resistance, MΩ | Electrode metal Fe, Resistance, MΩ |
1 clean | 0,85±0,2 | 1,5±0,5 | 1,60,9±0,3 |
1 polluted | 1,19±0,5 | 1,1±0,7 | 3.6±0,6 |
2 clean | 0,22±0,1 | 1,1±0,2 | 0,3±0,2 |
2 polluted | 0,44±0,2 | 1,92±0,3 | 0,9±0,6 |
3 clean | 1,07±0,1 | 0,15±0,1 | 1,3±0,55 |
3 polluted | 0,25±0,15 | 2.56±0,06 | 0,7±0,4 |
8. Conclusions
Metal cutting emulsions operate in an environment unfavorable to the structure of metal. Emulsions used for metalworking are the product of a rapidly changing two-phase system, which quality must be monitored as frequently as possible. Temperature and metal cuttings destroy small droplets of emulsion. Substances ensuring emulsion stability have a finite ability to care about the quality of a product. Due to its purpose in the technology of metalworking and the conditions under which emulsions are used, the planned replacement does not always correspond to the approach of economical use of resources. It is very important to notice the time when to replace emulsion and to avoid major losses. The requirement to control the quality of emulsion has solutions like industrial devices, but simple procedures are the preferred solution. In this article, we have presented the development of a sensor for the indirect monitoring of MWFs using a simple multimeter and a few metal electrodes mounted in a vessel for liquid. The measurement is based on resistance measurement between two constant distance and constant area electrodes. A drop of emulsion is sufficient to measure the resistance. The results of our laboratory and lab testing demonstrate that the developed method is capable of accurate and reliable measurements compared to conventional manual methods. As with most research data, to assess the quality of metal cutting emulsion, before the testing in the working place it is necessary to establish the calibration curve for the specific product. We conclude, that by operating metalworking it is possible to qualitatively monitor the condition of emulsion status by industrial devices or by conventional multi-meter with two copper electrodes. Turbidimetric study and resistivity measurements correspond to quadratic polynomial, which consists of an investigation of other emulsions according to results submitted in the ScienceDirect source. The measurements of conductivity, refractive index, pH, and turbidimetric measurements show that the resistance measurement corresponds to the trends of results obtained by other methods and can be applied to monitor the state of the emulsion.
Our study offers a cost-effective and non-intrusive solution for MWF monitoring, eliminating the need for frequent manual sampling and reducing associated production, time, and other costs and environmental impact. Our proposed tests cannot replace testing by accredited labs, but the quality of emulsion quality critical changes can be monitored using additional tools in the workplace to assess the situation. With choosing this additional monitoring, the calibration curve would have to be created for each specific workplace, emulsion quality, and damages caused to the emulsion by the work performed with increasing productivity and efficient use of resources.
Our proposed solution to detect emulsion quality by electrical resistance measurement experienced some challenges. Due to natural processes on metal electrode surfaces, the performance of solution resistivity measurements is complicated by adsorption. Some surface-active compounds will absorb onto a metal surface, so drifting in the results in the first few seconds is inevitable. The advantage of this method is the ability to construct measuring equipment at a metal cutting site without great expense. The standard multimeter, a few metal strips for electrodes, and a small container can be elaborated as the emulsion quality device.
References
-
M. A. El Baradie, “Cutting fluids: Part I. Characterisation,” Journal of Materials Processing Technology, Vol. 56, No. 1-4, pp. 786–797, Jan. 1996, https://doi.org/10.1016/0924-0136(95)01892-1
-
J. Singh, S. S. Gill, M. Dogra, and R. Singh, “A review on cutting fluids used in machining processes,” Engineering Research Express, Vol. 3, No. 1, p. 012002, Mar. 2021, https://doi.org/10.1088/2631-8695/abeca0
-
N. Piche, S. Pollak, and M. Petermann, “Dissolution behavior of different lubricating oils in liquid and supercritical CO2,” The Journal of Supercritical Fluids, Vol. 205, p. 106116, Mar. 2024, https://doi.org/10.1016/j.supflu.2023.106116
-
P. Yan, Y. Rong, and G. Wang, “The effect of cutting fluids applied in the metal cutting process,” Proceedings of the Institution of Mechanical Engineers, Part B: Journal of Engineering Manufacture, Vol. 230, No. 1, pp. 19–37, 2015, https://doi.org/10.1177/095440541559099
-
O. Çakīr, A. Yardimeden, T. Ozben, and E. Kilickap, “Selection of cutting fluids in machining processes,” Journal of Achievements of Materials and Manufacturing Engineering, Vol. 25, No. 2, pp. 99–102, 2007.
-
A. E. Diniz and R. Micaroni, “Influence of the direction and flow rate of the cutting fluid on tool life in turning process of AISI 1045 steel,” International Journal of Machine Tools and Manufacture, Vol. 47, No. 2, pp. 247–254, Feb. 2007, https://doi.org/10.1016/j.ijmachtools.2006.04.003
-
S. Palanisamy, S. D. Mcdonald, and M. S. Dargusch, “Effects of coolant pressure on chip formation while turning Ti6Al4V alloy,” International Journal of Machine Tools and Manufacture, Vol. 49, No. 9, pp. 739–743, Jul. 2009, https://doi.org/10.1016/j.ijmachtools.2009.02.010
-
S. Pervaiz, S. Kannan, and H. A. Kishawy, “An extensive review of the water consumption and cutting fluid based sustainability concerns in the metal cutting sector,” Journal of Cleaner Production, Vol. 197, pp. 134–153, Oct. 2018, https://doi.org/10.1016/j.jclepro.2018.06.190
-
H.-Y. Du et al., “Mesoporous SiO2 nanoparticles with low surface energy and multi-level roughness as shale wellbore stabilizers in oil-based drilling fluid,” Petroleum Science, Vol. 22, No. 1, pp. 384–397, Jan. 2025, https://doi.org/10.1016/j.petsci.2024.12.006
-
A. Clarke, E. Jamie, N. A. Burger, B. Loppinet, and G. Petekidis, “A microstructural investigation of an industrial attractive gel at pressure and temperature,” Soft Matter, Vol. 18, No. 20, pp. 3941–3954, May 2022, https://doi.org/10.1039/d2sm00248e
-
R. A. Irani, R. J. Bauer, and A. Warkentin, “A review of cutting fluid application in the grinding process,” International Journal of Machine Tools and Manufacture, Vol. 45, No. 15, pp. 1696–1705, Dec. 2005, https://doi.org/10.1016/j.ijmachtools.2005.03.006
-
R. R. Moura, M. B. Da Silva, R. Machado, and W. F. Sales, “The effect of application of cutting fluid with solid lubricant in suspension during cutting of Ti-6Al-4V alloy,” Wear, Vol. 332-333, pp. 762–771, May 2015, https://doi.org/10.1016/j.wear.2015.02.051
-
R. Tanaka, A. Hosokawa, T. Furumoto, M. Okada, and T. Ueda, “Influence of cutting fluid on tool edge temperature in end milling titanium alloy,” Journal of Advanced Mechanical Design, Systems, and Manufacturing, Vol. 9, No. 5, Jan. 2015, https://doi.org/10.1299/jamdsm.2015jamdsm0074
-
M. A. Xavior and M. Adithan, “Determining the influence of cutting fluids on tool wear and surface roughness during turning of AISI 304 austenitic stainless steel,” Journal of Materials Processing Technology, Vol. 209, No. 2, pp. 900–909, Jan. 2009, https://doi.org/10.1016/j.jmatprotec.2008.02.068
-
A. Adil et al., “Nanoparticle-based cutting fluids in drilling: a recent review,” The International Journal of Advanced Manufacturing Technology, Vol. 131, No. 5-6, pp. 2247–2264, Feb. 2023, https://doi.org/10.1007/s00170-023-11048-2
-
H. Chen, N. Liu, H. Lu, X. Li, and Y. Zheng, “Evaluation of new nano-cutting fluids for the processing of carbon fiber-reinforced composite materials,” Journal of Cleaner Production, Vol. 437, p. 140771, Jan. 2024, https://doi.org/10.1016/j.jclepro.2024.140771
-
X. Wang et al., “Nanofluids application in machining: a comprehensive review,” The International Journal of Advanced Manufacturing Technology, Vol. 131, No. 5-6, pp. 3113–3164, Jan. 2023, https://doi.org/10.1007/s00170-022-10767-2
-
S. Khatai, A. K. Sahoo, R. Kumar, and A. Panda, “Sustainable hard machining under zirconia nano-cutting fluid: A step towards a green and cleaner manufacturing process,” Measurement, Vol. 242, p. 116087, Jan. 2025, https://doi.org/10.1016/j.measurement.2024.116087
-
B. Kabanov, R. Burstein, and A. Frumkin, “Kinetics of electrode processes on the iron electrode,” Discussions of the Faraday Society, Vol. 1, p. 259, Jan. 1947, https://doi.org/10.1039/df9470100259
-
Y. Villada et al., “Synergistic effect of nanoparticles and viscoelastic surfactants to improve properties of drilling fluids,” Petroleum Science, Vol. 21, No. 6, pp. 4391–4404, Dec. 2024, https://doi.org/10.1016/j.petsci.2024.11.014
-
A. Roushan, S. Biswas, and Chetan, “Emerging sustainable techniques in metal cutting to reduce the application of metalworking fluids: A review,” Proceedings of the Institution of Mechanical Engineers, Part E: Journal of Process Mechanical Engineering, Jun. 2024, https://doi.org/10.1177/09544089241256591
-
V. Deshpande, P. N. Jyothi, H. B. Shivaprasad, V. Gouder, and C. D. Prasad, “Physico-chemical properties of bio-oils as cutting fluids: a comparative investigation,” Journal of Bio – and Tribo-Corrosion, Vol. 11, No. 1, Nov. 2024, https://doi.org/10.1007/s40735-024-00927-0
-
Z. Fang and T. Obikawa, “Influence of cutting fluid flow on tool wear in high-pressure coolant turning using a novel internally cooled insert,” Journal of Manufacturing Processes, Vol. 56, pp. 1114–1125, Aug. 2020, https://doi.org/10.1016/j.jmapro.2020.05.028
-
A. Aggarwal, H. Singh, P. Kumar, and M. Singh, “Optimization of multiple quality characteristics for CNC turning under cryogenic cutting environment using desirability function,” Journal of Materials Processing Technology, Vol. 205, No. 1-3, pp. 42–50, Aug. 2008, https://doi.org/10.1016/j.jmatprotec.2007.11.105
-
G. H. A. Clowes, “On the action exerted by antagonistic electrolytes on the electrical resistance and permeability of emulsion membranes,” Experimental Biology and Medicine, Vol. 15, No. 7, pp. 108–111, Apr. 1918, https://doi.org/10.3181/00379727-15-175
-
M. Abbasi, R. Song, S. Cho, and J. Lee, “Electro-hydrodynamics of emulsion droplets: physical insights to applications,” Micromachines, Vol. 11, No. 10, p. 942, Oct. 2020, https://doi.org/10.3390/mi11100942
-
Y. Zelenko, M. Bezovska, V. Kuznetsov, and A. Muntian, “Technological and ecological aspects of disposal of spent cutting fluids,” Journal of Ecological Engineering, Vol. 22, No. 4, pp. 207–212, Apr. 2021, https://doi.org/10.12911/22998993/134080
-
X. Wu et al., “Circulating purification of cutting fluid: an overview,” The International Journal of Advanced Manufacturing Technology, Vol. 117, No. 9-10, pp. 2565–2600, Aug. 2021, https://doi.org/10.1007/s00170-021-07854-1
-
F. Jurina, J. Peterka, T. Vopat, V. Simna, and M. Kuruc, “System for real time monitoring metalworking fluids,” DAAAM Proceedings, pp. 0758–763, Jan. 2019, https://doi.org/10.2507/30th.daaam.proceedings.104
-
S. Debnath, M. M. Reddy, and Q. S. Yi, “Environmental friendly cutting fluids and cooling techniques in machining: a review,” Journal of Cleaner Production, Vol. 83, pp. 33–47, Nov. 2014, https://doi.org/10.1016/j.jclepro.2014.07.071
-
S. Ravi, P. Gurusamy, and V. Mohanavel, “A review and assessment of effect of cutting fluids,” Materials Today: Proceedings, Vol. 37, pp. 220–222, Jan. 2021, https://doi.org/10.1016/j.matpr.2020.05.054
-
A. Rave and S. Joksch, “Monitoring metalworking fluids,” Metalworking Fluids (MWFs) for Cutting and Grinding, pp. 317–337, Jan. 2012, https://doi.org/10.1533/9780857095305.317
-
A. I. Nita et al., “Key parameters to monitor the used metalworking fluids,” UPB Scientific Bulletin, Series B: Chemistry and Materials Science, Vol. 83, No. 4, pp. 29–42, 2021.
-
J. John, A. Panahi, D. Pu, and G. Natale, “Progress in rheology of active colloidal systems,” Current Opinion in Colloid and Interface Science, Vol. 75, p. 101886, Feb. 2025, https://doi.org/10.1016/j.cocis.2024.101886
-
H. Krämer, “Electrostatic charging of poorly conductive liquid systems – suspensions, emulsions and solutions – by agitating,” Journal of Electrostatics, Vol. 10, pp. 89–97, May 1981, https://doi.org/10.1016/0304-3886(81)90027-9
-
S. V. Verbich, S. S. Dukhin, A. Tarovski, Holt, Saether, and J. Sjo¨Blom, “Evaluation of stability ratio in oil-in-water emulsions,” Colloids and Surfaces A: Physicochemical and Engineering Aspects, Vol. 123-124, pp. 209–223, May 1997, https://doi.org/10.1016/s0927-7757(96)03939-8
-
G. Chen and D. Tao, “An experimental study of stability of oil-water emulsion,” Fuel Processing Technology, Vol. 86, No. 5, pp. 499–508, Feb. 2005, https://doi.org/10.1016/j.fuproc.2004.03.010
-
E. Dickinson, “Emulsion stability,” Food Hydrocolloids, pp. 387–398, Jan. 1994, https://doi.org/10.1007/978-1-4615-2486-1_61
-
K. van Netten, R. Moreno-Atanasio, and K. P. Galvin, “Selective agglomeration of fine coal using a water-in-oil emulsion,” Chemical Engineering Research and Design, Vol. 110, pp. 54–61, Jun. 2016, https://doi.org/10.1016/j.cherd.2016.02.029
-
A. J. M. Yang, P. D. Fleming, and J. H. Gibbs, “Molecular theory of surface tension,” The Journal of Chemical Physics, Vol. 64, No. 9, pp. 3732–3747, May 1976, https://doi.org/10.1063/1.432687
-
D. E. Packham, “Surface energy, surface topography and adhesion,” International Journal of Adhesion and Adhesives, Vol. 23, No. 6, pp. 437–448, Jan. 2003, https://doi.org/10.1016/s0143-7496(03)00068-x
-
Verwey and E. J. W., “Theory of the stability of lyophobic colloids,” The Journal of Physical and Colloid Chemistry, Vol. 51, No. 3, pp. 631–636, May 2002, https://doi.org/10.1021/j150453a001
-
L. Cipelletti, R. Klein, and E. Zaccarelli, “Interacting colloidal systems, gels, glasses,” Neutrons, X-rays, and Light, pp. 361–400, Jan. 2025, https://doi.org/10.1016/b978-0-443-29116-6.00001-1
-
N. B. Webb, F. J. Ivey, H. B. Craig, V. A. Jones, and R. J. Monroe, “The measurement of emulsifying capacity by electrical resistance,” Journal of Food Science, Vol. 35, No. 4, pp. 501–504, Aug. 2006, https://doi.org/10.1111/j.1365-2621.1970.tb00969.x
-
R. Li, Z. Leng, Y. Wang, and F. Zou, “Characterization and correlation analysis of mechanical properties and electrical resistance of asphalt emulsion cold-mix asphalt,” Construction and Building Materials, Vol. 263, p. 119974, Dec. 2020, https://doi.org/10.1016/j.conbuildmat.2020.119974
-
L. V. Trykoz, I. V. Bagiyanc, and V. Nykytynskyj, “Investigation into the impact of bitumen emulsion upon the electrical resistance of the cement and sand grout,” International Journal of Engineering Research in Africa, Vol. 29, pp. 98–103, Mar. 2017, https://doi.org/10.4028/www.scientific.net/jera.29.98
-
S. J. Lee, J. Y. Kang, W. Choi, and R. Kwak, “Simultaneous electric production and sizing of emulsion droplets in microfluidics,” Soft Matter, Vol. 16, No. 3, pp. 614–622, Jan. 2020, https://doi.org/10.1039/c9sm01426h
-
H. N. Singh, S. Swarup, R. P. Singh, and S. M. Saleem, “Structural description of water‐in‐oil microemulsions using electrical resistance,” Berichte der Bunsengesellschaft für physikalische Chemie, Vol. 87, No. 12, pp. 1115–1120, May 2010, https://doi.org/10.1002/bbpc.19830871208
-
M. C. Vlachou, K. A. Zacharias, M. Kostoglou, and T. D. Karapantsios, “Droplet size distributions derived from evolution of oil fraction during phase separation of oil-in-water emulsions tracked by electrical impedance spectroscopy,” Colloids and Surfaces A: Physicochemical and Engineering Aspects, Vol. 586, p. 124292, Feb. 2020, https://doi.org/10.1016/j.colsurfa.2019.124292
-
F. Gardner Cottrell, J. Buckner Speed, O. Berkeley, C. Fornia, and B. Mesne Assignments, “Separating and collecting particles of one liquid suspended in another liquid.,” United States Patent Office, 1910.
-
G. Taylor, “Studies in electrohydrodynamics. I. The circulation produced in a drop by an electric field,” Proceedings of the Royal Society of London. Series A. Mathematical and Physical Sciences, Vol. 291, No. 1425, pp. 159–166, Apr. 1966, https://doi.org/10.1098/rspa.1966.0086
-
E. K. Zholkovskij, J. H. Masliyah, and J. Czarnecki, “An electrokinetic model of drop deformation in an electric field,” Journal of Fluid Mechanics, Vol. 472, pp. 1–27, Dec. 2002, https://doi.org/10.1017/s0022112002001441
-
J. S. Eow and M. Ghadiri, “Electrostatic enhancement of coalescence of water droplets in oil: a review of the technology,” Chemical Engineering Journal, Vol. 85, No. 2-3, pp. 357–368, Jan. 2002, https://doi.org/10.1016/s1385-8947(01)00250-9
-
F. W. S. Lucas, N. C. Ramos, D. K. Schwartz, J. W. Medlin, and A. Holewinski, “Understanding reactivity of self-assembled monolayer-coated electrodes: SAM-induced surface reconstruction,” Electrochimica Acta, Vol. 459, p. 142586, Aug. 2023, https://doi.org/10.1016/j.electacta.2023.142586
-
P. Delahay and I. Trachtenberg, “Adsorption kinetics and electrode processes,” Analytica Chimica Acta, Vol. 18, pp. 69–71, Jan. 1958, https://doi.org/10.1016/s0003-2670(00)87104-4
-
M. A., “Thermodynamics approach in the adsorption of heavy metals,” in Thermodynamics – Interaction Studies – Solids, Liquids and Gases, InTech, 2011, https://doi.org/10.5772/21326
-
Q. Li et al., “Removal of organic compounds by nanoscale zero-valent iron and its composites,” Science of The Total Environment, Vol. 792, p. 148546, Oct. 2021, https://doi.org/10.1016/j.scitotenv.2021.148546
-
Z. Raji, A. Karim, A. Karam, and S. Khalloufi, “Adsorption of heavy metals: mechanisms, kinetics, and applications of various adsorbents in wastewater remediation-a review,” Waste, Vol. 1, No. 3, pp. 775–805, Sep. 2023, https://doi.org/10.3390/waste1030046
-
A. R. Miedema and J. W. F. Dorleijn, “Quantitative predictions of the heat of adsorption of metals on metallic substrates,” Surface Science, Vol. 95, No. 2-3, pp. 447–464, May 1980, https://doi.org/10.1016/0039-6028(80)90189-2
-
Y. Men, H. Gnaser, and C. Ziegler, “Adsorption/desorption studies on nanocrystalline alumina surfaces,” Analytical and Bioanalytical Chemistry, Vol. 375, No. 7, pp. 912–916, Mar. 2003, https://doi.org/10.1007/s00216-003-1760-1
-
N. A. Gjostein, “Adsorption and surface energy (I): The effect of adsorption on the γ-plot,” Acta Metallurgica, Vol. 11, No. 8, pp. 957–967, Aug. 1963, https://doi.org/10.1016/0001-6160(63)90065-8
-
M. Jarzębski et al., “Characterization of hemp seed oil emulsion stabilized by soap nuts (Sapindus mukorossi) extract,” Food Hydrocolloids, Vol. 156, p. 110352, Nov. 2024, https://doi.org/10.1016/j.foodhyd.2024.110352
-
D. J. Hibberd, A. R. Mackie, G. K. Moates, R. Penfold, A. D. Watson, and G. C. Barker, “Preparation and characterisation of a novel buoyancy and refractive index matched oil-in-water emulsion,” Colloids and Surfaces A: Physicochemical and Engineering Aspects, Vol. 301, No. 1-3, pp. 453–461, Jul. 2007, https://doi.org/10.1016/j.colsurfa.2007.01.023
-
H. Barkan-Öztürk, A. Menner, and A. Bismarck, “Emulsion-templated macroporous polymer micromixers,” Industrial and Engineering Chemistry Research, Vol. 60, No. 39, pp. 14013–14025, Oct. 2021, https://doi.org/10.1021/acs.iecr.1c01949
-
C. Assenhaimer, A. S. Domingos, B. Glasse, U. Fritsching, and R. Guardani, “Long‐term monitoring of metalworking fluid emulsion aging using a spectroscopic sensor,” The Canadian Journal of Chemical Engineering, Vol. 95, No. 12, pp. 2341–2349, Aug. 2017, https://doi.org/10.1002/cjce.22931
-
M. K. Lonon, M. Abanto, and R. H. Findlay, “A pilot study for monitoring changes in the microbiological component of metalworking fluids as a function of time and use in the system,” American Industrial Hygiene Association Journal, Vol. 60, No. 4, pp. 480–485, Jul. 1999, https://doi.org/10.1080/00028899908984468
-
Y. P. Zhao, R. Turay, and L. Hundley, “Monitoring and predicting emulsion stability of metalworking fluids by salt titration and laser light scattering method,” Tribology Transactions, Vol. 49, No. 1, pp. 117–123, Apr. 2006, https://doi.org/10.1080/05698190500526939
-
R. Galvao, M. Araujo, G. Jose, M. Pontes, E. Silva, and T. Saldanha, “A method for calibration and validation subset partitioning,” Talanta, Vol. 67, No. 4, pp. 736–740, Oct. 2005, https://doi.org/10.1016/j.talanta.2005.03.025
-
C. R. James, J. A. Herman, J. S. Dufek, and B. T. Bates, “Number of trials necessary to achieve performance stability of selected ground reaction force variables during landing,” Journal of Sports Science and Medicine, Vol. 6, pp. 126–134, 2007.
-
N. S. Doan, H. Mac, and H.-B. Dinh, “An optimization-based method of calibrating load and resistance factors: Application to slope and breakwaters’ foundation stability,” Ocean Engineering, Vol. 313, p. 119409, Dec. 2024, https://doi.org/10.1016/j.oceaneng.2024.119409
-
M. Cocheteux, J. Moreau, and F. Davoine, “Uncertainty-aware online extrinsic calibration: a conformal prediction approach,” in IEEE/CVF Winter Conference on Applications of Computer Vision (WACV), pp. 6167–6176, Feb. 2025, https://doi.org/10.1109/wacv61041.2025.00601
-
N. Seyedrazi, S. H. Razavi, and Z. Emam-Djomeh, “Effect of different pH on canthaxanthin degradation,” International Journal of Nutrition and Food Engineering, Vol. 5, No. 11, pp. 653–657, 2011.
-
S. Ghaderi, M. A. Hesarinejad, E. Shekarforoush, S. M. Mirzababaee, and F. Karimpour, “Effects of high hydrostatic pressure on the rheological properties and foams/emulsions stability of Alyssum homolocarpum seed gum,” Food Science and Nutrition, Vol. 8, No. 10, pp. 5571–5579, Sep. 2020, https://doi.org/10.1002/fsn3.1834
-
P. Isambourg, B. T. Anfinsen, and C. Marken, “Volumetric behavior of drilling muds at high pressure and high temperature,” in European Petroleum Conference, 1996, https://doi.org/10.2118/36830-ms
-
F. Vahidi, S. Tenbohlen, M. Rosner, C. Perrier, and H. Fink, “Influence of electrode material on conductivity measurements under DC stresses,” in IEEE 18th International Conference on Dielectric Liquids (ICDL), Jun. 2014, https://doi.org/10.1109/icdl.2014.6893133
-
C. Jiang, L. Zheng, and Y. Liu, “Aligned carbon nanotube films for immobilization of glucose oxidase and its application in glucose biosensor,” Australian Journal of Chemistry, Vol. 75, No. 2, pp. 89–93, Jun. 2021, https://doi.org/10.1071/ch21075
About this article

The authors have not disclosed any funding.
The datasets generated during and/or analyzed during the current study are available from the corresponding author on reasonable request.
Anna Kim: conceptualization, validation, funding acquisition. Jūratė Jolanta Petronienė: software, investigation, writing-original draft preparation, visualization. Andrius Dzedzickis: methodology, validation, data curation, writing-review and editing. Vytautas Bučinskas; conceptualization, formal analysis, resources, writing-review and editing, supervision.
The authors declare that they have no conflict of interest.
