Abstract
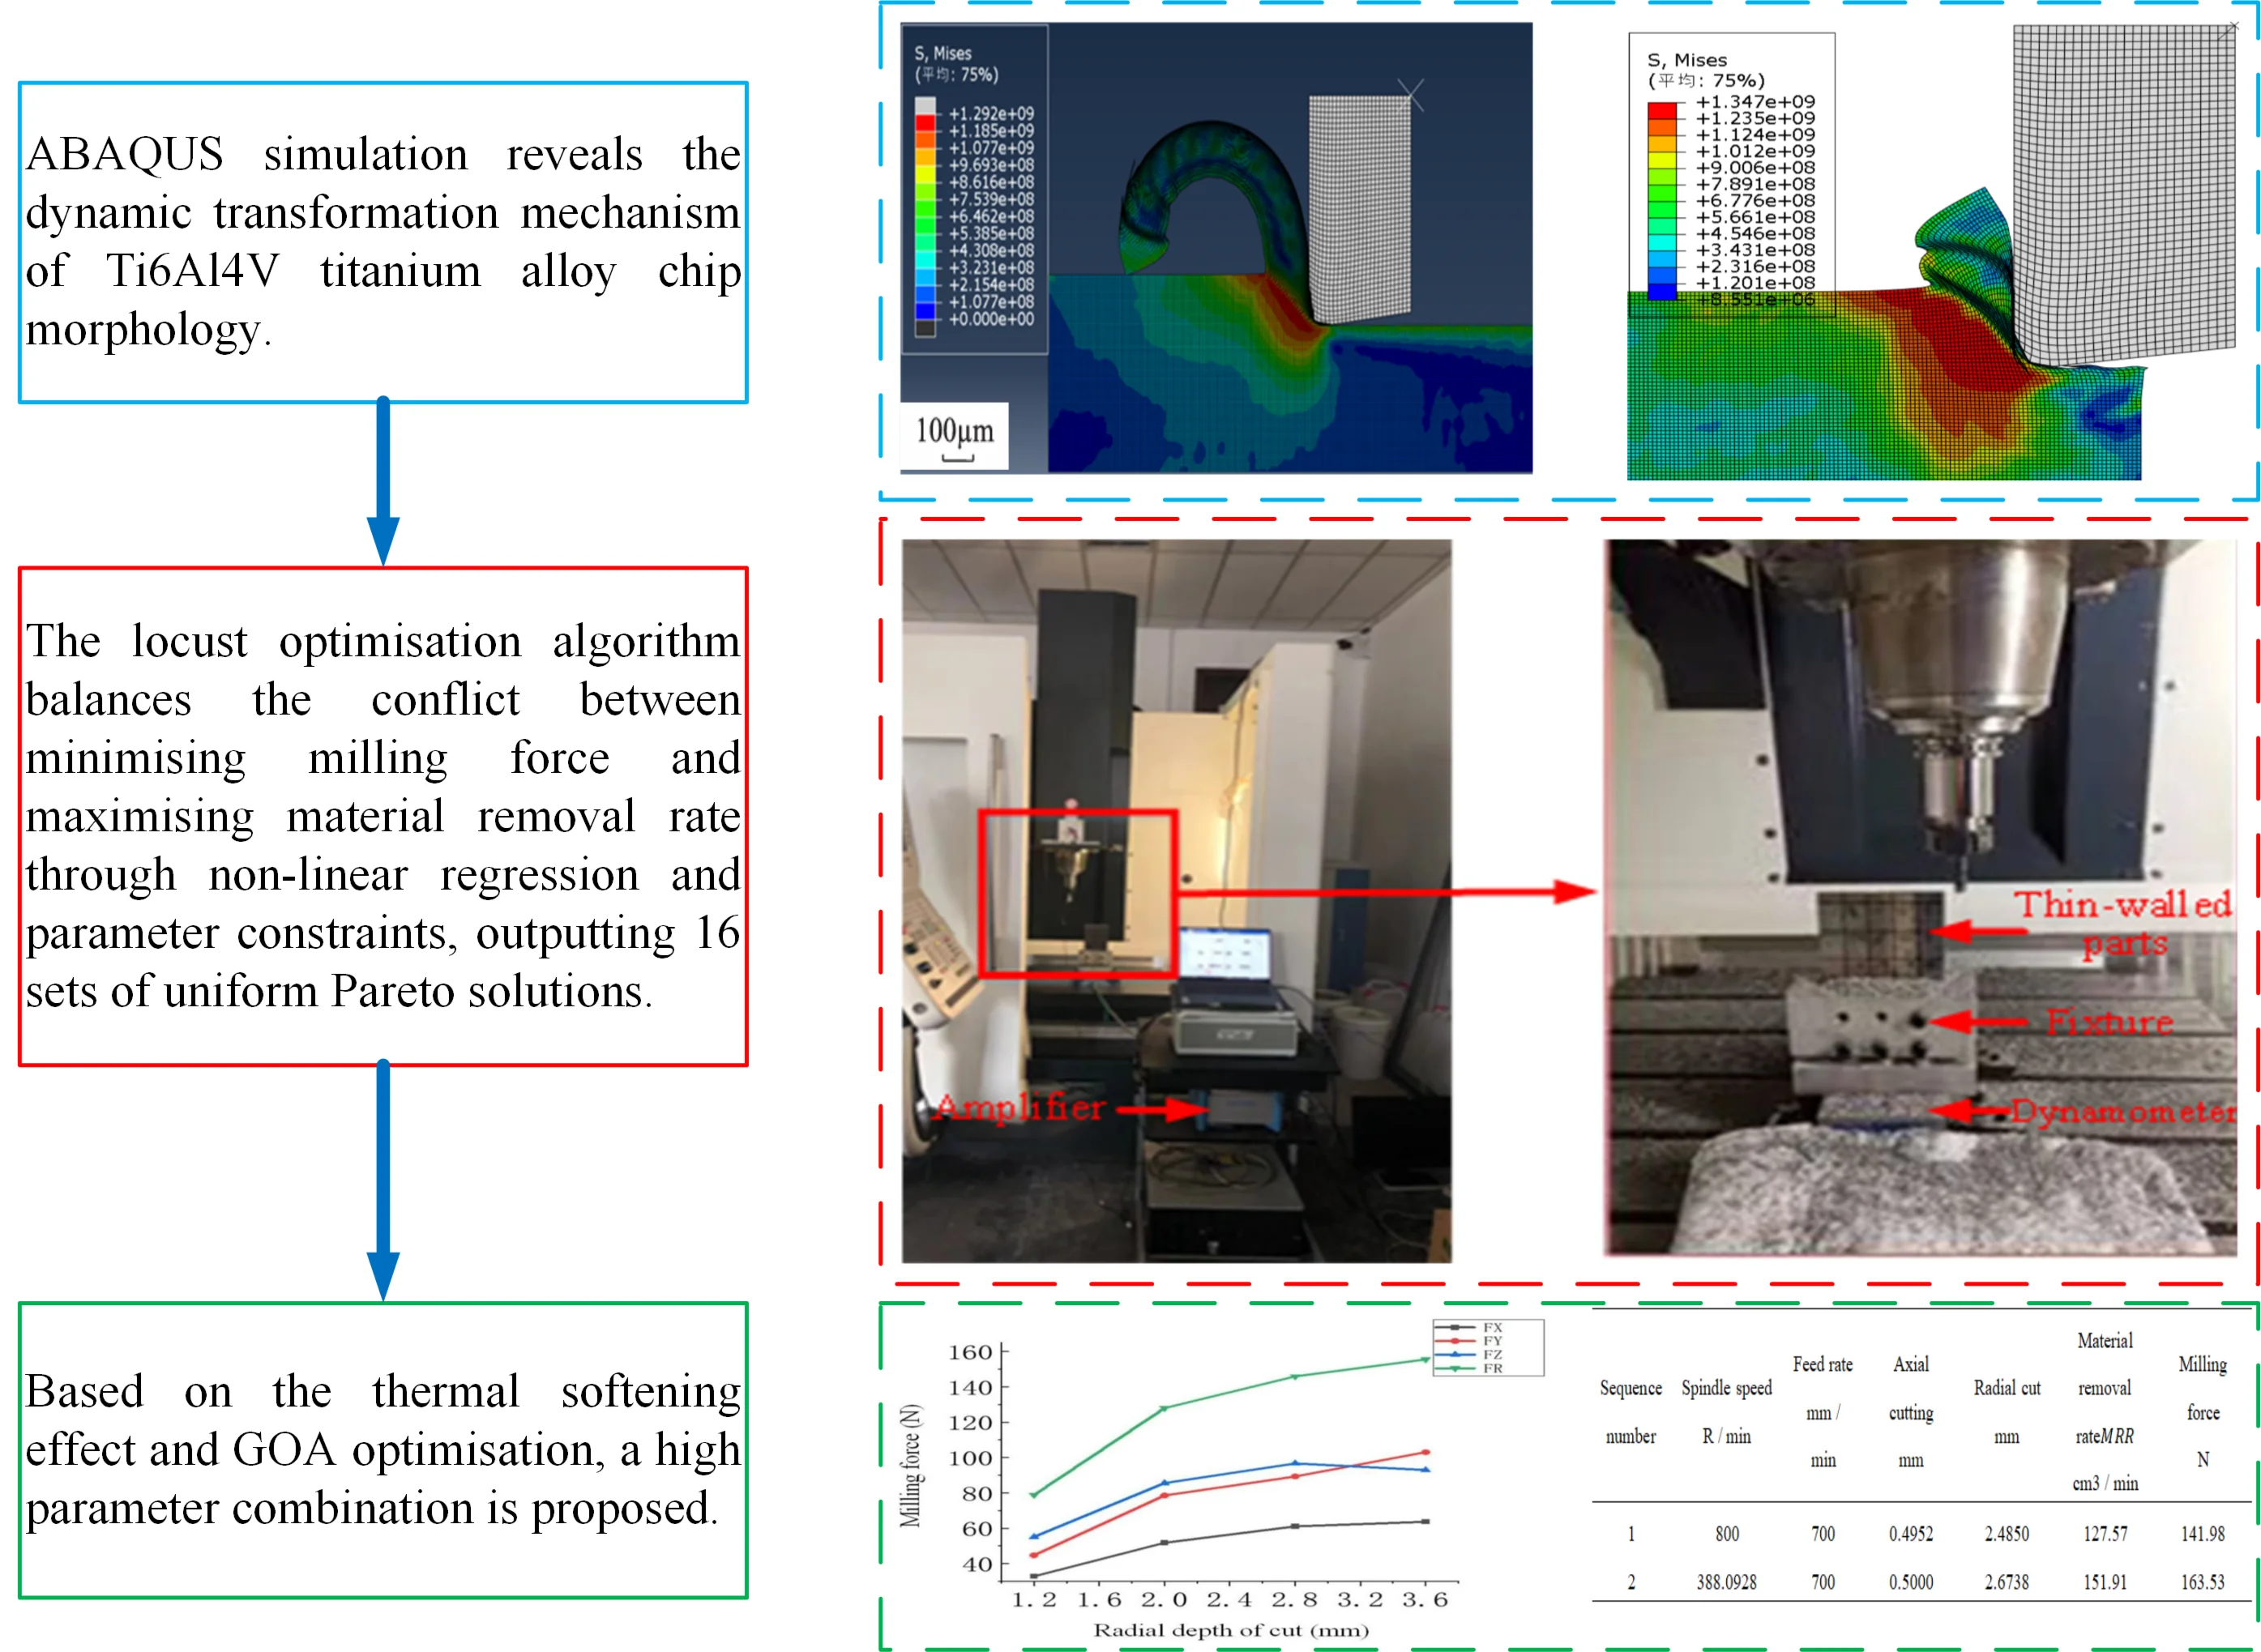
High-speed cutting of titanium alloy has the advantages of high processing efficiency, reducing tool wear, and obtaining good surface quality, but there is a lack of research on the influence of chip shape on machining parameter selection mechanism in the cutting process, which hinders the development of high-speed milling quality of titanium alloy. In this paper, the shape of titanium alloy (Ti6Al4V) chips at different speeds and different temperatures were simulated. With the increase of cutting speed, the tool squeezes the workpiece material, causing it to undergo elastic deformation and thereby forming a cutting layer. As the cutting process progresses, the chip gradually takes on a serrated shape, the degree of sawtooth sharpening of chips was analyzed. The formation mechanism of chips and the formation process of sawtooth chips during right-angle cutting were analyzed. The locust optimization algorithm was used to optimize the multi-objective parameters, and it was found that high performance machining effect could be achieved by using large feed speed, radial cutting depth and spindle speed.
Highlights
- ABAQUS reveals Ti6Al4V chip dynamics: Cutting speed drives thermal softening vs. strain hardening. 0.5m/s: hardening forms ribbon chips; 7.5m/s: softening causes shear instability/high-serration chips.
- Introducing Locust Optimization (LOA) to solve titanium milling's dual-goal conflict. LOA beats genetic/particle swarm methods in search balance. Using regression and constraints, yields 16 Pareto solutions. Validated by 7.65-11.3% force errors—efficient for production decisions.
- Novel titanium strategy: High feed, large radial cut, high spindle MRR. High-speed thermal softening reduces material strength, enabling larger cuts while GOA balances force increases. Validated via orthogonal tests (Kistler9257B), providing production-ready solution.
1. Introduction
With the rapid development of computer technology, the finite-element numerical simulation method has gained growing popularity in the research on the cutting – process mechanisms of titanium alloys and other metals. This method enables the analysis of various aspects, including chip formation, tool behavior, and the distribution of temperature fields, stress fields, strains, and strain rates within the workpiece. Through subsequent calculation and analysis, optimal processing parameter designs can be obtained. This not only helps reduce costs in the actual machining process but also optimizes machining designs and processes.
A novel approach for machining parameter optimization is presented through the integration of the cutting process with finite element analysis. Laakso et al. [1] used the finite element simulation method to estimate the influence of the subsequent cutting process on the performance of the cutting model, and found the error of the feed force. Li et al. [2] studied the chip formation mechanism of high-temperature nickel alloy Inconel 718 in the cutting process by combining design milling experiment and finite element simulation, established a two-dimensional cutting model based on J-C constitutive model [3], and found that the cutting force and chip morphology generated by finite element simulation were basically consistent with the experiment. Walid Jomaa et al. [4] used Abaqus/Explicit v6.13 software to simulate AA7075-T651 alloy with two-dimensional finite element processing. By using finite element numerical data and chip sawtooth analysis model, the physical phenomenon controlling sawtooth chip formation was emphasized and discussed in depth.Rodriguez Prieto et al. [5] conducted an investigation on the cutting of Ti6Al4V. They modified the Lagrangian finite - element method by basing it on the particle finite-element method and continuous Delaunay re-triangulation. Arrazola et al. [6] established a two-dimensional finite-element model by employing the arbitrary Lagrange-Euler formula available in Abaqus/Explicit (v6.8). They discovered that thermal conductivity, specific heat, inelastic percentage, and the Johnson-Cook (J-C) constitutive coefficients have significant impacts on the formation of saw-tooth chips. In particular, thermal conductivity and specific heat exert the most substantial influence. In addition, it is found that the yield stress of the material itself has a significant effect on the generation of sawtooth chips. Huang et al. [7] proposed a new Galerkin grid-free method when studying the chip separation process in the machining process, and proved that the formation of shear bands was caused by the thermal softening of materials.
Sima et al. [8] explored the influence of a modified material model, which was based on temperature-dependent flow softening, on the formation of saw-tooth chips during the machining of Ti-6Al-4V titanium alloy. The research revealed that the flow-softening phenomenon, strain-hardening effect, and thermal-softening effect are all interrelated. Fu et al. [9] studied the chip morphology changes of 7050-T7451 aluminum alloy at different cutting speeds by using the finite element simulation method, and found that continuous chips were more easily formed when the cutting speed was lower than 1500 m/min, and when the critical cutting speed was reached (2500 m/min), the ribbon chips were transformed into sawn-shaped chips. Rhim et al. [10] studied the flow stress model based on the assumption of high speed, high temperature and large deformation process to predict the formation of sawtooth chips during cutting. The finite element analysis shows that the dynamic recrystallization will be induced by the increase of shear zone temperature during the cutting process, the flow stress will be reduced, and the adiabatic shear zone and sawtooth chip will be formed.
In complex processing, due to numerous influencing factors, it is not easy to establish a theoretical model, while the data-driven model that relies on test data is relatively easy to obtain, and there is no need to analyze the construction mechanism of the objective function. Data modeling is an important means to optimize machine tool efficiency and processing efficiency, and commonly used methods include response surface method [11], inverse propagation neural network (BPNN) [12], support vector regression and progressive gradient regression tree. Response surface method [13] reveals the correlation between decision variables and target variables by constructing a quadratic polynomial model. However, when there are items with insignificant influence, it is necessary to artificially eliminate them to improve the prediction accuracy, which may be time-consuming and difficult to obtain the best results. In contrast, the other three methods can improve the accuracy of the model by adjusting the internal parameters, especially for nonlinear data. When selecting the data modeling method, it is necessary to consider the complexity of the model, the difficulty of parameter adjustment and the fitting ability of nonlinear data according to the specific situation, so as to achieve the best modeling effect. Yunchao Tang et al. [14] trained a Support Vector Regression (SVR) model using data from 120 sets of UCS and peak strain experiments, constructing a multi-objective optimization model based on SVR. They successfully generated a Pareto front for mixed optimization design across three objectives (UCS, strain, cost), serving as a decision reference under different temperature conditions. Shuai Wan et al. [15] proposed an ultrasonic-AI hybrid method, enhancing the Extreme Gradient Boosting (XGBoost) model through over-sampling and hyperparameter optimization via Bayesian Optimization (BO-XGBoost). The BO-XGBoost model demonstrated outstanding performance, with an overall prediction accuracy of 0.92, an accuracy and recall rate of 0.90, and an AUC of 0.98.
In addition, the selection of optimization targets is also very important. Tamal Ghosh et al. [16] uses Bayesian regularization neural network and beetle antenna search algorithm for process optimization. By applying Kohonen’s self-organization diagram, the relationship between different processing parameters is explored. After conducting a comparative analysis of the proposed agent-assisted optimization method with three other optimization techniques, it was found that the former demonstrated remarkable efficiency and rapidity in handling offline processing data. The findings of this study clearly indicate that the agent-assisted optimization method achieved success in the optimization process and exhibited significant advantages over its counterparts.
Previous studies have mostly focused on the formation of chip material or analysis of machining parameters, lacking innovation in the application of parameter optimization algorithms. This study makes breakthroughs in three aspects: First, addressing the issue of unclear mechanisms for selecting machining parameters influenced by chip morphology during high-speed cutting of titanium alloys, we systematically simulated Ti6Al4V chip morphology under different speeds and temperatures, conducting an in-depth analysis of the formation processes and mechanisms of straight-cut and serrated chips, filling a research gap in this field; Second, innovatively employing the ant colony optimization algorithm for multi-objective parameter optimization, which offers significant advantages over traditional genetic algorithms and particle swarm optimization in balancing global and local search, flexibility in parameter adjustment, and structural innovation, proposing high-performance machining through high feed rates, radial cutting depth, and spindle speed, providing new insights for parameter selection; Third, deeply integrating the cutting process with finite element analysis to form a novel method for optimizing machining parameters, offering more scientific and systematic solutions to improve the quality of high-speed milling of titanium alloys, promoting the development of titanium alloy machining technology.
In this paper, ABAQUS software based on ALE Arbitrary Lagrangian Eulerian is used. The method combines the advantages of Lagrangian and Eulerian algorithm [17], and can be used to simulate large deformation and steady deformation path of materials. The problems of mesh redivision and cutting separation are solved. Nevertheless, we still need to face the challenges of optimization of titanium alloy machining parameters, especially in the field of multi-objective optimization. In order to overcome these problems, we are committed to building a cutting parameter optimization model and method for titanium alloy milling, and combining it with the process database.
2. Finite element simulation research based on ABAQUS
This study utilized ABAQUS finite element simulation analysis software to establish a simulation model. By systematically varying the cutting parameters and analyzing the relevant variables, the model employed a modified Johnson-Cook nonlinear thermovisco-plastic constitutive model, a shear failure chip fracture criterion, and a bond slip mixed friction model. These enabled the acquisition of chip morphologies at different cutting speeds.
2.1. Research on chip morphology at different cutting speeds
1) In order to study the shape of chips at different cutting speeds, the initial temperature of the tool is set at 20 ℃, the ambient temperature is 20 ℃, and the cutting depth is 0.1 mm. The tool material is assumed to be rigid body, sharp and have no tool wear, and its model is 4.61 mm long, 2.56 mm wide, front corner 0 and rear corner 10. The workpiece model is 15 mm long and 8 mm wide.
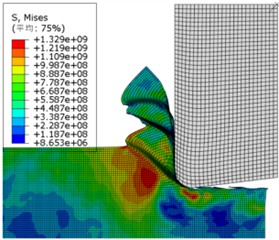
In the high speed machining of titanium alloy chips, the chip type changes with the processing speed, and its conversion mechanism is mainly affected by the interaction of strain hardening and thermal softening. The stress distribution is shown in the figure below. From the chip morphology in Fig. 1, it can be seen that a continuous ribbon chip is obtained at a low processing speed of 0.5 m/s. At this time, the heat generated in the cutting process is relatively small, and the strain hardening effect of the material occupies the dominant position, which can resist the deformation caused by the cutting, so that the chip can be formed continuously and maintain the belt shape. When the cutting rate increases to 1.5 m/s, the generated chips gradually have a sawtooth shape, and the left half has an uneven wavy profile, but the sawtooth shape is not significant at this time, and it should be a transitional form of banded chips and sawtooth chips. At this time, there is no abrupt transition to shear instability because the strain-hardening effect prevails over the heat-softening effect. When the cutting speed was increased to 2.0 m/s, a saw-tooth chip segment formed with a significant saw-tooth degree, yet no characteristics of adiabatic shear bands were observed. The antagonism between strain hardening effect and thermal softening effect makes the chip present a more regular sawtooth shape. When the cutting speed is increased to 7.5 m/s, a relatively regular sawtooth chip has been formed, the degree of sawtooth has been very high, sudden shear instability appears, and an obvious adiabatic shear zone has been formed. This is because at this time, the cutting speed is greatly increased, and a large amount of heat is generated in the cutting area. The thermal softening effect exceeds the strain hardening effect, and the material is rapidly softened locally, resulting in shear instability and forming an adiabatic shear band, and the chip presents a typical sawtooth shape.
Fig. 1Chip morphology stress (N) cloud diagram at different speeds (m/s)
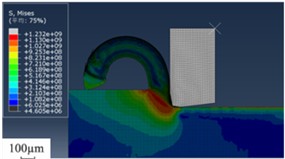
a)0.5 m/s
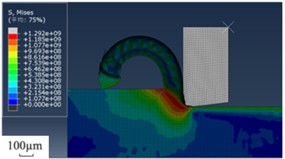
b)1.0 m/s
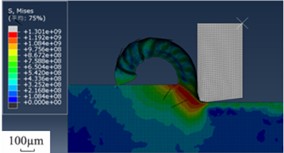
c)1.5 m/s
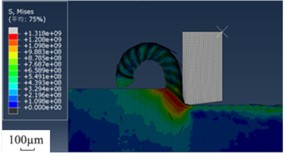
d)2.0 m/s
e)7.5 m/s
f)12.5 m/s
2) The specific formation process of sawtooth nodal block at the same speed.
In this model, the joint temperature, stress field, equivalent plastic strain and milling force of titanium alloy during sawing process were simulated by using the finite element numerical analysis method. As shown in Fig. 2-3, the zigzag chip break is clearly shown, and the selected tool front Angle is 0° and the cutting speed is 7.5 m/s.
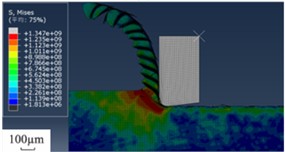
As shown in Fig. 2, the chip layer material connected to the previous segment of sawtooth chips has an uneven temperature distribution, and there is a significant temperature rise at the cutting edge of the tool. This is mainly because the heat dissipation of the cutting layer is the worst closest to the cutting edge of the tool, and the shear-sliding from the previous step affects a limited area of the chip. Due to the rolling action of the tool and the increase in temperature, the material near the cutting-edge area undergoes high-degree shear-sliding deformation. Finally, due to the extrusion of the tool with the resulting chips, as shown in Fig. 2(b), the Mises stress generated at this time was large and extended to the inside of the workpiece, which had an impact on the surface quality of the workpiece.
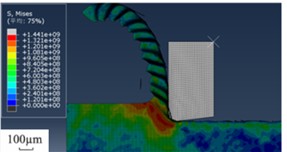
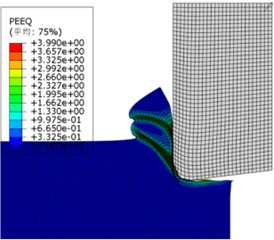
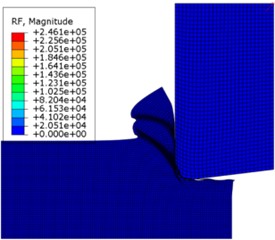
As shown in Fig. 3, during the cutting process of titanium alloy simulated by finite element simulation, due to the metal material being located in a critical thermoplastic instability condition, strong shear slip was generated in the entire shear slip narrow band, resulting in a zigzag shape at the top of the chip. Correspondingly, the temperature in the central region of the narrow deformation band continued to rise, and all the metals in the narrow band showed thermoplastic instability, up to 4.05, and the Mises stress decreased, as shown in Fig. 3(b). With the continuous cutting process, the sawtooth deposit body continues to undergo concentrated shear-slip deformation, and the sawtooth structure on the top of the sawtooth deposit body will also increase, and finally form a sawtooth deposit body.
Fig. 2The third section serrated chip formation began to form
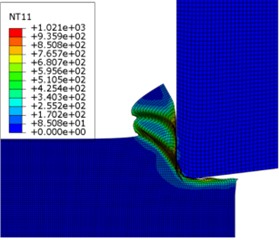
a) Node temperature distribution cloud map
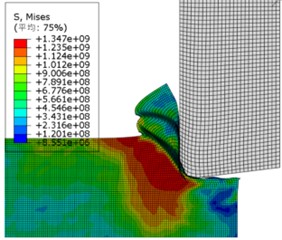
b) Stress distribution cloud map
c) Equivalent plastic strain distribution cloud map
d) Cutting force distribution cloud map
Based on the analysis, the force applied by the tool to the workpiece, which is closely related to the formation mechanism of saw-tooth chips, is the primary factor leading to the elastic deformation of the workpiece and the cutting layer. In detail, during the cutting operation, the material at the tool tip experiences plastic deformation as a result of the synergistic influences of temperature, stress, strain, and other relevant factors.
A substantial amount of heat is generated during the cutting process due to the plastic deformation of the material and frictional work, which leads to the thermal softening of the material. During the shearing process, the reduction in shear stress caused by thermal softening is greater than the increase in stress resulting from machining-induced strengthening, which leads to the generation of shear fold and the first deformation zone is formed quickly in the cutting layer. In this process, chips begin to slide and accumulate on the processed material, finally forming a zigzag chip. Finally, a new “zigzag” chip breaking mechanism is obtained under the cutting process.
2.2. ABAQUS 3D milling simulation
The finite element model of 3D milling is shown in Fig. 4. A YG6X flat-head end mill is selected with 4 blade numbers, 45° spiral Angle, 7° front edge Angle, 15° back edge Angle, and 5 diameter. The workpiece material is Ti6Al4V. The axial cutting depth is 3 mm and the radial cutting depth is 4.5 mm. The initial temperature is 30 ℃, the bottom surface of the workpiece is constrained by 6 degrees of freedom, and the rigid constraint of the milling cutter is set as a reference point. Subsequently, the degrees of freedom of rotation and movement are applied to the reference point to establish a dynamic thermodynamic coupling analysis step. Finally, ABAQUS/Explicit solver is used for calculation.
Fig. 3The third serrated chip shear slip occurs and completely formed
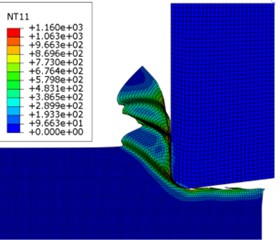
a) Node temperature distribution cloud map
b) Stress distribution cloud map
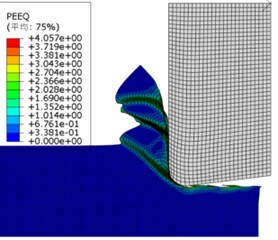
c) Equivalent plastic strain distribution cloud map
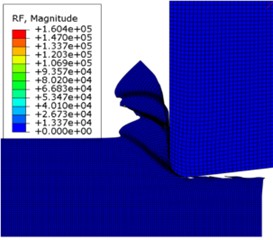
d) Cutting force distribution cloud map
In the process of 3D milling, when the temperature change of a certain point of the workpiece is wanted to be studied, the temperature change of points under the same coordinate and different coordinate can be selected as shown in Fig. 4(b), and the distance between the unit node and the machining surface can be 0 mm, 0.7 mm, 1.4 mm and 2.1 mm respectively. The temperature measurement points we selected can cover different depth levels: points at distances of 0 mm, 0.7 mm, 1.4 mm and 2.1 mm from the machining surface. These points at different distances span from the machining surface to various depths within the workpiece, allowing for a comprehensive examination of the heat conduction and distribution of milling thermal effects in the thickness direction of the workpiece. The machining surface (0 mm) directly participates in the cutting process, with intense temperature changes; as the distance increases, the temperature decay and variation characteristics during heat conduction into the workpiece can be observed. Additionally, temperature responses can be compared: by outputting and plotting the temperature changes at these different depth points, it is clear that as the normal distance (distance from the machining surface) increases, the peak temperature of the measurement point decreases and the time to reach the peak temperature becomes longer, indicating a temperature response lag. This comparison provides effective data support for understanding the propagation mechanism of milling thermal effects within the workpiece and the thermal influence range, thereby providing a basis for optimizing milling process parameters and controlling thermal deformation of the workpiece.
Fig. 5 shows the output and simultaneous plotting of the temperature variations of the four cell nodes. As the normal range increases, the peak temperature at the measuring point decreases. Meanwhile, it takes each measuring point a longer time to reach the peak temperature. In other words, the temperature response of the measuring point lags to some extent as the normal stroke increases.
Fig. 43D milling model
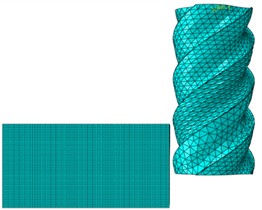
a) Three-dimensional milling model
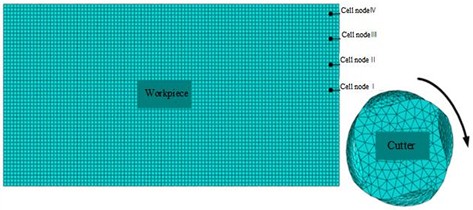
b) Schematic diagram of unit node selection
Fig. 5The change of element node temperature with time
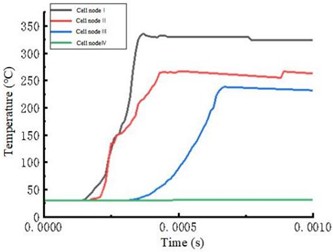
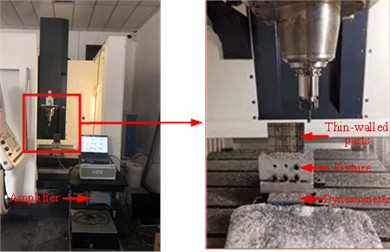
Fig. 6Experimental platform
As the position of the unit node moves down, the temperature of the area between the adjacent sawtooth is getting higher and higher, and the edge of the sawtooth shows the characteristics of melting metal, at the same time, in the case of no change in heat dissipation capacity, the cutting heat per unit time is increased, thereby increasing the cutting temperature, and then strengthening the thermal softening effect, so that the strength and hardness of titanium alloy in the deformation area are reduced. As the degree of material deformation increases, the degree of chip serration increases. At this time, when an external load is applied to the area, cracks appear between the adjacent sawtooth, causing the sawtooth to separate [18].
3. Experimental platform construction
The cutting force in milling process is directly related to milling efficiency, heat production, tool loss, workpiece vibration and surface quality. This parameter provides a crucial theoretical basis and evaluation criterion for the design and operation of machine tools, cutting tools, and fixtures. Moreover, the effects of various processing factors on cutting force differ. At the same time, by observing the dynamic cutting force of the tool, we can effectively evaluate the wear of the tool and the vibration of the system during the milling process. In the process of cutting titanium alloy, the chip heterogeneity often leads to high frequency fluctuation of cutting force. After a lot of experiments and in-depth theoretical analysis, we have identified two main sources of cutting force in the cutting process: first, the elastoplastic deformation of cutting layer metal, chip and workpiece surface metal; Secondly, the friction between the chip and the workpiece during the cutting process is also an important source of cutting force.
Aiming to accurately predict the cutting force under diverse process conditions and provide a basis for the rational selection of milling parameters, this research endeavors to develop the relevant theoretical model by studying the variation law of cutting force. For Ti6Al4V titanium alloys, the processing speed is greater than 100 m/min, which is considered as high-speed milling. In this study, 16 four-factor and four-level orthogonal tests are proposed to obtain milling force as the goal, and orthogonal tests with 4 factors and 4 levels are adopted to determine the levels of each factor as shown in Table 1 and milling process parameters as shown in Table 2. The DMC635V vertical CNC machining center produced by De Magee was used in the test. The relevant parameters are as follows: the positioning accuracy is 0.008 mm, the repeated positioning accuracy is 0.005mm. The spindle conical hole is SK40, the standard spindle speed can reach 8000rpm, the feed speed is 20 m/min, and the fast moving speed can reach 30 m/min. Under the control of Siemens system, it has four machining axes, , , and rotation axis, which ensures accurate positioning and stable processing, ensuring the accuracy of the test. Fig. 6 shows the design of this test bed.
In this experiment, Xiamen Jinlu brand coated four-sided milling cutter with diameter of 10 mm and screw Angle of 45 degrees was used. This test takes Ti6Al4V titanium alloy as the research object and connects it with the force measuring instrument Kistler9257B. Kistler9257B is an advanced dynamometer that can simultaneously measure milling forces and moments in , and directions. The system also includes a charge amplifier and related wire device.
To minimize the impact of burrs on the test results, prior to the commencement of the machining test, a large radial cutting depth was initially employed to remove burrs. Subsequently, to further reduce the effect of minor surface irregularities of the workpiece on the milling force, a one-time milling approach with zero radial cutting depth was adopted.
Table 1Factor level table
Level | Factors | |||
Spindle speed (R/min) | Axial cutting (mm) | Radial cut (mm) | Feed rate (mm/min) | |
1 | 200 | 0.2 | 1.2 | 310 |
2 | 400 | 0.3 | 2 | 440 |
3 | 600 | 0.4 | 2.8 | 570 |
4 | 800 | 0.5 | 3.6 | 700 |
Table 2Milling experiment scheme
Sequence number | Spindle speed (R/min) | Feed rate (m/min) | Axial cutting (mm) | Radial cut (mm) |
1 | 400 | 700 | 0.2 | 1.2 |
2 | 600 | 440 | 0.3 | 1.2 |
3 | 800 | 570 | 0.4 | 1.2 |
4 | 200 | 310 | 0.5 | 1.2 |
5 | 200 | 440 | 0.2 | 2 |
6 | 800 | 700 | 0.3 | 2 |
7 | 600 | 310 | 0.4 | 2 |
8 | 400 | 570 | 0.5 | 2 |
9 | 800 | 310 | 0.2 | 2.8 |
10 | 200 | 570 | 0.3 | 2.8 |
11 | 400 | 440 | 0.4 | 2.8 |
12 | 600 | 700 | 0.5 | 2.8 |
13 | 600 | 570 | 0.2 | 3.6 |
14 | 400 | 310 | 0.3 | 3.6 |
15 | 200 | 700 | 0.4 | 3.6 |
16 | 800 | 440 | 0.5 | 3.6 |
Dyno Ware software was used to derive the cutting force data from the signal measured by the dynamometer. Taking the cutting parameters (200 m/min, 0.1 mm, 1900 r/min, 5 mm) as an example, through the analysis of the cutting component forces , and , it was obtained that in the steady state machining process, the cutting force of the machine would be reduced. The relationship between cutting force and time per milling cutter rotation curve 7.
The cutting force generated during the milling process of the workpiece by the tool varies with the movement of the tool’s four teeth. This is because the engagement and disengagement of the tool teeth with the workpiece during the milling operation have a significant impact on the cutting force. At the beginning of the machining process, the cutting force gradually increases from the minimum to the maximum. Subsequently, during the ongoing machining, the cutting force gradually decreases.
Fig. 7Cutting force periodic signal diagram
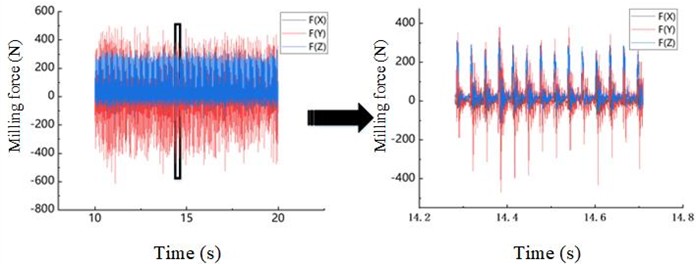
Fig. 8Relationship between four feed speed and milling force
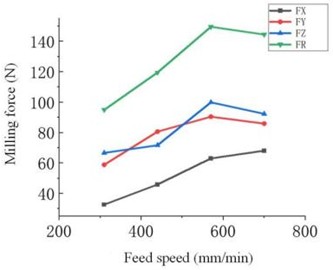
Fig. 8 shows the law of influence of horizontal changes of milling parameters on milling force, where FX, FY and FZ are the average , and direction milling force measured by the force meter respectively, and FR is the maximum value of the milling force.
It can be seen from Fig. 8 that with the increase of feed speed, the milling force in , , direction and in the direction of milling force is on the rise, but it turns downward at 570 mm/min. According to Schulz and Senzovsky [19], increasing the milling speed during the operation accelerates the plastic strain rate of the material, leading to strain-rate hardening. Consequently, the milling force increases. Due to the limited thermal conductivity of titanium-alloy materials, a higher milling speed results in more significant temperature rises. As the thermal-softening effect of the material gradually overtakes and dominates the strain-rate hardening effect, both the hardness and strength of the material, as well as the milling force, decrease. The results show that the thickness and milling force of undeformed chips and the degree of sawtooth serration increase with the increase of feed speed and cutter quantity per tooth [20].
4. Optimization of processing parameters based on chip morphology
4.1. Multi-objective parameter estimation
This paper takes maximum material removal rate and minimum milling force as optimization objectives, and takes spindle speed, axial depth of cut, radial depth of cut and feed speed as constraint conditions, adopts multi-objective algorithm to optimize multi-objective process parameters, and optimizes , , and .
4.1.1. Determination of optimization objective function
In order to obtain relatively scientific observed values of milling force, the average values of milling force in , and directions were respectively taken from the data collected by milling force, and then milling force FR and material removal rate MRR were obtained according to the milling force formula and the maximum material removal rate formula respectively.
1) Taking the minimum milling force FR as the objective function. The calculation formula of milling force is as follows:
where, is the resultant milling force and is the component of the milling force in the direction. is the milling force component in the direction. is the milling force component in the direction.
2) The maximum material removal rate MRR was taken as the objective function:
And because the relationship between feed speed and feed per tooth is:
Therefore, the formula for the maximum material removal rate MRR becomes:
where, is the axial depth of cut (mm), is the feed speed (mm/min), is the radial depth of cut (mm), is the spindle speed (r/min), is the number of teeth of the milling cutter, and is the feed per tooth (mm/z).
The objective function is:
4.1.2. Establishment and verification of milling force regression model
In this paper, multiple linear regression model [21] is used to predict milling force. The principle of this model is simple and intuitive, with relatively low data requirements. It does not require a large amount of complex sample data for training, making it computationally efficient and scalable: it easily integrates with other methods or models to further optimize predictive performance. For example, it can be combined with feature engineering techniques in machine learning to screen and optimize independent variables, or it can be fused with other nonlinear models to address more complex milling force prediction issues. Milling force is mainly affected by four elements of milling, so a mathematical model of the relationship between milling force and milling parameters is established. The stepwise regression method is adopted to establish a second-order polynomial regression mathematical model [22], and the formula is as follows:
Therefore, the empirical calculation expression formula of milling force is:
where, is the constant related to the basic conditions of experimental processing, and , , , , , , , , , , , , and are the coefficients of each milling element, respectively.
The parameters of the milling force regression model were obtained by using SPSS software.
Table 3Parameter values of regression model
Parameters | Estimated | Standard gap | 95 % trust area lower limit | 95 % trust area |
A | –5643.506 | 7462.342 | –100461.554 | 89174.541 |
B | 1422.952 | 3542.736 | –43591.776 | 46437.679 |
C | –10796.315 | 58310.475 | –751701.148 | 730108.517 |
D | 16.151 | 16.243 | –190.235 | 222.537 |
E | 5.428 | 14.906 | –183.975 | 194.830 |
F | 930.294 | 5514.676 | –69140.311 | 71000.899 |
G | –0.451 | 2.013 | –26.028 | 25.126 |
H | –1.535 | 5.784 | –75.024 | 71.953 |
I | –0.888 | 32.544 | –414.405 | 412.628 |
J | –10.067 | 15.363 | –205.271 | 185.136 |
K | –0.006 | 0.011 | –0.151 | 0.139 |
L | –113.324 | 434.439 | –5633.394 | 5406.745 |
M | 27413.628 | 94281.146 | –1170541.915 | 1225369.172 |
N | -0.010 | 0.014 | –0.188 | 0.168 |
O | 0.004 | 0.005 | –0.056 | 0.063 |
Linear regression analysis was performed on the experimental data:
1) The expression formula for the empirical calculation of milling force is:
Table 4Variance analysis table of prediction model
Square and | Freedom of degrees | Range | |
Regression | 29007641.917 | 15 | 1933842.794 |
Residual | 520926.115 | 1 | 520926.115 |
Not calibrating the total | 29528568.033 | 16 | |
Total time after correction | 9763717.406 | 15 |
The corrected total deviation sum of squares is:
The residual sum of squares calculated according to the data is:
In nonlinear regression, the sum of squares decomposition is:
This is no longer true, so the partial coefficient of determination is used to measure and calculate the correlation coefficient of nonlinear regression:
Model bias coefficient () is 0.947, which means that spindle speed, radial depth of cut, axial depth of cut and feed speed can explain 94.7 % of variation, indicating that model construction is meaningful.
2) F-test is carried out on the prediction model. For the F-test [23], Sum of Squares for the Full Model (SSR-F) and Sum of Squares for the Reduced Model (SSR-R) need to be calculated. Total modular sum of squares represents the sum of squares of a nonlinear regression model built using all independent variables, The sum represents the sum of squares using a nonlinear regression model that contains only the intercept term. Then, calculate the statistic:
where, is the number of experimental group and p is the number of variables.
There were 16 groups in this experiment, the number of variables was 4, and the significant factor 0.01. The F-test method in this experiment was expressed as F0.01(4,11), and F0.01(4,11) = 5.67 was obtained by referring to the distribution table. By substituting SSr and SSe into the test formula, the value is 48.79. It is much larger than F0.01(4,11) = 5.67, so the empirical formula of milling force proposed in this paper can be well consistent with the milling force under orthogonal test conditions, so that the accuracy of the model is higher.
4.1.3. Establishment and analysis of MRR regression model of material removal rate
Table 5 indicates that the material removal rate (MRR) serves as the dependent variable in the linear regression analysis, while spindle speed, feed speed, axial depth of cut, and radial depth of cut are the independent variables. The model formula is presented as follows, as shown in the table above: MMR= –960.7955-0.042 × spindle speed +0.964× feed speed +1357.600× axial cutting depth +187.150 × radial cutting depth, the model square value is 0.950, This means that spindle speed, feed speed, axial cutting depth, and radial cutting depth can explain 95.0 % of the variation in MMR. When test was conducted on the model. The model passed the F-test ( 51.725, 0.000 < 0.05), indicating that the MRR is affected by at least one of the following factors: feed speed, axial depth of cut, radial depth of cut, and spindle speed. According to the summary analysis, the MRR is significantly influenced by feed speed, axial depth of cut, and radial depth of cut. However, the spindle speed has no effect on the MRR. Some literature indicates that increasing the spindle speed significantly enhances MRR under traditional cutting conditions. However, these studies often fail to adequately consider the complex interactions during the cutting process. In this study, it is possible that the synergistic effects between other parameters (such as feed rate and depth of cut) and spindle speed have offset the potential impact of spindle speed on MRR. For example, when the spindle speed increases, if the feed rate and depth of cut are not adjusted accordingly, and there is no substantial change in tool-workpiece contact time or cutting volume, MRR will not change significantly. Moreover, excessively high spindle speeds can lead to increased tool wear and excessive heat generation, which in turn reduces effective cutting capacity and limits the improvement of MRR. Future research could delve deeper into the cutting mechanisms under different parameter combinations, using more comprehensive experimental designs and theoretical analyses to reveal the complex relationships between parameters, providing a more accurate basis for optimizing machining processes.
Linear regression analysis results (16).
Table 5Parameters of regression model
Non-standardized coefficient | Standard error | |
Constants | –960.795 | 109.545 |
Spindle speed | –0.042 | 0.083 |
Feed rate | 0.964 | 0.127 |
Axial cutting | 1357.600 | 165.445 |
Radial cut | 187.150 | 20.681 |
R2 | 0.950 |
Table 6Regression model analysis of variance
Square and | Freedom of degrees | Range | |
Regression | 1132664.384 | 4 | 283166.096 |
Residual | 60218.816 | 11 | 5474.438 |
Total time after correction | 1192883.200 | 15 |
As can be seen from the above table, during its execution, indicating the significance of the model construction.
4.2. Optimization of processing parameters based on locust optimization algorithm
4.2.1. Parameter constraints and determination of multi-objective optimization model
When solving the optimization model of milling processing parameters, the processing parameters need to be constrained. According to the actual processing situation and machine tool performance, the constraint range of cutting parameters is:
Therefore, the multi-objective optimization model can be obtained as follows:
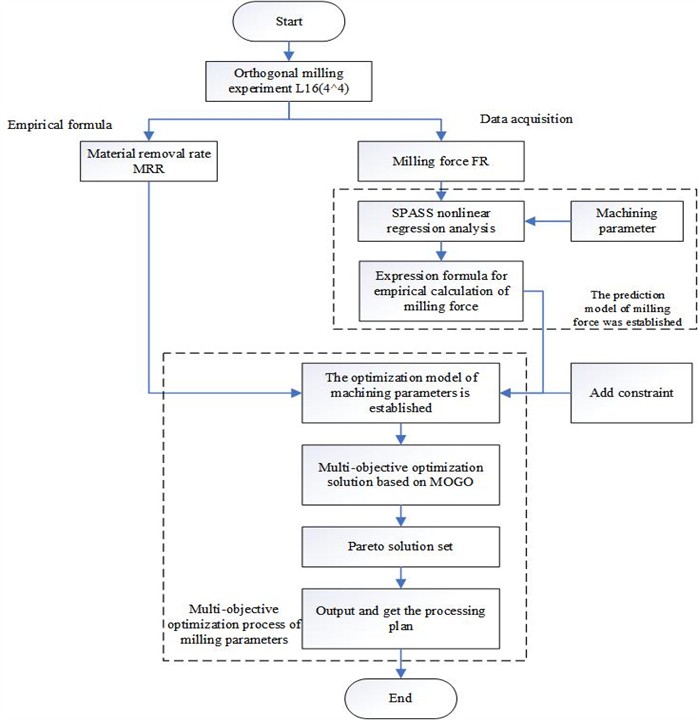
In order to obtain the Pareto solution of the multi-objective optimization model [24], the following solution flow Fig. 9 is given. As illustrated in the figure, the milling force and resultant force data were acquired through meticulously designed milling experiments. Meanwhile, the material removal rate was calculated using a specific formula. Subsequently, SPSS software was employed to conduct nonlinear regression analysis for prediction purposes, thereby establishing a relationship model between the cutting force and cutting parameters. A multi-objective optimization model of cutting parameters was established to minimize the resultant cutting force and maximize the material removal rate, and was optimized by MOGOA algorithm. Finally, the solution is obtained from Pareto frontier.
4.2.2. Optimization results and analysis
The multi-objective optimization model was solved based on the locust optimization algorithm. Parameters were set as follows: the population number was 200 and the number of iterations was 100. After multiple iterations of the optimization algorithm, the optimization results were obtained, as shown in Fig. 10.
Fig. 9Flow chart of process parameter optimization solution
As depicted in Fig. 10, the optimization results of the two objective functions, namely the maximum material removal rate and the minimum milling force, are in conflict with each other. Specifically, the milling force increases as the material removal rate rises. When the milling force is low, the material removal rate is also low. When selecting machining parameters, the requirements of the actual manufacturing process should be considered. The multi-objective parameter optimization provides a basis for the selection of cutting parameters. Table 7 presents the 16 groups of Pareto-optimal solutions generated based on the multi-objective optimization results.
Through in-depth analysis of the proposed optimization results, it is obvious that the optimal solution shows a tendency of uniform distribution along the Pareto optimal solution in the two key objective functions of milling force and material removal rate. This distribution pattern demonstrates excellent performance and accuracy in finding the best solution.
In order to verify the effect of optimization of machining parameters, two groups of optimization parameters are carefully selected from 16 groups of Pareto optimal solution sets and verified by experiments. Since the material removal rate can be calculated directly by the formula, we focus on the measurement experiment of milling force. The comparison between experimental results and optimization parameters is shown in Table 8, which provides a basis for us to evaluate the rationality of optimization results. According to Table 8, the errors of the optimized milling force value and the experimental milling force value are 11.3 % and 7.65 % respectively, which is within the allowable range, proving the rationality of the optimization results. In the mechanical processing industry, there is no absolute unified standard for the error range between the predicted value and the experimental value of milling force. In the rough machining of ordinary mechanical manufacturing, the processing accuracy is relatively low and the focus is on improving efficiency. Therefore, the error range of 11.3 % and 7.65 % is acceptable.
Fig. 10Pareto solution set curve
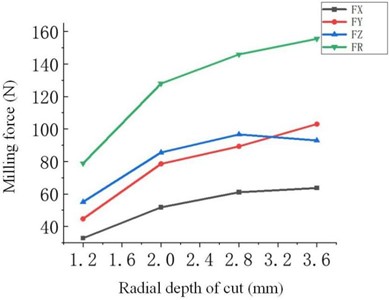
Table 7The trade-offs between milling force (FR) and material removal rate (MRR)
Sequence number | Spindle speed (R/min) | Feed rate (mm/min) | Axial cutting (mm) | Radial cut (mm) | Material removal rate (cm3/min) | Milling force (N) |
1 | 800 | 700 | 0.4952 | 2.4850 | 861.41 | 127.57 |
2 | 200 | 700 | 0.4961 | 2.4827 | 862.15 | 127.59 |
3 | 388.0939 | 700 | 0.5000 | 2.5169 | 880.92 | 132.36 |
4 | 800 | 700 | 0.5000 | 2.5108 | 878.77 | 130.64 |
5 | 800 | 700 | 0.5000 | 2.5392 | 888.72 | 134.06 |
6 | 800 | 700 | 0.4966 | 2.4857 | 864.10 | 127.65 |
7 | 388.0928 | 700 | 0.5000 | 2.6738 | 935.84 | 151.91 |
8 | 800 | 700 | 0.4987 | 2.4857 | 867.68 | 127.66 |
9 | 800 | 700 | 0.5000 | 2.5509 | 892.81 | 135.48 |
10 | 800 | 700 | 0.4979 | 2.4857 | 866.49 | 127.65 |
11 | 800 | 700 | 0.5000 | 2.5103 | 878.62 | 130.59 |
12 | 800 | 700 | 0.5000 | 2.6731 | 935.58 | 150.77 |
13 | 288.2984 | 700 | 0.5000 | 1.7001 | 595.05 | 52.07 |
14 | 288.2984 | 700 | 0.5000 | 1.7014 | 595.51 | 52.17 |
15 | 668.4960 | 700 | 0.4860 | 1.3782 | 468.85 | 30.92 |
16 | 200 | 700 | 0.4882 | 2.0395 | 696.92 | 80.41 |
In order to ensure that the quality of the processed titanium alloy meets the expected standards and meets various processing constraints, a larger feed speed, radial depth of cut and spindle speed are used.
The locust optimization algorithm provides an effective method to optimize the milling process parameters to achieve high performance machining results. This method can not only improve the processing quality, but also reduce the production cost and shorten the time to market. Therefore, in the future engineering applications, this optimization algorithm will be more widely used and recognized.
Table 8Pareto optimal solutions
Sequence number | Spindle speed (R/min) | Feed rate (mm/min) | Axial cutting (mm) | Radial cut (mm) | Material removal rate (cm3/min) | Milling force (N) |
1 | 800 | 700 | 0.4952 | 2.4850 | 127.57 | 141.98 |
2 | 388.0928 | 700 | 0.5000 | 2.6738 | 151.91 | 163.53 |
5. Conclusions
This paper conducts a finite-element simulation study using ABAQUS, focusing on the simulation and analysis of cutting force, cutting temperature, and chip morphology. Additionally, it delves into the application of multi-objective optimization algorithms for the optimization of cutting process parameters. Based on these investigations, the following conclusions are drawn:
1) Simulation of the cutting process under different cutting speeds shows that the cutting speed increases, the thermal softening effect increases, and the average flow stress decreases, thus reducing the cutting force. By analyzing the process of chip formation, the workpiece material is elastic deformed by cutting tool extrusion, and the cutting layer is formed. As the cutting progresses, the chip gradually takes on a zigzag shape. Through the simulation analysis of temperature variations, it was discovered that the peak temperature at the measuring point significantly increases as the normal measuring distance decreases.
2) Orthogonal experiments are designed to collect milling force data, and several sets of experiments are carried out for different milling parameters. Optimization objective function is determined, milling force regression model and material removal rate regression model are established, parameter constraint and multi-objective optimization are carried out. In actual manufacturing, the material removal speed can be accelerated, the processing time can be reduced, and the production efficiency can be improved. For example, in mass production of parts, the overall processing cycle can be shortened. The multi-objective optimization model is solved by locust optimization algorithm, and 16 Pareto optimal solutions are obtained, which provides an important basis for the selection of cutting parameters in actual machining process.
3) Although FEM has many advantages, it has some limitations. This study is based on the limitations of ABAQUS finite element simulation. First, the constitutive models we use are mostly simplified assumptions, making it difficult to accurately reflect the true mechanical behavior of titanium alloys under complex high-speed cutting conditions. They fail to adequately consider the coupled effects of strain rate and temperature. Second, the parameter schemes obtained from multi-objective optimization are based on specific condition influences, which limit their applicability in diverse industrial production scenarios.
References
-
Sampsa V. A. Laakso, “Damage does not cut it – Saturated damage in FEM modelling of metal cutting breaks the simulation but not the chip,” Procedia Manufacturing, Vol. 51, pp. 806–811, Jan. 2020, https://doi.org/10.1016/j.promfg.2020.10.113
-
J. Li, Z. Tao, X. Cai, Q. An, and M. Chen, “Experimental and finite element analysis of the formation mechanism of serrated chips of nickel-based superalloy Inconel 718,” The International Journal of Advanced Manufacturing Technology, Vol. 107, No. 11-12, pp. 4969–4982, May 2020, https://doi.org/10.1007/s00170-020-05150-y
-
R. Johnson and W. K. Cook, “A constitutive model and data for metals subjected to large strains high strain rates and high temperatures,” in 7th International Symposium on Ballistics, 1983.
-
W. Jomaa, O. Mechri, J. Lévesque, V. Songmene, P. Bocher, and A. Gakwaya, “Finite element simulation and analysis of serrated chip formation during high-speed machining of AA7075-T651 alloy,” Journal of Manufacturing Processes, Vol. 26, pp. 446–458, Apr. 2017, https://doi.org/10.1016/j.jmapro.2017.02.015
-
J. M. Rodriguez Prieto, J. M. Carbonell, J. C. Cante, J. Oliver, and P. Jonsén, “Generation of segmental chips in metal cutting modeled with the PFEM,” Computational Mechanics, Vol. 61, No. 6, pp. 639–655, Sep. 2017, https://doi.org/10.1007/s00466-017-1442-z
-
P. J. Arrazola, O. Barbero, and I. Urresti, “Influence of material parameters on serrated chip prediction in finite element modeling of chip formation Process,” International Journal of Material Forming, Vol. 3, No. S1, pp. 519–522, Jun. 2010, https://doi.org/10.1007/s12289-010-0821-1
-
D. Huang, C. Weißenfels, and P. Wriggers, “Modelling of serrated chip formation processes using the stabilized optimal transportation meshfree method,” International Journal of Mechanical Sciences, Vol. 155, pp. 323–333, May 2019, https://doi.org/10.1016/j.ijmecsci.2019.03.005
-
M. Sima and T. Özel, “Modified material constitutive models for serrated chip formation simulations and experimental validation in machining of titanium alloy Ti-6Al-4V,” International Journal of Machine Tools and Manufacture, Vol. 50, No. 11, pp. 943–960, Nov. 2010, https://doi.org/10.1016/j.ijmachtools.2010.08.004
-
X. L. Fu, W. X. Lin, Y. Z. Pan, and W. T. Liu, “Morphology evolution and micro-mechanism of chip formation during high-speed machining,” The International Journal of Advanced Manufacturing Technology, Vol. 98, No. 1-4, pp. 165–175, Jul. 2017, https://doi.org/10.1007/s00170-017-0411-1
-
S.-H. Rhim and S.-I. Oh, “Prediction of serrated chip formation in metal cutting process with new flow stress model for AISI 1045 steel,” Journal of Materials Processing Technology, Vol. 171, No. 3, pp. 417–422, Feb. 2006, https://doi.org/10.1016/j.jmatprotec.2005.08.002
-
N. K. Sahu and A. B. Andhare, “Multiobjective optimization for improving machinability of Ti-6Al-4V using RSM and advanced algorithms,” Journal of Computational Design and Engineering, Vol. 6, No. 1, pp. 1–12, Jan. 2019, https://doi.org/10.1016/j.jcde.2018.04.004
-
H. Xie and Z. Wang, “Study of cutting forces using FE, ANOVA, and BPNN in elliptical vibration cutting of titanium alloy Ti-6Al-4V,” The International Journal of Advanced Manufacturing Technology, Vol. 105, No. 12, pp. 5105–5120, Nov. 2019, https://doi.org/10.1007/s00170-019-04537-w
-
S. K. Shihab, J. Gattmah, and H. M. Kadhim, “Experimental investigation of surface integrity and multi-objective optimization of end milling for hybrid Al7075 matrix composites,” Silicon, Vol. 13, No. 5, pp. 1403–1419, Jun. 2020, https://doi.org/10.1007/s12633-020-00530-1
-
Y. Tang et al., “Exploring temperature-resilient recycled aggregate concrete with waste rubber: An experimental and multi-objective optimization analysis,” Reviews on Advanced Materials Science, Vol. 62, No. 1, Aug. 2023, https://doi.org/10.1515/rams-2023-0347
-
S. Wan, S. Li, Z. Chen, and Y. Tang, “An ultrasonic-AI hybrid approach for predicting void defects in concrete-filled steel tubes via enhanced XGBoost with Bayesian optimization,” Case Studies in Construction Materials, Vol. 22, p. e04359, Jul. 2025, https://doi.org/10.1016/j.cscm.2025.e04359
-
T. Ghosh, Y. Wang, K. Martinsen, and K. Wang, “A surrogate-assisted optimization approach for multi-response end milling of aluminum alloy AA3105,” The International Journal of Advanced Manufacturing Technology, Vol. 111, No. 9-10, pp. 2419–2439, Oct. 2020, https://doi.org/10.1007/s00170-020-06209-6
-
Q. Wang, C. Yang, H. Yang, and Y. He, “Simulation of mechanical response in machining of Ti-6Al-4V based on finite element model and visco-plastic self-consistent model,” Metals, Vol. 13, No. 8, p. 1362, Jul. 2023, https://doi.org/10.3390/met13081362
-
X. Cui, B. Zhao, F. Jiao, and J. Zheng, “Chip formation and its effects on cutting force, tool temperature, tool stress, and cutting edge wear in high- and ultra-high-speed milling,” The International Journal of Advanced Manufacturing Technology, Vol. 83, No. 1-4, pp. 55–65, Jul. 2015, https://doi.org/10.1007/s00170-015-7539-7
-
Z. Wang and M. Rahman, “High-speed machining,” Comprehensive Materials Processing, Vol. 41, No. 2, pp. 221–253, Jan. 2014, https://doi.org/10.1016/b978-0-08-096532-1.01113-4
-
X. Li, Y. Gong, and J. Zhao, “Surface profile and milling force prediction for milling thin-walled workpiece based on equivalent 3D undeformed chip thickness model,” The International Journal of Advanced Manufacturing Technology, Vol. 122, No. 2, pp. 977–991, Aug. 2022, https://doi.org/10.1007/s00170-022-09611-4
-
S. Etemadi and M. Khashei, “Etemadi multiple linear regression,” Measurement, Vol. 186, p. 110080, Dec. 2021, https://doi.org/10.1016/j.measurement.2021.110080
-
D. Wu, H. Wang, K. Zhang, and X. Lin, “Research on formation mechanism and optimization method of surface waviness of TC4 blisk blade,” Journal of Manufacturing Processes, Vol. 39, pp. 305–326, Mar. 2019, https://doi.org/10.1016/j.jmapro.2019.02.031
-
H. Luepsen, “ANOVA with binary variables: the F-test and some alternatives,” Communications in Statistics – Simulation and Computation, Vol. 52, No. 3, pp. 745–769, Mar. 2023, https://doi.org/10.1080/03610918.2020.1869983
-
D. Peri, “Direct tracking of the Pareto front of a multi-objective optimization problem,” Journal of Marine Science and Engineering, Vol. 8, No. 9, p. 699, Sep. 2020, https://doi.org/10.3390/jmse8090699
About this article

The authors have not disclosed any funding.
The datasets generated during and/or analyzed during the current study are available from the corresponding author on reasonable request.
Na Zhao: funding, project administration, writing-original draft preparation. Wei Du: data curation, writing-review and editing. Hao Tong: formal analysis, methodology. Kuo Liu: supervision, validation.
The authors declare that they have no conflict of interest.
