Abstract
Serang Regency has a sub-tropical climate and is classified as lowland, generally consisting of rice fields, fields, and gardens. These three lands have the potential to flood during the rainy season, which has implications for a decrease in agricultural production. Flood forecasts are carried out on agricultural land to avoid decreased production. The data used included rainfall, harvest area, and agricultural production. Estimates of farmland flooding and agricultural production changes are overlayed with Geographic Information Systems (GIS) and production percentages. The results of rainfall analysis show that the monthly average rainfall in Serang Regency is categorized as low to high. Meanwhile, heavy rain has the potential to occur in January and February. After being coated with GIS, it is spatially predicted that six sub-districts with an altitude below 10 meters above sea level have the potential to flood. Of the six sub-districts, 2,902.80 ha of agricultural land is estimated to have the potential to be flooded. Flooding in the area has implications for decreasing the production of seasonal crops, vegetables and fruits. Food crop production decreased by 0.42 %, while seasonal vegetables and fruits decreased by 48.04 %. There are five types of food crops and 12 types of vegetables and fruits that have the potential to be developed in Serang Regency. The food crop with the most significant production is rice, while the seasonal production of vegetables and fruits is cucumbers. In the event of a flood, rice production in Serang Regency is predicted to decrease by 1.23 % and cucumber production is expected to decrease by 0.48 %. It is necessary to adopt a planting pattern with a climate approach to minimize the decline in production.
1. Introduction
Indonesia administratively consists of 38 provinces, one of which is Banten Province, which includes four districts/cities, including Serang Regency. Astronomically, Serang Regency is located between 05º50'00" to 06º20'00" South Latitude and 105º00'00" to 106º22'00" East Longitude. The topography of Serang Regency is dominated by lowlands with an altitude of between 5 and 240 meters above sea level, which provides great potential for industrial and agricultural development [1], [2].
In ten years, from 2014 to 2023, the number of industries in Serang Regency increased significantly from 144 to 362, or a growth of 151.39 %. This increase requires a large increase in land, which has the potential to change land use extensively. One of the impacts of this change is the decrease in agricultural land area, which, based on harvest area data, decreased from 97,758.00 hectares to 81,455.46 hectares [3].
Agricultural land in Serang Regency consists of rice fields, fields, and gardens. Rice fields are land previously planted with annual crops and now with rice or other secondary crops [4], [5]. Fields are non-paddy fields that are usually planted with annual crops on a seasonal [6], [7] while a garden is land planted with perennial or perennial crops without a shift in use [8]. In these three types of land, Serang Regency develops seven food crops and 17 seasonal vegetables and fruits.
The food crops planted include rice, corn, soybeans, peanuts, mung beans, cassava, and sweet potatoes. Meanwhile, seasonal vegetables and fruits planted include green onions, onions, spinach, various types of chili, long beans, cucumbers, cabbage, cauliflower, melons, watermelons, eggplants, and tomatoes. However, the harvest area for each type of plant decreases every year. In 2014, the harvested area of food crops reached 94,226.00 hectares, but in 2023, it decreased to 79,934.46 hectares. The harvest area of seasonal vegetables and fruits decreased from 3,532.00 hectares to 1,521.00 hectares [9]. This variation in the harvest area has implications for the amount of production, which is influenced by local land and climate conditions [10].
Serang Regency has a sub-tropical climate with two seasons, namely the rainy and dry seasons. During the rainy season, low-lying areas are at risk of flooding [11]. Factors that affect flood-prone areas include slopes, land use, rainfall, soil type, land height, and the presence of rivers. According to the National Coordinating Board for Surveys and Mapping, about 30 % of flood events in vulnerable areas are affected by rainfall [12]. Floods are a frequent natural disaster in Serang Regency, with a report from the Badan Nasional Penanggulangan Bencana (BNPB) showing that for eight consecutive years from 2014 to 2021, floods occurred between December and May, with January and February being the most common months.
Previous studies of flood forecasting in the tropics have often focused on separate temporal or spatial analyses. For example, [12] used statistical models for flood hazard mapping, while [11] emphasized spatial machine learning without integrating long-term rainfall trends. This study bridges the gap by combining the Gumbel distribution for temporal rainfall frequency analysis and GIS-based spatial mapping, thus enabling a more comprehensive flood risk assessment tailored to the vulnerability of agricultural land.
According to the Meteorological and Geophysical Agency, the average monthly rainfall in Serang Regency ranges from 0.00 to 362.70 mm, with an intensity between 222.20 and 362.70 mm. This shows that the rainfall in this area varies from low to high. Some farmlands have the potential to flood during high rainfall, which can lead to crop failure and a decrease in agricultural production. Therefore, estimating the potential for flooded land is essential to minimize negative impacts on production. This study aims to predict temporal and spatial agricultural land in Serang Regency that can potentially flood.
The novelty of this study lies in integrating the Gumbel distribution approach and the GIS system to analyze flood risk simultaneously from the temporal and spatial sides. Focusing on direct impacts on lowland farmland in Serang Regency provides new insights into the relationship between rainfall intensity, flood risk, and agricultural productivity. The results of this risk mapping are expected to contribute to policymakers in formulating disaster mitigation strategies and land use planning.
2. Material and methods
The methodology in this study includes four main stages: 1) Data collection using rainfall data for ten years (2014-2023) from the Serang Meteorological Station as well as land use and topographic maps from the Geospatial Information Agency; 2) Analysis of rainfall frequency by applying Gumbel distribution to identify extreme rainfall and predict the return period; 3) Calculation of rainfall intensity using the Mononobe equation to determine rainfall intensity based on various return periods; and finally, 4) GIS overlay by conducting spatial analysis using GIS to map flood-prone areas based on rainfall and topographic characteristics.
2.1. Temporal distribution
The temporal distribution of rainfall analysis is carried out using Eq. (1):
where is the average monthly/seasonal/annual rainfall (mm), is the precipitation of a particular month/season/year in year and is the number of years observed.
2.2. Rainfall frequency
The forecast of repeated rainfall events was analyzed using the Gumbel distribution in Eq. (2):
where is the rainfall, is the location of the parameter, is the scale of the parameter.
2.3. Rainfall intensity
Then, based on the repeated period, the intensity of rainfall () is analyzed using the Mononobe equation as shown in the Eq. (3):
The rainfall is analyzed using the equation:
The mean value of rainfall was analyzed using the equation:
The frequency factor was analyzed using the equation:
Standard deviations were analyzed using the equation:
is the precipitation for the various return times (mm), is the concentration-time (hours) for units in minutes t multiplied by 60, and it is the intensity of precipitation for the various return times (mm/h). Then, for the frequency factor, is the reduced mean, is the reduced standard deviation, is the average precipitation, is the standard deviation, and n is the amount of data. Next, to check the spatial distribution of rainfall, rainfall data from https://data.chc.ucsb.edu/products/CHIRPS-2.0/.
Administrative data and maps are used to map potential flood land in Serang Regency, along with land functions and conditions. Data and maps are obtained from https://www.indonesia-geopspasial.com, while disaster-prone maps are from https://inarisk.bnpb.go.id/. The spatial distribution of rainfall in each region is analyzed using rainfall map data and land use.
2.4. Overlay GIS
Overlay analysis of the spatial distribution of rainfall was used by utilizing the Geographic Information System (GIS). With this approach, the distribution of agricultural land in Serang Regency that has the potential to flood will be obtained. Based on the area of rural land that has the potential to flood, changes in agricultural production in Serang Regency will be made.
Agricultural production data for ten years was obtained from the Food Security and Agriculture Office [Dinas Ketahan Pangan dan Pertanian (DKPP)] of Serang Regency and the Central Statistics Agency [Badan Pusat Statistik (BPS)] of Serang Regency and Banten Province. Changes in agricultural production (in years) are analyzed using Eq. (8):
where is agricultural production in year (), is agricultural production in year (), is the current year’s agricultural production, and is the previous year’s agricultural production.
Uncertainty analysis is carried out using two approaches to improve the reliability of prediction results, namely: 1) Confidence Interval to measure the level of confidence in the results of rainfall forecasts; and 2) Monte Carlo simulation to evaluate the sensitivity of the results to the variability of rainfall data and other environmental variables. This analysis provides an overview of potential deviations in forecast results and strengthens the model’s validity.
3. Results and discussion
3.1. Rainfall forecasting and potential flood areas in Serang Regency
Observation data from the Serang Meteorological Station was used to predict temporal rainfall. The results of the observation of rainfall data for ten years from 2014-2023 are shown in Table 1.
Table 1Monthly rainfall data for Serang Regency
Year | Jan | Feb | March | April | May | June | July | Aug | Sept | Oct | Nov | Dec |
2014 | 377.00 | 212.00 | 103.00 | 72.00 | 113.00 | 65.00 | 232.00 | 10.00 | 22.00 | 21.00 | 155.00 | 139.00 |
2015 | 362.70 | 241.40 | 193.50 | 130.70 | 39.10 | 83.40 | 4.70 | 11.70 | 10.20 | 28.50 | 54.10 | 155.40 |
2016 | 125.90 | 271.90 | 228.80 | 88.00 | 143.50 | 93.00 | 134.80 | 86.70 | 158.90 | 159.60 | 137.80 | 178.80 |
2017 | 321.00 | 351.10 | 113.50 | 93.50 | 142.80 | 100.80 | 106.30 | 18.10 | 47.50 | 74.90 | 152.90 | 239.90 |
2018 | 141.90 | 178.20 | 222.20 | 153.70 | 70.40 | 196.60 | 3.00 | 0.00 | 29.90 | 87.60 | 116.50 | 167.90 |
2019 | 331.70 | 179.90 | 209.90 | 150.70 | 93.80 | 10.00 | 14.40 | 1.00 | 0.00 | 11.20 | 74.80 | 179.00 |
2020 | 332.50 | 180.30 | 204.30 | 150.70 | 102.50 | 10.20 | 14.40 | 1.00 | 0.00 | 11.00 | 75.40 | 180.20 |
2021 | 198.70 | 283.20 | 120.40 | 234.00 | 49.90 | 127.60 | 45.30 | 31.30 | 207.90 | 90.50 | 209.20 | 235.70 |
2022 | 109.10 | 121.00 | 289.00 | 184.50 | 191.60 | 114.60 | 43.10 | 101.10 | 56.60 | 200.40 | 156.70 | 152.50 |
2023 | 148.70 | 310.90 | 276.90 | 130.10 | 69.10 | 151.30 | 89.00 | 0.00 | 0.50 | 0.00 | 138.20 | 77.80 |
Based on the data in Table 1, the average monthly rainfall in Serang Regency is between (0.00-377.00) mm/month. Based on this range, rainfall in Serang Regency is categorized as low to high. The analysis to test the distribution and category of rainfall every month was carried out using equation (1). The results of the analysis using this equation are shown in Fig. 1.
Fig. 1 shows that Serang Regency receives rainfall almost every month, with an average monthly rainfall between (30.00-244.61) mm/month. Rainfall in Serang Regency is categorized as low to high. High rainfall occurs in January and February, while low rainfall occurs in June to October. Meanwhile, rainfall occurs in March, April, May, November and December.
The rainfall pattern in Serang Regency is almost in the form of a satellite dish, so it has the potential for a return period. Gumbel Distribution predicts the return period of monthly average rainfall in Serang Regency. With this distribution, the average monthly rainfall forecast for the return period of 2 years, five years, 10 years, and so on is obtained. Rainfall intensity forecasts are carried out based on high rainfall in each period. Eqs. (4) to (8) are used to estimate the intensity of rainfall. The analysis results obtained the rainfall intensity using Eqs. (4-8), as shown in Table 2.
Fig. 1Monthly rainfall of Serang Regency
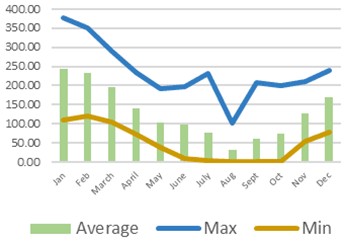
Table 2Results of the analysis of the return period and intensity of rainfall
Period (year) | Estimate | Time | Period (year) | ||||||||
Minute | O’clock | 2 | 5 | 10 | |||||||
2 | 313.2200 | 0.36651 | 49.8276 | –0.1287 | –6.41216 | 306.81 | 5 | 0.08 | 557.51 | 660.13 | 728.08 |
5 | 313.2200 | 1.49994 | 49.8276 | 1.0047 | 50.06375 | 363.28 | 10 | 0.17 | 351.21 | 415.86 | 458.66 |
10 | 313.2200 | 2.25037 | 49.8276 | 1.7552 | 87.45572 | 400.68 | 30 | 0.50 | 168.84 | 199.92 | 220.50 |
15 | 313.2200 | 2.67375 | 49.8276 | 2.1786 | 108.55196 | 421.77 | 60 | 1.00 | 106.36 | 125.94 | 138.91 |
Based on Table 2, the recurrence of high rainfall for the 2-year, 5-year, 10-year, and 15-year return periods was 306.81 mm, 363.28 mm, 400.28 mm, and 421.77 mm, respectively. In each return period, rainfall in Serang Regency increases between (5-18) %. During this period, the prediction of monthly rainfall intensity in Serang Regency within 10 minutes is 351.21 mm, 415.86 mm, and 458.66 mm, respectively. According to Badan Meteorologi, Klimatologi dan Geofisika (BMKG), monthly rainfall between (300-500) mm is categorized as high. Based on this, the results of the rainfall forecast in Serang Regency in 2 years, 5 years and 10 years are predicted to be high rainfall.
High rainfall in Serang Regency temporarily occurs in January and February, while moderate rainfall occurs in March, April, May, November and December. Because Serang Regency is lowland, it is predicted that during these months, when moderate to high rainfall occurs, there is the potential for flooding. This happened to the National Disaster Management Agency (BNPB). Floods occurred in January 2014, 2017, 2019, and 2021, while in February, they occurred in 2014, 2015, 2017 to 2021. Meanwhile, floods in the moderate rainfall category occur in March, April, May, November and December. Floods in March occurred in 2015, 2018, 2020 and 2021, April and December in 2017, 2018 and 2020, and November in 2018. This shows that floods in Serang Regency range from moderate to high rainfall. An analysis of the spatial distribution of rainfall was carried out to determine the area where flooding occurred that month.
The spatial distribution of rainfall in Serang Regency, using data from https://data.chc.ucsb.edu/products/CHIRPS-2.0/. Rainfall data from these sources is layered with the boundaries of Serang Regency, which was obtained from https://www.indonesia-geopspasial.com. Rainfall categories were obtained in each region with an overlay analysis of the Geographic Information System (GIS). The results of the rainfall overlay analysis in each area in Serang Regency are shown in Fig. 2.
Fig. 2Flooded areas in Serang Regency
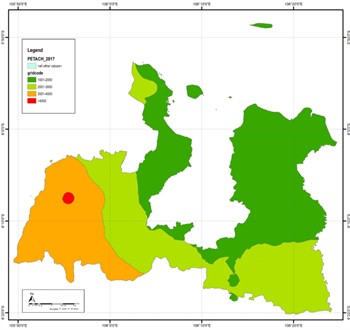
a) Flood areas in Serang Regency in 2017
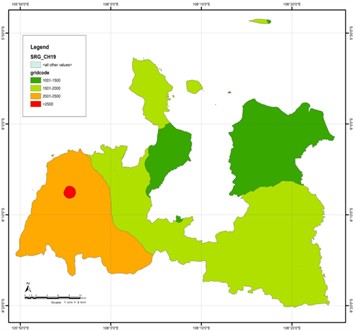
b) Flood areas in Serang Regency in 2019
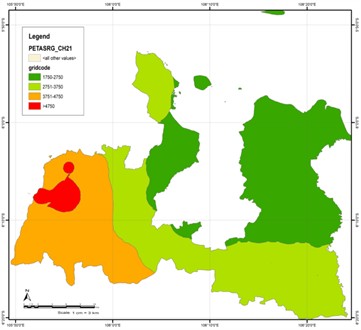
c) Flood areas in Serang Regency in 2021
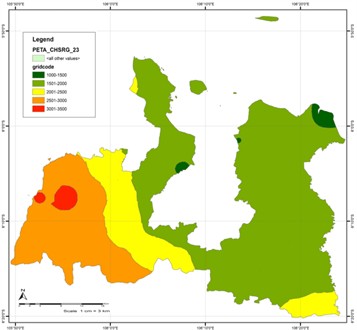
d) Flood areas in Serang Regency in 2023
Fig. 2. indicates that the annual rainfall in 2017 in Serang Regency is between (1,000-4,500) mm/year. That year, the Serdang Regency's rainfall category was categorized as low to very high. Very high rainfall (> 4,000 mm/year) occurred in parts of Anger and Cinangka, while high rainfall (3,000-4,000 mm/year) occurred in Anyer, Cinangka and Padarincang districts. In Fig. 2(b), the 2019 rainfall is between (1,000-2,936) mm/year and includes low to moderate rainfall. The category of moderate rainfall (2,000-3,000 mm/year) occurred in Anyer, Cinangka and Padaringang Districts. Then, in Fig. 2(c), in 2021, rainfall is between (1,650-4,950) mm/year and includes low to very high rainfall. Very high rainfall occurred in parts of Anyer and Cinangka, while high rainfall occurred in Anyer, Cinangka and Padarincang districts. Meanwhile, rainfall is occurring in the districts of Bojonegara, Pulo Ampel, Mancak, Gunungsari, Pabuaran, Ciruas, Baros, Petir, Tunjungteja, Pamarayan, Jawilan and Kopo. On the other hand, low rainfall (1,000-2,000 mm/year) occurs in other sub-districts. Furthermore, in Fig. 2(d), rainfall in 2023 is between (1,000-3,500) mm/year and includes low to high rainfall. High rainfall occurred in parts of Anyer, Cinangka Padarincang, and Ciomas sub-districts. Meanwhile, moderate rainfall occurred in some sub-districts of Anyer, Mancak, Gunungsari, Padarincang and Ciomas, while low rainfall occurred in others. The data above shows that the annual rainfall category in Serang Regency is low to very high. Annual rainfall with moderate to high categories occurred in Anyer and Cinangka Districts. Referring to the pattern above, repeated annual rainfall events occur within 2 years.
In 2 years, the annual rainfall pattern in Serang Regency is low to very high, low to moderate, and low to high. Referring to the results of the analysis of the distribution of Gumbel and Mononobe, the annual rainfall in the Serang Regency for a 2-year return period is predicted to be low to very high in 2025 and low to moderate in 2027. With this rainfall category, flooding is expected to occur in several areas.
The overlay is done with flood-prone maps from https://inarisk.bnpb.go.id/. In overlaying, the flood-prone assessment only uses rainfall data. Because the data on the map is national, the analysis of flood-prone areas only uses monthly rainfall data from the Serang Regency.
The results of the overlay analysis of flood-prone areas and monthly rainfall in Serang Regency are shown in Fig. 3.
Fig. 3 shows that areas with high flood potential (red) occur in almost 15 sub-districts. The distribution is small from Pulo Ampel, Bojonegara, and Kramatwatu Districts. Then, several areas in the Cinangka and Padarincang Districts. Furthermore, several areas of Tunjung Teja, Pamarayan, Kopo, Cikande, Kibin, Kragilan and Binuang Districts. Most of them occurred in Pontang, Tirtyasa, and Tanara sub-districts.
Fig. 3Potential flood areas
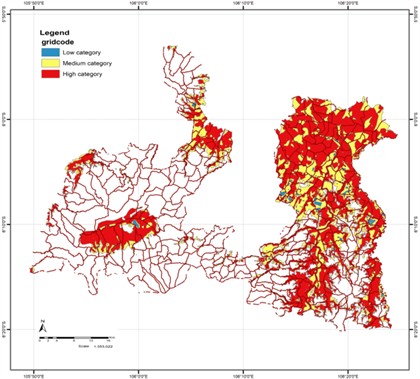
Floods in several areas in Serang Regency occurred from low to high monthly rainfall. Flooding in areas with low rainfall appears in areas with lowland topography. The results of the overlay analysis of flood-prone maps show that 15 sub-districts have the potential to flood. However, of the sub-districts, six sub-districts have an altitude of less than 10 meters above sea level. According to [13] areas with the potential for flooding are affected by several variables, including 30 % rainfall and 10 % land elevation. Based on this, the six sub-districts are predicted to have high flood potential. The sub-districts are Kibin, Kragilan, Kramatwatu, Pomtang, Tirtayasa and Tanara.
3.2. Forecasting floodplains and agricultural production in Serang Regency
Serang Regency has an administrative area of 1,467.35 km2 consisting of 29 sub-districts and 326 villages. The land use arrangement for this area is shown in Fig. 4.
Fig. 4 shows that land in Serang Regency is used for industrial and agricultural development. For the development of agricultural land, there are rivers, dams, lakes, and irrigation systems that cross several areas. In Serang Regency, three rivers pass through: Cidurian, Ciujung, and Cidanau.
The Cidurian River borders the Ciujung watershed and crosses Carenang District. Then, the Ciujung River crosses the districts of Pamarayan, Kragilan, Kibin, and Tanara. Furthermore, the Cidanau River crosses the sub-districts of Ciomas, Padarincang and Cinangka. Meanwhile, the dam is in the district of Pamarayan, while the lake is in the districts of Binuang and Kibin. In supporting agricultural land, there are several irrigation systems in Tanara, Tirtayasa, Pontang, Carenang, Kibin, Bandung, Pamarayan, Binuang, and Kramatwatu Districts.
Land in Serang Regency generally consists of wetlands and dry land. Wetlands in Serang Regency consist of two types, namely swampland and non-wetland types. Swamp-type wetlands are located in Kragilan, Kibin, Bandung and Carenang Districts, while non-wetlands are generally located throughout Serang Regency. Meanwhile, dry land is in the sub-districts of Anyer, Mancak, Ciomas, Padarincang, Waringinkurung and Bojonegara. Non-swamp wetlands are used for agricultural land development, while drylands are used for agriculture and non-agriculture.
Fig. 4Land types in Serang Regency
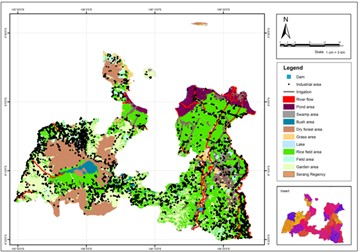
Wetlands and dry lands for agricultural development consist of rice paddies, fields and gardens, while non-agricultural lands are used for ponds and industrial development. Rice fields are generally spread across all sub-districts, and there are 14 with the largest rice field area. The sub-districts in question are Kramatwatu, Pontang, Tirtayasa, Tanara, Lebakwangi, Carenang, Binuang, Cikande, Padarincang, Mancak, Gunungsari, Baros, Petir and Cikeusal. Then, the fields are spread across seven sub-districts: Pulo Ampel, Bojonegara, Anyer, Mancak, Kramatwatu, Pamarayan and Jawilan District. Furthermore, plantation land is mostly spread across 10 sub-districts, namely Cinangka, Anyer, Mancak, Waringinkurung, Gunungsari, Ciomas, Pabuaran, Baros, Petir, Tunjung Teja, and a small part is spread across 5 districts, namely: Pamarayan, Jawilan, Kopo, Kragilan, and Cikande. Meanwhile, ponds are spread across four sub-districts: Pontang, Tirtayasa, Tanara and Pulo Ampel. Several food crops, seasonal vegetables, and fruits are developed on the land above.
Table 3Harvest area and agricultural production in Serang Regency
Year | Area of food crop harvest (ha) | Harvest area of seasonal vegetables and fruits (ha) | Food crop production (ton) | Production of seasonal vegetables and fruits (ku) | Harvest area (ha) |
2014 | 94,226.00 | 3,532.00 | 5,048,101.45 | 209,833.00 | 97,758.00 |
2015 | 92,636.00 | 2,278.00 | 5,339,783.83 | 111,995.00 | 94,914.00 |
2016 | 97,631.00 | 2,278.00 | 5,712,898.01 | 111,995.00 | 99,909.00 |
2017 | 91,529.00 | 2,276.00 | 5,331,954.41 | 111,994.00 | 93,805.00 |
2018 | 83,401.00 | 1,870.00 | 4,485,064.50 | 94,086.00 | 85,271.00 |
2019 | 76,514.52 | 2,195.00 | 3,720,386.92 | 134,616.00 | 78,709.52 |
2020 | 85,193.42 | 2,442.00 | 4,069,927.81 | 203,220.00 | 87,635.42 |
2021 | 82,434.07 | 3,547.00 | 4,149,295.87 | 189,803.00 | 85,981.07 |
2022 | 87,292.86 | 1,968.00 | 4,547,893.66 | 129,037.00 | 89,260.86 |
2023 | 79,934.46 | 1,521.00 | 4,528,765.84 | 66,482.00 | 81,455.46 |
In those ten years, from 2014-2023, 7 types of food crops and 17 types of seasonal vegetable and fruit crops were developed and produced in the Regency. The results of the analysis of the harvest area and agricultural production in the district are shown in Table 3. The table shows that the harvested area for food crops is more significant than seasonal vegetables and fruits. Regarding land conditions, each crop type, food crop, seasonal vegetable, and fruit has a different harvest area. The harvest area of food crops, seasonal vegetables, and fruits in Serang Regency decreased during this period. In 2014, the harvest area of seasonal food crops and vegetables and fruits was 66.49 %; in 2023, it will decrease to 55.40 % of the total area of Serang Regency. That year, the harvested area of food crops decreased from 64.08 % to 54.36 %, while the harvested area of seasonal vegetables and fruits decreased from 2.40 % to 1.03 %. The equation states the model of decreasing the harvest area of food crops in Serang Regency. Then, the model of decreasing the harvested area of seasonal vegetables and fruits is expressed by equations. The decrease in the harvest area of each type of crop has implications for the production of each crop.
Food crop production in Serang Regency is between (76.80-5,318,210.34) tons, with rice production being the most significant and soybean production being the most negligible. Meanwhile, seasonal vegetable and fruit production is between (0.00-40,435.00) quintals (ku), with cucumber production being the most significant and leek production, beans, cauliflower, squash, melon, curly pepper, and watermelon being the most negligible. The results of each crop type, food crops, seasonal vegetables, and fruits, are shown in Fig. 5.
Fig. 5Production of all types of food crops and seasonal vegetables and fruits
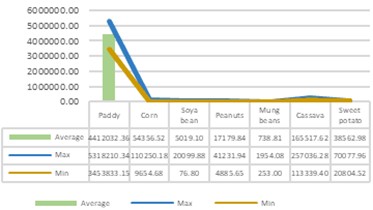
a)
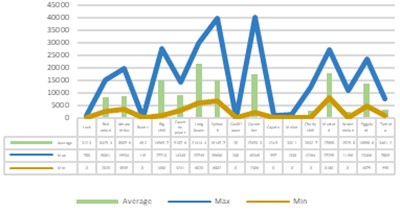
b)
Fig. 5(a) shows that of the seven types of food crops developed in Serang Regency, the most significant production is rice. In Serang Regency, rice production is between (3,453,833.15-5,318,210.34) tons, with an average production of 4,412,032.36 tons. Then, corn and soybean production was between (9,654.68-110,250.18) tons and (76.80-20,099.88) tons, with an average of 54,356.52 tons and 5,019.10 tons, respectively. The production of peanuts and mung beans was between (4,885.65-41,231.94) tons and (253.00-1,954.08) tons, respectively, with an average production of 17,179.84 tons and 738.81 tons. Furthermore, the production of cassava and sweet potatoes is between (113,339.40-257,036.28) tons and (20,804.52-70,077.96) tons, respectively, with an average production of 165,517.62 tons and 38,562.98 tons. Based on the average production, the most significant food crop in Serang Regency is rice production, reaching 94.03 %. Furthermore, in Fig. 5(b), it can be seen that the seasonal production of vegetables and fruits is between (0.00-40435.00) ku, with the most significant production of cucumbers and the most negligible production: leeks, green beans, cauliflower, chayote, and melon. Referring to the average production and land in Serang Regency, of the seven types of food crops, five types can be developed: rice, corn, cassava, sweet potato and peanuts. Meanwhile, of the 17 types of seasonal vegetables and fruits, 12 types have the potential to be developed in Serang Regency. These plants are long beans, Chinese cabbage/mustard greens, cucumbers, kale, chili peppers, cayenne peppers, curly peppers, eggplants, spinach, shallots, tomatoes, and watermelons. The range of the production amount of each crop shows that the production of seasonal food crops and vegetables and fruits in Serang Regency has changed. With the reduction of harvest area for each crop type, the production of each crop has decreased. Using Eq. (7), the production of food crops in Serang Regency decreased by 0.42 %, while seasonal vegetables and fruits decreased by 48.04 %.
The equation can mathematically state the decline in the food crop production model in Serang Regency, while the equation describes the production of seasonal vegetables and fruits. An equation mathematically expresses the model of declining rice production in Serang Regency. Meanwhile, the equation describes a model of declining cucumber production in Serang Regency. The decline in the production of seasonal food crops and vegetables and fruits in Serang Regency is not only due to reduced harvest areas but also crop failure or crop failure. Crop failure or crop failure, among others, occurs due to planting patterns and climatic conditions. Generally, the harvest of rice plants or planting time in Serang Regency is carried out in January or February. Rainfall trends show that in those two months, rainfall in Serang Regency is included in the high category. Then, referring to the function of land and the region's topography, rice plants in Serang Regency are generally developed in lowland areas. Based on this, agricultural land in the two months has the potential to flood.
In Serang Regency, floods are predicted to have high potential in January and February, while spatially have high potential in several areas in six sub-districts. It is predicted that several areas from the six sub-districts above have high flood potential in January and February. Because each sub-district has a different area and area of agricultural land, the area of agricultural land affected by floods in each sub-district is different. It is predicted that 2,902.80 ha of agricultural land in Serang Regency has the potential to flood according to the analysis of the flood potential area. The area of agricultural land that is predicted to have the potential for flooding is: Kibin District is predicted to have 335.10 ha of agricultural land, Kragilan District is predicted to have 363.3 ha, Kramatwatu is predicted to have 485.90 ha, Pontang is predicted to have 580.90 ha, Tirtayasa is predicted to have 644.60 ha and Tanara District is predicted to have 493.00 ha. Referring to the land function of the six districts it is a potential area for crop development.
Plants grown in Serang Regency have different harvest areas. Table 3 shows that food crops have a harvest area of 79,934.46 ha, while seasonal vegetables and fruits have a harvest area of 1,521.00 ha. Using the crop area reduction model, it is predicted that by 2025, the harvest area of food crops will be reduced to 76,524.60 ha, and the harvest area of vegetables and fruits will be reduced to 1,398.20 ha. Referring to the results of the analysis of the distribution of Gumbel and Mononobe, which shows annual rainfall in Serang Regency for a 2-year return period, it is predicted that 2025 will have rainfall with low to very high rainfall and flood potential. If floods occur in the six sub-districts above, it is predicted that in that year, the harvest area of food crops will decrease from 79,934.46 ha to 73,679.90 ha while the harvest area of seasonal vegetables and fruits will decrease from 1,521.00 ha to 1,343.05 ha. Meanwhile, the harvested area of rice plants will decrease from 78,144.46 ha to 72,775.46 ha, and the harvested area of cucumbers will decrease from 178 ha to 175.76 ha. The decrease in the harvest area of food crops, vegetables, and fruits will have implications for the production of each type of crop.
The production of each type of crop depends on the harvest area and land productivity. For rice crops, national rice productivity is between (52.26-52.85) ku/ha, while rice productivity in Banten Province is between (50.38-54.19) ku/ha [14]. Meanwhile, rice productivity in Serang Regency is 55.57 ku/ha and cucumber productivity is 64.58 [9]. Based on this productivity and the trend of decreasing harvest area, it is predicted that rice production in 2025 in Serang Regency, with a harvest area of 73679.90 ha, will produce 4,094,389.60 tons. Meanwhile, cucumbers with a harvest area of 176.60 will produce 11,405.58 ku. If there is a flood in six sub-districts that year, it is predicted that rice production in Serang Regency, with a harvest area of 72,775.46 ha, will produce 4,044,132.09 tons. Meanwhile, cucumber production with a harvest area of 175.76 ha is estimated to produce 11,351.33 ku. Based on the downward trend, rice production in Serang Regency decreased by 1.23 %, while cucumber production decreased by 0.48 %.
4. Conclusions
Rainfall in Serang Regency varies from low to high, with the highest rainfall occurring in January and February and the lowest in June to October. Forecast results using the Gumbel Distribution and Mononobe Equation show a recurring precipitation pattern over a two-year return period with an increase of 5-18 %. Spatially, high rainfall mainly occurs in Anyer and Cinangka Districts, while topographically, six sub-districts with an altitude of less than 10 meters above sea level - Kibin, Kragilan, Kramatwatu, Pontang, Tirtayasa, and Tanara - have a high risk of flooding, especially during the rainy season. Because the six sub-districts are agricultural land, the floods can potentially reduce the production of food crops, vegetables, and seasonal fruits developed in this area. The production of main food crops such as rice, corn, cassava, sweet potatoes, and peanuts decreased by 0.42 %. In contrast, seasonal vegetables and fruits such as cucumbers, chilies, and tomatoes experienced a more significant decrease of 48.04 %. If floods occur, rice production is estimated to fall by 1.23 %, while cucumbers will fall by 0.48 %. A more adaptive planting pattern is needed to overcome this impact and maintain agricultural productivity.
References
-
T. Kizuka, H. Mikami, S. Kameyama, S. Ono, and H. Suzuki, “Hydrological environment affects the nutrient retention and runoff function of naturally re-wetted agricultural peatland in lowland river floodplain,” Science of The Total Environment, Vol. 857, p. 159483, Jan. 2023, https://doi.org/10.1016/j.scitotenv.2022.159483
-
J. Pérez et al., “Agricultural impacts on lowland tropical streams detected through leaf litter decomposition,” Ecological Indicators, Vol. 154, p. 110819, Oct. 2023, https://doi.org/10.1016/j.ecolind.2023.110819
-
“Food crop harvest area by type of food crop in banten province (hectares), 2023,” BPS Banten Province, BPS Banten Province, 2024.
-
P. Bhattacharyya et al., “Turn the wheel from waste to wealth: Economic and environmental gain of sustainable rice straw management practices over field burning in reference to India,” Science of The Total Environment, Vol. 775, p. 145896, Jun. 2021, https://doi.org/10.1016/j.scitotenv.2021.145896
-
S. M. Shaheen et al., “Sustainable applications of rice feedstock in agro-environmental and construction sectors: A global perspective,” Renewable and Sustainable Energy Reviews, Vol. 153, p. 111791, Jan. 2022, https://doi.org/10.1016/j.rser.2021.111791
-
G. Blasch et al., “Ethiopian Crop Type 2020 (EthCT2020) dataset: crop type data for environmental and agricultural remote sensing applications in complex Ethiopian smallholder wheat-based farming systems (Meher season 2020/21),” Data in Brief, Vol. 54, p. 110427, Jun. 2024, https://doi.org/10.1016/j.dib.2024.110427
-
Q. Zhou, K. Guan, S. Wang, J. Hipple, and Z. Chen, “From satellite-based phenological metrics to crop planting dates: Deriving field-level planting dates for corn and soybean in the U.S. Midwest,” ISPRS Journal of Photogrammetry and Remote Sensing, Vol. 216, pp. 259–273, Oct. 2024, https://doi.org/10.1016/j.isprsjprs.2024.07.031
-
B. M. Kumar and T. K. Kunhamu, “Nature-based solutions in agriculture: a review of the coconut (Cocos nucifera L.)-based farming systems in Kerala, “the Land of Coconut Trees”,” Nature-Based Solutions, Vol. 2, p. 100012, Dec. 2022, https://doi.org/10.1016/j.nbsj.2022.100012
-
“Rice productivity by regency/city in banten province (quintal/hectare), 2021-2023,” BPS Serang Regency, 2024.
-
T. Turkeltaub et al., “A review of models for simulating the soil-plant interface for different climatic conditions and land uses in the Loess Plateau, China,” Ecological Modelling, Vol. 474, p. 110173, Dec. 2022, https://doi.org/10.1016/j.ecolmodel.2022.110173
-
H. D. Nguyen et al., “A novel flood risk management approach based on future climate and land use change scenarios,” Science of The Total Environment, Vol. 921, p. 171204, Apr. 2024, https://doi.org/10.1016/j.scitotenv.2024.171204
-
N. N. Kourgialas and G. P. Karatzas, “A national scale flood hazard mapping methodology: The case of Greece – Protection and adaptation policy approaches,” Science of The Total Environment, Vol. 601-602, pp. 441–452, Dec. 2017, https://doi.org/10.1016/j.scitotenv.2017.05.197
-
R. Handika et al., “Identifying environmental variables in potential flood hazard areas using machine learning approach at Musi Banyuasin Regency, South Sumatra,” in IOP Conference Series: Earth and Environmental Science, Vol. 1201, No. 1, p. 012037, Jun. 2023, https://doi.org/10.1088/1755-1315/1201/1/012037
-
“Rice Harvest Area, Production, and Productivity by Province, 2024,” BPS Indonesia, 2025.
About this article

The authors have not disclosed any funding.
The datasets generated during and/or analyzed during the current study are available from the corresponding author on reasonable request.
Yayat Ruhiat: conceptualization, methodology, formal analysis, writing-review and editing. John Chaidir: data curation, funding acquisition, resources, project administration. Halim Akbar: investigation, validation, writing-original draft. Yudi Guntara: software, visualization, formal analysis.
The authors declare that they have no conflict of interest.
