Abstract
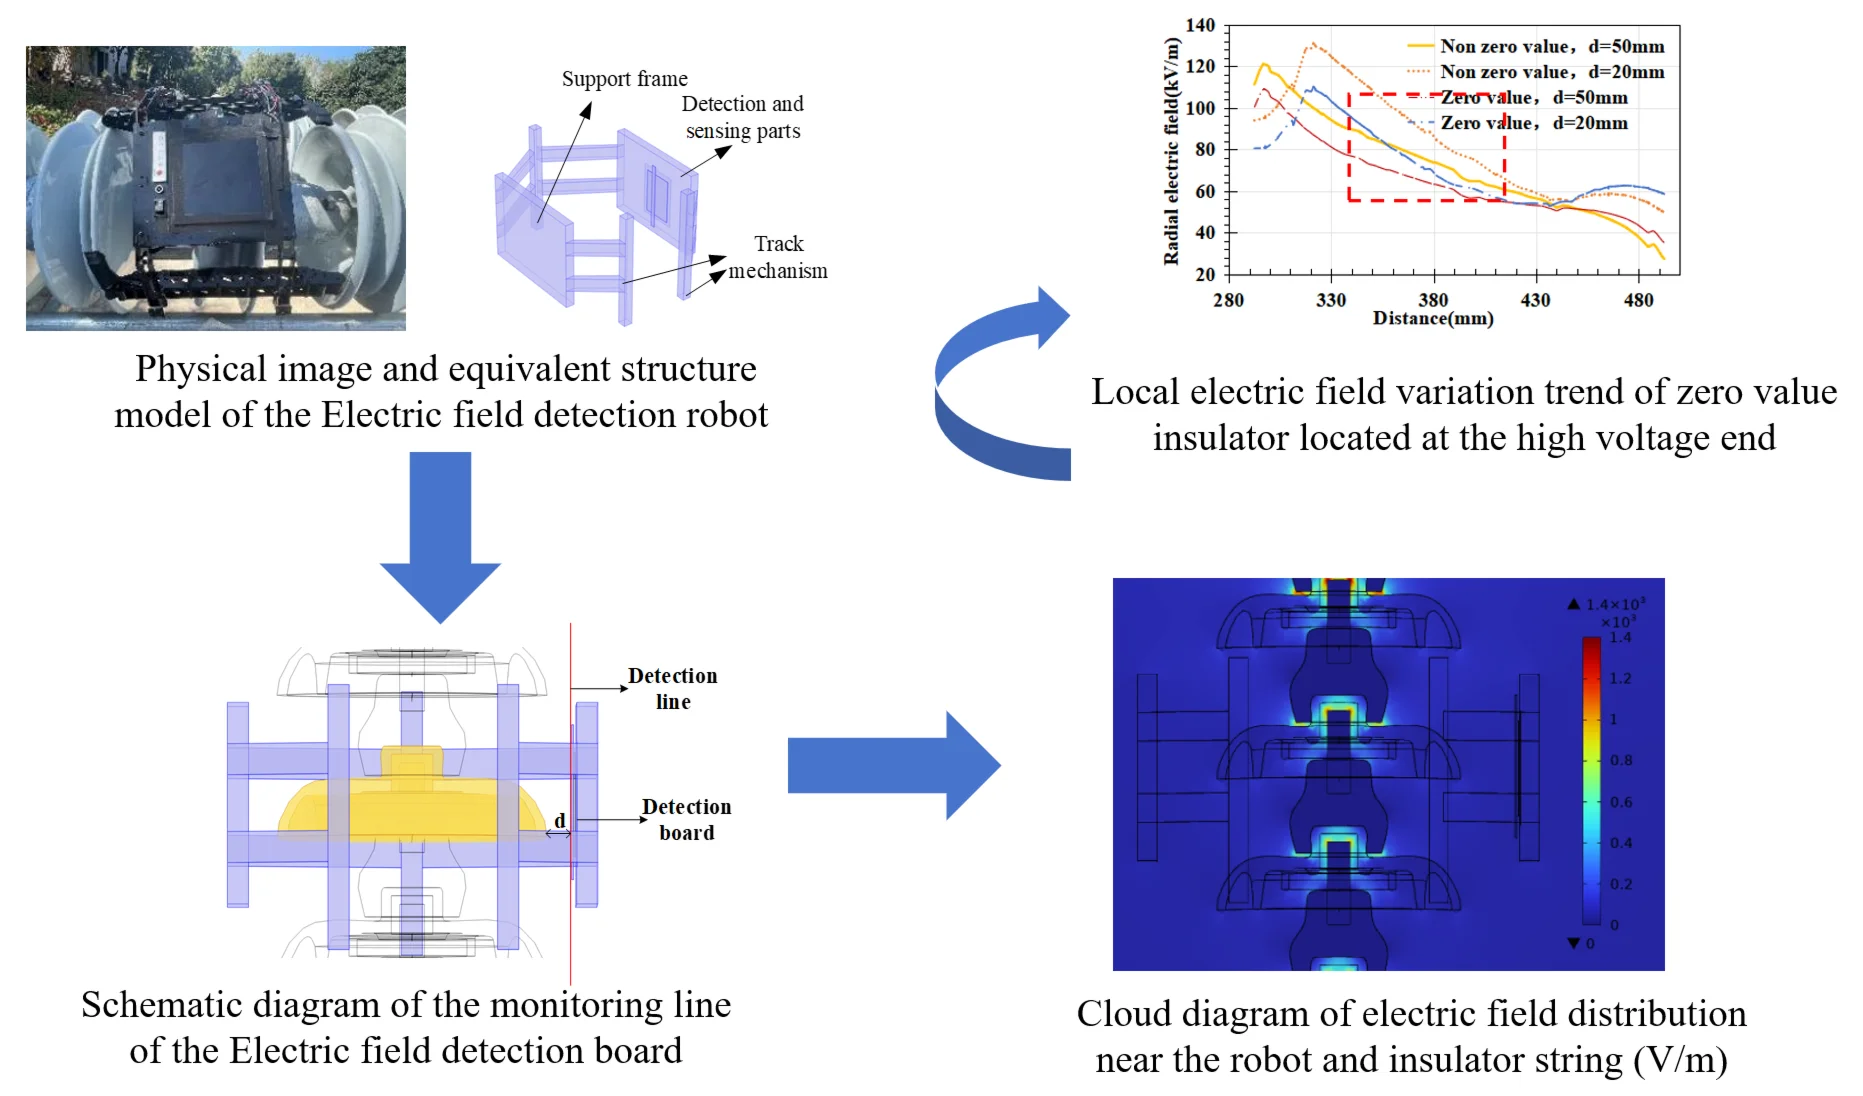
Zero value insulators pose a threat to the safe and stable operation of transmission lines. By walking with tracked robots, the local electric field distribution of insulator strings can be quickly detected and measured, thereby identifying zero value pieces. To clarify the influence of robot architecture on the electric field measurement of insulator strings and propose a fast identification criterion for zero-value recognition, this paper establishes a true model of 220 kV insulator strings and an equivalent model of robots. The electric field distribution characteristics of the robot structure working on insulator strings were analyzed through finite element simulation, and the influence of factors such as robot material and size on local electric field distortion characteristics was studied, especially the local electric field variation laws under zero and non-zero values. The model's validity is confirmed through relevant simulations, ensuring its reliability for practical applications. Further detailed simulation analysis was conducted on the local electric field distortion characteristics of the robot architecture at different positions of the insulator string, and the electric field measurement characteristics of the zero value insulator were obtained. Based on the simulation results of the 220 kV insulator string, a criterion for measuring and identifying zero value insulators for 500 kV was proposed and applied to 500 kV. The research results reveal the influence of electric field detection and measurement robots on local electric field distortion of zero value insulators, which can provide technical support for intelligent operation and maintenance of external insulation in power transmission and distribution.
Highlights
- This paper constructed a 220 kV insulator string model and robot equivalent model. Finite element simulation showed robot-induced electric field distortion is mainly at its ends, while the middle field reflects zero-value insulator changes, providing a model basis for zero-value insulator detection.
- This paper studied key robot parameters' impact: higher material dielectric constant exacerbates end distortion but barely affects zero-value detection; robot size alters local electric field trends via detection distance, guiding structural optimization.
- This paper proposed a zero-value identification criterion using electric field standard deviation in an 8 cm characteristic area. This criterion was successfully extended to the detection of 500 kV insulators, supporting intelligent external insulation maintenance.
1. Introduction
Insulators play a role in insulation support in transmission lines, with large quantities and complex types. Their operating status has a significant impact on the safety of the power grid [1-7]. Due to its excellent mechanical performance, ceramic insulators are often used for high-voltage overhead line tension strings. However, under the influence of long-term electromagnetic environment corrosion, mechanical stress, and product quality, they are prone to deterioration and form zero value insulators, greatly reducing insulation margin. When the number of zero value insulator pieces in a string of insulators reaches a certain level, severe accidents such as flashover and string dropping will occur. The degradation of insulators poses a potential threat to the stable operation of the power grid, therefore it is necessary to perform status detection on them [8-12].
At present, zero value detection technology for insulators can be summarized into two categories: electrical parameter detection and non electrical parameter detection methods. The non electric parameter detection method mainly relies on infrared thermal imaging [13-16], which has been studied earlier and more extensively. For example, reference [9] proposed a non-contact outdoor ceramic insulator string zero value detection method based on infrared image matching, mainly proposing an improved SIFT (Scale Invariant Feature Transform) method. The test results show that this method is effective for detecting the zero resistance value of outdoor insulator strings. However, the actual use effect of infrared method is not ideal, and it is greatly affected by environmental factors. The electrical parameter detection methods mainly include insulation resistance method, spark gap method, distributed voltage method, and electric field method. The electric parameter detection method is accurate and not affected by environmental factors, but the biggest disadvantage is that it requires tower climbing and pole operation, which is inconvenient for operating ultra-high voltage long strings.
For example, some optical sensors can be used to collect electrical signals such as electric fields, voltages, currents, etc., achieving stable collection of high-voltage signals under electrical isolation [17-20]. Some scholars have developed electric field sensors using optical sensing technology, which obtain the electric field distribution of insulator strings through track type moving mechanisms and drones, thereby identifying zero value pieces. However, both of these methods can only be applied to suspension strings and cannot be controlled on tension strings. Thus, existing robot systems still have some limitations in insulator detection. For example, the maintenance cost of robots using lightweight rails as mobile carriers and lifting mechanisms is too high [21, 22]. Wheeled legged robots are difficult to handle offset and incompletely tensioned horizontal insulator strings and have poor adaptability [23]. In many fields of energy engineering, robots, AI, and related algorithms are also widely used to solve various problems [24-27].
Therefore, this article designs a lightweight tracked robot suitable for tension string crawling, which can detect the local electric field of insulators through electric field sensing. Compared to the existing detection robots mentioned earlier, this robot can be wirelessly controlled and walk stably, while the detection results are more accurate. And established a true model of the 220 kV insulator string and a simple model of the tracked robot, studied the electric field distribution characteristics of the zero value insulator, analyzed the influence of the robot structure on the local electric field distortion characteristics, and provided a basis for identifying zero value insulators based on electric field detection.
2. Simulation model of electric field distribution with robot architecture
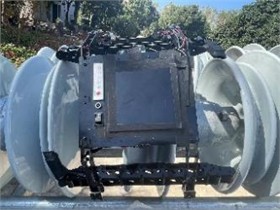
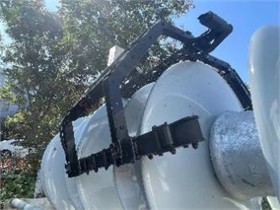
As shown in Figs. 1-2, Fig. 1 is a physical image of the electric field detection robot when detecting the zero value of tension insulators. Fig. 2 shows the simulation model of the designed robot. The total weight of the fiber optic sensing zero value detection robot designed in this paper is about 2.5kg. It is controlled by the robot controller to move forward and backward, and the zero value detection robot can transmit detection data to the detection terminal display. The overall framework of the robot is made of fiberglass and plastic materials, and the walking mechanism is completed by three track wheels.
Fig. 1Physical image of the insulator Electric field detection robot
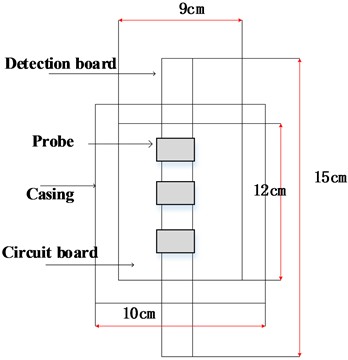
The detection device mainly consists of a detection probe, a silicon board, and a housing. The detection probe is arranged on the detection board, which is made of polyethylene material. Design the dimensions of the detection device's casing: length 150 mm, width 100 mm, height 40 mm. Circuit board dimensions: 120 mm in length, 90 mm in width, and 2 mm in height. The detection board is 150 mm long, 10 mm wide, and 2 mm high, used to fix passive crystal electric field probes. The size of the detection device is shown in Fig. 3.
Fig. 2Equivalent structure model of the electric field detection robot
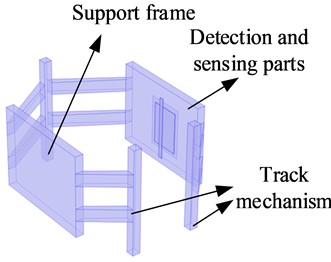
Fig. 3The structure of the electric field detection board
This article takes the 220 kV voltage level scenario as the research object, selects 14 XP-160 insulators as representatives, and obtains the local spatial distortion characteristics after generating zero value insulators through electrostatic field simulation. The structural parameters of the insulators are shown in Table 1. Simulate zero value by penetrating steel caps, porcelain parts, and steel foot. The basic properties of the material are shown in Table 2. The values in Table 2 refer to the material library parameters provided in reference [28] and COMSOL. According to the relative dielectric constant and conductivity of different materials in Table 2, the parameter values of the corresponding materials in the simulation model are set for different regions. In the setting of boundary conditions, zero charge is applied to the metal fittings in the air domain and low-voltage end, and a single-phase operating voltage amplitude of 179 kV is applied to the wire and metal fittings in the high-voltage end. The simulation model is shown in Fig. 5.
This paper considers the modeling details of the track mechanism and simplifies it. Due to the large computational complexity and difficulty in convergence caused by 3D modeling, the track is set as two rectangles adjacent to the insulator in this paper. For internal components, due to their distance from the probe that detects the electric field (the probe is a separate part extending outside the circuit board) and the significantly larger electric field at the insulator, the impact of internal components on the electric field detected by the probe is not significant. Therefore, internal components have been ignored.
Table 1Structural parameters of simulation model
Structural height (mm) | Disc diameter (mm) | Steel cap length (mm) | Length of metal fittings (mm) |
2170 | 255 | 100 | 90 |
Table 2Basic properties of different materials
Dielectric material | Relative dielectric constant | Conductivity (S/m) |
Air | 1 | 1×10-13 |
Porcelain | 6 | 1×10-11 |
Cement | 14 | 1×10-11 |
Gold fittings | 1000 | 5.998×10⁶ |
Wire | 2000 | 1×10⁸ |
3. The influence of robot structure on electric field
3.1. The influence of robot architecture on the distribution of probe electric field
The difference in the overall electric field distribution curve of the normal insulator string when the fixed robot is located at the low voltage end (12th piece). As shown in Fig. 4, the distance between the electric field detection board and the edge of the insulator umbrella skirt is taken as 50 mm, represented by d in the figure. The monitoring red line is taken from the value in the air 0.1 mm above the detection board. The dielectric constant of the detection robot is set to 2.5.
Fig. 4Schematic diagram of the monitoring line of the electric field detection board
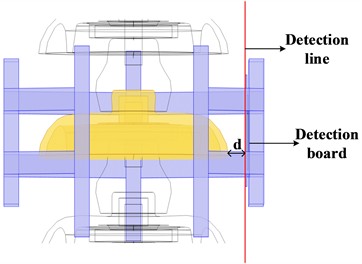
Fig. 5Cloud diagram of electric field distribution near the robot and insulator string (V/m)
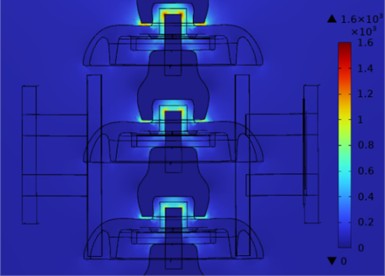
a) Without considering robots
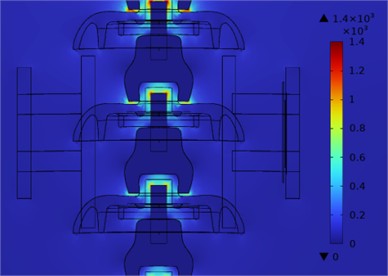
b) Consider robots
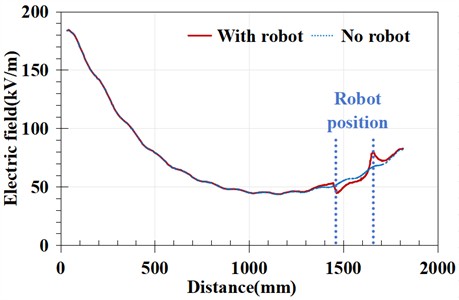
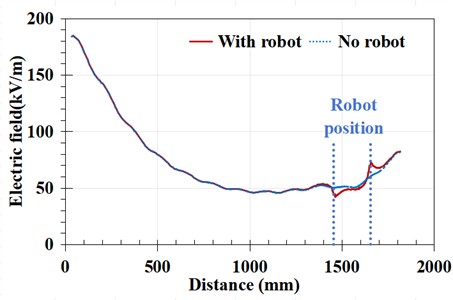
As shown in Fig. 5, when the robot is in the twelfth position, its presence or absence has little effect on the overall electric field distribution. Regardless of whether the current insulator piece (twelfth piece) is zero or not, the presence of the robot architecture will not have a significant impact on the equipotential surface of the electric field distribution. According to the simulation results, the electric field distribution curve along the detection line of the electric field detection board was obtained, as shown in Fig. 6.
As shown in the figure, the presence of the robot only affects the distribution of the entire electric field at the two ends of its framework. As shown in Fig. 6(a), when the twelfth piece is non-zero, the field strength near the end of the robot frame on the detection line decreases and increases to a certain extent. When the dielectric constant of the robot frame is set to 2.5, the decrease and increase are about 20-35 %; As shown in Fig. 6(b), when the twelfth piece is zero, regardless of the presence or absence of a robot, the local electric field distribution at the position of the second piece changes. Similarly, the decrease and increase in field strength near the end of the robot frame on the detection line are approximately 30 %.
Fig. 6Overall electric field distribution comparison of the insulator string
a) The twelfth piece is a non-zero value
b) The twelfth piece is a zero value
Comparing the two figures, it can be seen that when the twelfth piece is a zero value insulator, the local electric field distribution undergoes distortion, changing from a monotonic upward trend in Fig. 6(a) to a gentle trend in Fig. 6(b). Excluding the electric field at both ends of the robot, when there is a robot present, the electric field change at the middle position under the zero value insulator also shows the same trend. It can be seen that the electric field distortion caused by the robot body structure only affects the detection of zero value insulators at its ends, while the electric field distribution in the middle can still reflect the local electric field changes caused by zero value insulators.
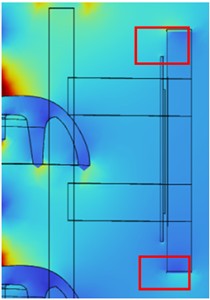
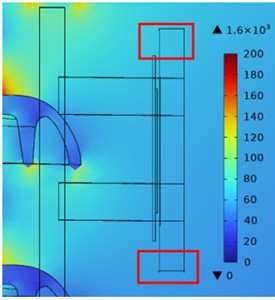
Analyze the influence of robot architecture on local electric field distribution, enlarge Fig. 5, and change the numerical range to obtain the local electric field cloud map as shown in Fig. 7.
As shown in the figure, although the robot has a relatively small impact on the overall electric field distribution around the insulator, its end effects cannot be ignored. When the dielectric constant of the robot is 2.5, compared to when it is equivalent to air, the electric field strength inside the robot decreases to a certain extent, and the field strength at the end decreases near the high voltage side and rises near the low voltage side. This may be due to the different directions of the electric field lines at both ends and the uneven dielectric constant.
Fig. 7Local electric field cloud map of robot parts (V/m)
a) The dielectric constant of the robot is 2.5
b) The dielectric constant of the robot is 1
3.2. Detecting the influence of the main material of the structure
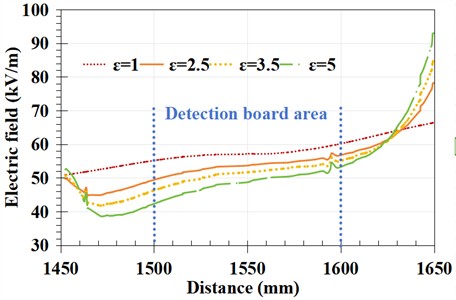
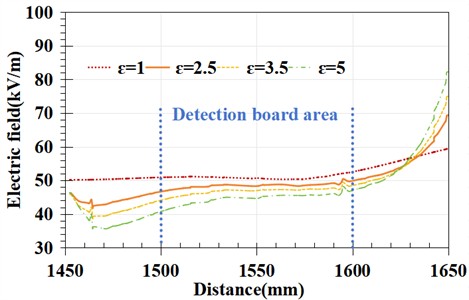
The electric field detection structure mentioned earlier is made of a material with a dielectric constant of 2.5. The dielectric constant may vary in actual situations. Change the dielectric constant of the main material of the robot, taking values of 1, 2.5, 3.5, and 5 respectively, to study the differences in local electric field distribution curves when the robot is in the twelfth low-voltage end.
Fig. 8Electric field distribution of the fiber-optic electric field detection board surface
a) The twelfth piece is a non-zero value
b) The twelfth piece is a zero value
The distance between the electric field detection board and the edge of the insulator umbrella skirt is taken as 50 mm, and the monitoring red line is taken as the value in the air 0.1 mm above the detection board. For a more intuitive comparison, only the local electric field distribution curve of the electric field detection insulator piece area is provided.
Comparing Figs. 7-8, it can be seen that amplifying the local electric field distribution does indeed result in distortion of the electric field at both ends of the robot frame, and the distortion pattern is not affected by the dielectric constant, that is, it decreases on the side closer to the high voltage end and increases on the side closer to the low voltage end; However, as the dielectric constant increases, the degree of distortion becomes more severe, and the decrease and increase in the end are greater.
Comparing the surface electric field distribution of the fiber optic electric field detection board under zero and non-zero values, taking the dielectric constant of 2.5 as an example, when the twelfth piece is zero, the trend of electric field intensity changes from 50-58 kV/m under non-zero values to 48-50 kV/m. It can be seen that the presence of zero value pieces makes the trend of electric field distribution change smoother. When the dielectric constant is 3.5 and 5, this variation pattern still applies. Therefore, the influence of the dielectric constant of the robot frame material on zero value detection can be ignored.
3.3. The influence of robot architecture dimensions
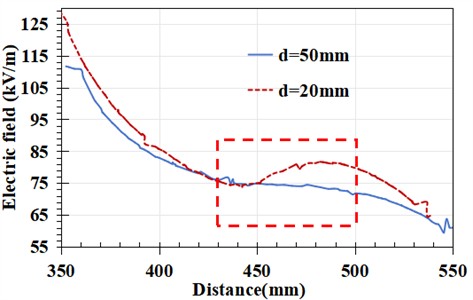
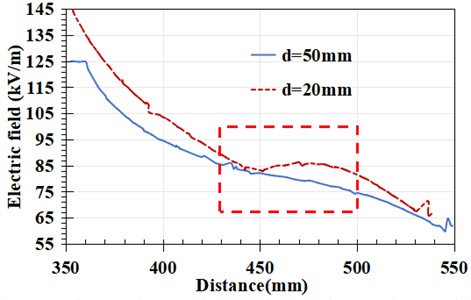
The dielectric constant of the main material of the robot frame is fixed at 3.5, and the robot is located at the fourth insulator position. Change the size of the robot frame so that the surface of the fiber optic electric field detection board is 20 mm away from the edge of the insulator umbrella skirt, while keeping other parameters unchanged. Compare the differences in local electric field distribution values on the monitoring red line under different robot frame sizes.
Fig. 9Electric field distribution of the board surface under different robot size
a) The fourth piece is a zero value
b) The fourth piece is a non-zero value
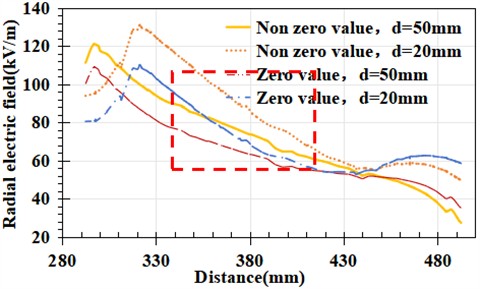
As shown in the Fig. 9, when the detection distance is 50 mm, as mentioned earlier, in the case of zero value, the surface electric field change trend of the fiber optic electric field detection board slows down and flattens, especially in the upper half of the detection board area, as shown in the red box. For a detection distance of 20 mm and a zero value, the electric field curve in the upper half of the detection insulator piece area shows obvious depressions and protrusions, which are significantly different from the non-zero value situation. From this, it can be seen that the recognition criteria for zero value detection will vary for robot architectures of different sizes. The different sizes of robots change the detection distance, thereby altering the trend of local electric field changes and affecting the characteristics of electric field distribution at zero values.
4. Characteristic electric field analysis of detection location
Due to the presence of zero value insulators, the radial component plays a dominant role in the trend of electric field strength variation. Therefore, the following analysis only considers the radial component. Study the difference in local electric field distribution between zero and non-zero value insulator strings when the robot is in the high-voltage end (4th piece) position, that is, take a section of the detection red line in Fig. 4 corresponding to the robot position for local analysis. There are two situations where the distance between the detection board and the edge of the insulator umbrella skirt is 20 mm and 50 mm, respectively.
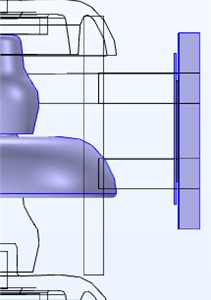
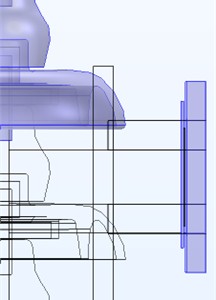
Divided into three detection positions for comparison, they are the robot facing the umbrella skirt (as shown in Fig. 4), facing the steel cap, and facing the steel foot (as shown in Fig. 10). The simulation results are shown in Fig. 11.
Fig. 10Schematic diagram of different detection positions
In Fig. 11(a), the highlighted area represents the length range of the detection board, and it can be seen from the figure that the 80 mm detection feature area is located exactly in the middle of the detection board section. In the characteristic region, whether d is 20 mm or 50 mm, there is a significant change in the radial electric field component under zero values. For Fig. 11(a), when 20 mm, at zero value, the radial electric field in the characteristic region first decreases and then increases, with a variation range of 55.2-64.7 kV/m; Under non-zero values, the radial electric field in the characteristic region also shows a certain trend of first decreasing and then increasing, but the magnitude of the change is relatively large compared to zero values, ranging from 55.3-68.4 kV/m. When 50 mm, at zero value, the radial electric field variation amplitude in the characteristic area is very small, between 54.7-58.3 kV/m; At non-zero values, the radial electric field in the characteristic region decreases monotonically, with a decrease range of 69.1-49.7 kV/m.
For Fig. 11(b), when the robot position moves to the vicinity of the steel cap, the position of the feature area changes. Compared with the umbrella skirt position, the radial electric field changes significantly under zero and non-zero values. When 20 mm, under non-zero values, the radial electric field in the characteristic region monotonically decreases, with a variation amplitude of 40.4-68.5 kV/m; At zero value, the radial electric field in the characteristic region shows a clear trend of first increasing and then decreasing, rising from 66.2 kV/m to 72.5 kV/m, and then decreasing to about 60 kV/m. When 50 mm, at zero value, the radial electric field in the characteristic region monotonically decreases, with a variation amplitude between 49.4-61.7 kV/m; Under non-zero values, the monotonic decrease of radial electric field in the characteristic region is greater, ranging from 61.6-41.3 kV/m.
In Fig. 11(c), within the feature region, the radial electric field distribution exhibits only a numerical difference between the zero and non-zero states, and its variation trend is consistently monotonically decreasing. Compared with the other two cases, there are no obvious distinguishable features.
Fig. 11Local electric field variation trend of zero value insulator located at the high voltage end
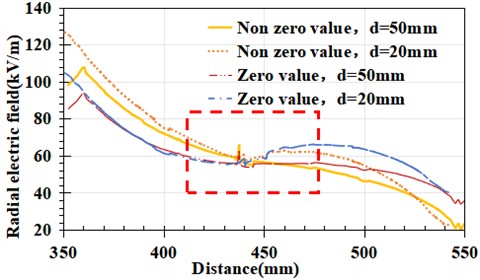
a) Facing the umbrella skirt
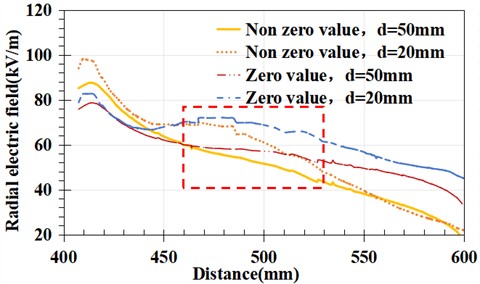
b) Facing the steel cap
c) Facing the steel foot
5. Discussions
Assuming the total length of the detection point is L, the number of probes is , and the minimum arrangement spacing is , as shown in Fig. 12. In order to facilitate detection and reduce circuit redundancy, it is desirable for to be as small as possible, while cannot be too small, otherwise it will not reflect the trend of changes within the feature area, resulting in misjudgment.
According to the simulation results mentioned earlier, can be taken as 8 cm, while the width of the electric field probe itself is approximately 1.5 cm, so can be taken as 3. Obtain the radial electric field values on the detection line of the feature area under 3 probes, and calculate their standard deviation as the identification criterion for the change trend. The results are shown in Tables 3-5.
Fig. 12Schematic diagram of point selection for electric field strength values
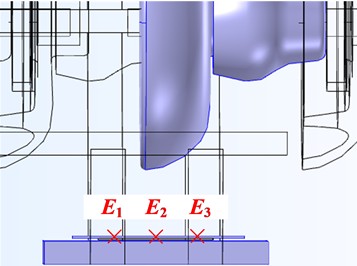
Table 3Numerical values of electric field strength with d= 50 mm (kV/m)
Electric field | E1 | E2 | E3 | |
High voltage end umbrella skirt | Zero value | 52.1 | 54.4 | 53.7 |
Non zero value | 48.6 | 43.4 | 39.9 | |
High voltage end steel foot | Zero value | 45.9 | 42.7 | 42.4 |
Non zero value | 51.4 | 41.6 | 36.3 | |
Medium voltage end umbrella skirt | Zero value | 18.3 | 19.3 | 19.2 |
Non zero value | 14.9 | 11.8 | 10.3 | |
Medium voltage end steel foot | Zero value | 13.2 | 12.1 | 12.4 |
Non zero value | 15.4 | 10.6 | 7.7 | |
Low voltage end umbrella skirt | Zero value | 8.7 | 6.6 | 7.9 |
Non zero value | 13.0 | 13.1 | 14.8 | |
Low voltage end steel foot | Zero value | 14.4 | 13.9 | 15.0 |
Non zero value | 20.8 | 20.9 | 22.2 | |
Table 4Electric field strength values at d= 100 mm (kV/m)
Electric field | E1 | E2 | E3 | |
High voltage end umbrella skirt | Zero value | 51.7 | 49.3 | 43.9 |
Non zero value | 47.2 | 40.2 | 31.9 | |
High voltage end steel foot | Zero value | 45.1 | 43.8 | 43.1 |
Non zero value | 46.2 | 41.0 | 37.2 | |
Medium voltage end umbrella skirt | Zero value | 17.7 | 15.2 | 12.0 |
Non zero value | 15.2 | 10.1 | 5.4 | |
Medium voltage end steel foot | Zero value | 13.4 | 12.6 | 12.1 |
Non zero value | 13.6 | 11.0 | 8.7 | |
Low voltage end umbrella skirt | Zero value | 16.1 | 18.3 | 20.2 |
Non zero value | 17.3 | 22.6 | 26.1 | |
Low voltage end steel foot | Zero value | 19.5 | 20.7 | 21.9 |
Non zero value | 17.7 | 21.3 | 24.6 | |
Table 5Summary of standard deviation
Standard deviation σ | 50 mm (E2\E3) | 100 mm (E1\E2\E3) | |
High voltage end umbrella skirt | Zero value | 0.6 | 4.0 |
Non zero value | 2.5 | 7.6 | |
High voltage end steel foot | Zero value | 2.5 | 1.0 |
Non zero value | 10.7 | 4.5 | |
Medium voltage end umbrella skirt | Zero value | 0.1 | 2.8 |
Non zero value | 1.1 | 4.9 | |
Medium voltage end steel foot | Zero value | 0.6 | 0.7 |
Non zero value | 5.5 | 2.5 | |
Low voltage end umbrella skirt | Zero value | 0.9 | 2.0 |
Non zero value | 1.2 | 4.5 | |
Low voltage end steel foot | Zero value | 0.8 | 1.2 |
Non zero value | 0.9 | 3.4 | |
The use of different probes and distances (E2/E3 for 50 mm and E1/E2/E3 for 100 mm) is due to the different positions of the probes from the insulator, resulting in different changes in the characteristics of the electric field. Through simulation results and comparative calculations, it was found that using E2/E3 at 50 mm and E1/E2/E3 at 100 mm for characterization yields the best results.
Obviously, when the standard deviation of the electric field values detected by the three probes is less than 1.3, or the standard deviation of E2 and E3 is less than 1.0, it can be considered that the insulator at the current detection position is a zero value piece.
The limitations of the model established in this article are discussed as follows. The robot model established in this article is an equivalent model, and some complex structures and details of the robot may not be fully presented. There may be various electromagnetic interference sources in the actual transmission line environment, such as nearby power equipment, communication equipment, etc. The electromagnetic fields generated by these electromagnetic interference sources may couple with the electric field of the insulator, interfering with the robot’s detection of the zero value electric field of the insulator. However, the existence of these external electromagnetic interference sources was not considered in the simulation process, resulting in a relatively idealized electric field environment in the simulation.
6. Conclusions
This article establishes a true model of a 220 kV insulator string and an equivalent model of a robot. The electric field distribution characteristics of the robot structure working on insulator strings were simulated and analyzed using finite element method. The following conclusions were drawn from the study:
1) The presence of robots has a certain impact on the overall electric field distribution of insulators. However, the electric field distortion caused by the robot body structure only affects the detection of zero value insulators at its ends, while the electric field distribution in the middle can still reflect the local electric field changes caused by zero value insulators.
2) With the increase of the dielectric constant of robot materials, the degree of electric field distortion becomes more severe, and the decrease and increase in the end are greater. However, the influence of the dielectric constant of the robot frame material on zero value detection can be ignored. The different sizes of robots change the detection distance, thereby altering the trend of local electric field changes and affecting the characteristics of electric field distribution at zero values.
3) The amplitude of the radial component of the spatial electric field can be used as a characteristic electric field for zero value recognition. The characteristic area is located within a range of about 8 cm in the middle of the robot detection board, and the feature detection position is directly facing the steel cap or umbrella skirt. Taking into account the two detection distances of far and near (20 mm, 50 mm), when the detection robot faces the steel cap, the characteristic electric field for zero – value recognition on the detection insulator piece has a non-monotonic distribution. In contrast, when facing the umbrella skirt, the electric field distribution trend of along the insulator piece becomes flat.
4) In the case analysis of the expanded 500 kV insulator, it was found that zero value insulators can be identified through the following electric field quantification features: when 50 mm, the standard deviation of the measured electric field amplitude by the drone at the position facing the umbrella skirt is less than 1.3, and when 100 mm, the standard deviation of the measured electric field amplitude facing steel foot is less than 1.
5) The robot system is highly feasible for large-scale operation. The lightweight tracked robot can adapt to different voltage levels, especially for UHV transmission lines. It precisely measures local electric fields without manual tower climbing, reducing risks and labor intensity. Though initial costs are relatively high, the system saves expenses by preventing fault-related losses. It can also integrate with existing monitoring systems like optical fiber temperature measurement and video surveillance, sharing data on intelligent operation and maintenance platforms for real-time monitoring. Furthermore, its customizability and upgradeability enhance applicability.
References
-
X. Han, J. Nan, F. Huo, and H. Song, “Study on external insulation durability test of composite cross arm insulator,” in IET Conference Proceedings, Vol. 2021, No. 15, pp. 438–443, Mar. 2022, https://doi.org/10.1049/icp.2022.0491
-
D. Zhang et al., “Research on the prediction method of porcelain insulator pollution degree based on electric field monitoring,” Electric Power Systems Research, Vol. 233, p. 110488, Aug. 2024, https://doi.org/10.1016/j.epsr.2024.110488
-
X. Liu, X. Miao, H. Jiang, and J. Chen, “Box-point detector: a diagnosis method for insulator faults in power lines using aerial images and convolutional neural networks,” IEEE Transactions on Power Delivery, Vol. 36, No. 6, pp. 3765–3773, Dec. 2021, https://doi.org/10.1109/tpwrd.2020.3048935
-
Z. Wang, X. Liu, H. Peng, L. Zheng, J. Gao, and Y. Bao, “Railway insulator detection based on adaptive cascaded convolutional neural network,” IEEE Access, Vol. 9, pp. 115676–115686, Jan. 2021, https://doi.org/10.1109/access.2021.3105419
-
H. Song, Y. Wang, X. Liu, H. Wang, X. Han, and Z. Wu, “Study on design and optimal control of long-distance wireless power supply system based on high-voltage lines,” in 2021 3rd International Conference on Electrical Engineering and Control Technologies (CEECT), pp. 114–120, Dec. 2021, https://doi.org/10.1109/ceect53198.2021.9672643
-
X. Zhang et al., “InsuDet: A fault detection method for insulators of overhead transmission lines using convolutional neural networks,” IEEE Transactions on Instrumentation and Measurement, Vol. 70, pp. 1–12, Jan. 2021, https://doi.org/10.1109/tim.2021.3120796
-
M. Zhou, B. Li, J. Wang, and S. He, “Fault detection method of glass insulator aerial image based on the improved YOLOv5,” IEEE Transactions on Instrumentation and Measurement, Vol. 72, pp. 1–10, Jan. 2023, https://doi.org/10.1109/tim.2023.3269099
-
D. Wei, B. Hu, C. Shan, and H. Liu, “Insulator defect detection based on improved Yolov5s,” Frontiers in Earth Science, Vol. 11, Feb. 2024, https://doi.org/10.3389/feart.2023.1337982
-
H. He, Z. Hu, B. Wang, D. Luo, W.-J. Lee, and J. Li, “A contactless zero-value insulators detection method based on infrared images matching,” IEEE Access, Vol. 8, pp. 133882–133889, Jan. 2020, https://doi.org/10.1109/access.2020.3011170
-
S. Hao, B. An, X. Ma, X. Sun, T. He, and S. Sun, “PKAMNet: a transmission line insulator parallel – gap fault detection network based on prior knowledge transfer and attention mechanism,” IEEE Transactions on Power Delivery, Vol. 38, No. 5, pp. 3387–3397, Oct. 2023, https://doi.org/10.1109/tpwrd.2023.3274823
-
M. He, L. Qin, X. Deng, and K. Liu, “MFI-YOLO: multi-fault insulator detection based on an improved YOLOv8,” IEEE Transactions on Power Delivery, Vol. 39, No. 1, pp. 168–179, Feb. 2024, https://doi.org/10.1109/tpwrd.2023.3328178
-
N. Jain, J. Bedi, A. Anand, and S. Godara, “A transfer learning architecture to detect faulty insulators in powerlines,” IEEE Transactions on Power Delivery, Vol. 39, No. 2, pp. 1002–1011, Apr. 2024, https://doi.org/10.1109/tpwrd.2024.3353203
-
H. He, W.-J. Lee, D. Luo, and Y. Cao, “Insulator infrared image denoising method based on wavelet generic gaussian distribution and MAP estimation,” IEEE Transactions on Industry Applications, Vol. 53, No. 4, pp. 3279–3284, Jul. 2017, https://doi.org/10.1109/tia.2017.2691309
-
H. Li et al., “Research on infrared thermal imaging zero-value insulator identification based on GA-SVM algorithm,” in 2024 5th International Seminar on Artificial Intelligence, Networking and Information Technology (AINIT), pp. 1694–1698, Mar. 2024, https://doi.org/10.1109/ainit61980.2024.10581775
-
X. Li et al., “The application of infrared thermal imaging technology in state detection of porcelain insulators,” in 2023 3rd International Conference on Energy, Power and Electrical Engineering (EPEE), pp. 476–480, Sep. 2023, https://doi.org/10.1109/epee59859.2023.10352009
-
Y. Zhang, J. Tian, M. Yang, Y. Yi, Y. Wang, and Y. Zhang, “Screening of zero-value insulators infrared thermal image features based on binary logistic regression analysis,” in 2018 2nd IEEE Conference on Energy Internet and Energy System Integration (EI2), pp. 1–4, Oct. 2018, https://doi.org/10.1109/ei2.2018.8582434
-
Z. Guo, Z. He, T. Lei, W. Shi, and S. Xie, “An optical electric field sensor for AC and DC electric field measuring,” in 2021 International Conference on Advanced Electrical Equipment and Reliable Operation (AEERO), pp. 1–5, Oct. 2021, https://doi.org/10.1109/aeero52475.2021.9708273
-
J. E. Toney, A. G. Tarditi, P. Pontius, A. Pollick, S. Sriram, and S. A. Kingsley, “Detection of energized structures with an electro-optic electric field sensor,” IEEE Sensors Journal, Vol. 14, No. 5, pp. 1364–1369, May 2014, https://doi.org/10.1109/jsen.2013.2295004
-
C. Zhang, S. Xie, and M. Zuo, “Electric field sensor using multi-tapered optical fibers and electro-optic polymer,” in 2019 International Applied Computational Electromagnetics Society Symposium – China (ACES), pp. 1–2, Aug. 2019, https://doi.org/10.23919/aces48530.2019.9060478
-
J. Zhang and F. Chen, “An electro-optic sensor for measurement of intensive DC electric field,” IEEE Photonics Journal, Vol. 14, No. 2, pp. 1–7, Apr. 2022, https://doi.org/10.1109/jphot.2022.3153644
-
W. Jiang et al., “Autonomous location control of a robot manipulator for live maintenance of high-voltage transmission lines,” Industrial Robot: An International Journal, Vol. 44, No. 5, pp. 671–686, Aug. 2017, https://doi.org/10.1108/ir-08-2016-0220
-
M. Zou, R. C. Luo, J. Xiong, W. Li, and Q. W. Pan, “Feasibility research and develop of working detecting robot for low/zero insulator,” High Voltage Apparatus, Vol. 52, pp. 160–166, 2016, https://doi.org/10.13296/j.1001-1609.hva.2016.06.026
-
H. L. Deng, Q. Lu, L. Chen, D. Dai, and F. C. Li, “Detection for composite insulator based on ultrasonic guided wave,” High Voltage Engineering, Vol. 42, pp. 1236–1244, 2016, https://doi.org/10.13336/j.1003-6520.hve.20160405030
-
K. Khaled and M. K. Singla, “Predictive analysis of groundwater resources using random forest regression,” Journal of Artificial Intelligence and Metaheuristics, Vol. 9, No. 1, pp. 11–19, Jan. 2025, https://doi.org/10.54216/jaim.090102
-
M. Mahmoud, “A review on waste management techniques for sustainable energy production,” Metaheuristic Optimization Review, Vol. 3, No. 2, pp. 47–58, Jan. 2025, https://doi.org/10.54216/mor.030205
-
A. Sharma et al., “Identification of photovoltaic module parameters by implementing a novel teaching learning based optimization with unique exemplar generation scheme (TLBO-UEGS),” Energy Reports, Vol. 10, pp. 1485–1506, Nov. 2023, https://doi.org/10.1016/j.egyr.2023.08.019
-
E.-S. M. El-Kenawy, N. Khodadadi, S. Mirjalili, A. A. Abdelhamid, M. M. Eid, and A. Ibrahim, “Greylag Goose Optimization: Nature-inspired optimization algorithm,” Expert Systems with Applications, Vol. 238, p. 122147, Mar. 2024, https://doi.org/10.1016/j.eswa.2023.122147
-
M. Jenithra, G. Sudalaimani, E. Raja Sekaran, D. Swathi, K. Kumar, and R. V. Maheswari, “Investigation of Electric field distribution on a 33kV polymeric insulator under polluted conditions using Finite Element Method,” in 4th International Conference on Circuits, Control, Communication and Computing (I4C), pp. 231–235, Dec. 2022, https://doi.org/10.1109/i4c57141.2022.10057935
About this article
Science and Technology Project Funding of State Grid Jiangsu Extra-High Voltage Company (CGY-2024010).
We are grateful to Hao Chen for his valuable feedback and discussions. We would also like to thank our members for their constant support and encouragement throughout this research.
The datasets generated during and/or analyzed during the current study are available from the corresponding author on reasonable request.
Pengbo Li and Xuechun Han performed the measurements, Hengdong Song and Linmin Pan were involved in planning and supervising the work, Pengbo Li and Xuechun Han processed the experimental data, performed the analysis, drafted the manuscript and designed the figures. Linmin Pan and Ziyang Zhang contributed to sample preparation. Ziyang Zhang aided in interpreting the results and worked on the manuscript. All authors discussed the results and commented on the manuscript.
The authors declare that they have no conflict of interest.
