Abstract
The degradation of structural stiffness is quantifiable through changes in the natural vibration period of the structure, facilitating the assessment of damage severity. The structural damage curve is defined by the variation in the natural vibration period of a structural system attributable to member stiffness degradation during severe earthquakes. In this study, two representative earthquake records from the February 2023 Mw 7.8 earthquake in Türkiye were selected for the elastoplastic time-history analysis of a standard ten-story reinforced concrete frame structure. Additionally, a method for defining the plastic hinge was employed to derive the structural damage curve. Analysis of varying damage levels under the influence of two seismic waves was conducted using the T-f response spectrum. The analysis results reveal: (a) Structural damage curves effectively reflect the plastic development via natural vibration period variations. (b) The T-f response spectrum encompasses amplitude, spectrum, and duration characteristics of ground motion, which, when integrated with damage curves, more intuitively delineates the structural damage mechanism. (c) Diverse impacts on the structure by seismic waves, even with identical peak values, are attributed to their distinct time-frequency characteristics. Additionally, five seismic records matching the site type of the representative records of the Mw 7.8 earthquake in Türkiye were selected from the Pacific Earthquake Engineering Research Center ground motion database in the United States. Regression analysis was utilized to derive the proposed structural damage curves at peak ground motion accelerations of 125 gal, 220 gal, 400 gal, and 620 gal. The study also includes a validation of the elastoplastic time-history analysis results with experimental data, enhancing the credibility of the findings.
Highlights
- The variation curve of the natural vibration period of a structural system due to the stiffness degradation of the members under strong earthquakes is defined as the structural damage curve.
- Two typical earthquake records from the February 2023 Mw 7.8 earthquake in Türkiye were selected for elastoplastic time history analysis of a typical ten-story reinforced concrete frame structure in Türkiye.
- The method to define the plastic hinge was used to obtain the structural damage curve.
- The different damage levels of the structure under the action of the two seismic waves were analyzed by combining the time-frequency response spectrum.
- The proposed structural damage curves at peak ground motion accelerations of 125 gal, 220 gal, 400 gal, and 620 gal were obtained through regression analysis.
1. Introduction
On February 6, 2023, southeastern Türkiye was struck by two consecutive violent earthquakes, measuring Mw 7.8 and 7.6, respectively, which resulted in over 50,000 fatalities and led to the collapse of more than 5,000 reinforced concrete buildings. Consequently, this disaster refocused attention on the seismic design of buildings, typically analyzed through static and dynamic methods. To this day, many scholars are still conducting various studies on this earthquake.
According to The Turkish Ministry of Interior Disaster and Emergency Management Authority (AFAD) [1] and TBEC-2018 [2], the Mw 7.8 and Mw 7.6 earthquakes caused widespread structural damage primarily due to long-period ground motion effects and soft-story failures in mid-to-high-rise buildings. Over 5,000 reinforced concrete buildings collapsed, indicating serious deficiencies in both construction quality and compliance with modern seismic codes. The disaster’s severity was exacerbated by fault rupture characteristics and inadequate seismic detailing in existing structures. Engineering assessments by Balun, Bilal [3] highlight that reinforced concrete buildings with non-ductile detailing and insufficient column-beam joint reinforcement suffered the most extensive damage. Li [4] suggest that soft-story collapses and foundation settlement failures were common causes of building destruction.
In the early 20th century, a seismic design method based on static theory was introduced in Japan. This theory assumes the structure to be rigid when estimating seismic forces, neglecting the dynamic characteristics of earthquakes and the dynamic behaviors of the structure. The input ground motion derives from the maximum acceleration as estimated from historical damage. Assumptions include the mass and acceleration being distributed along the height direction, eliminating the need for structural modeling and dynamic response analysis. The design principle relies solely on the use of static allowable stresses. Under conditions lacking records of strong earthquakes, houses designed with this theory survived the Great Kanto Earthquake in Japan, and the U.S. seismic code similarly adopted this theory at the time. However, this theory fails to account for the spectral properties of ground motion, leading to longstanding controversy.
The first strong earthquake recording device was developed in the United States in 1932, with the first strong earthquake record being obtained in 1933, followed by a series of earthquake records, including the record of El Centro. This development laid the foundation for the response spectrum theory, as proposed by Housner [5] and Biot [6] in the 1940s. Response spectrum theory utilizes the mode decomposition method to analyze a given structure, thereby simplifying the process of solving complex seismic responses of multi-degree-of-freedom structural systems. In contrast to the static theory method, the response spectrum better reflects the spectral characteristics of ground motion. As a result, its application is widespread in seismic design specifications across various countries. To date, numerous scholars continue to research and refine the response spectrum theory [7-10]. However, the response spectrum method remains, at its core, a pseudo-static approach. While it accounts for the maximum amplitude and the frequency spectrum in each frequency band of the structure, it overlooks the duration. Seismic investigations have revealed that some structures designed based on the response spectrum theory experienced severe damage in earthquakes without exceeding the estimated intensity, highlighting the necessity of considering duration in design. Furthermore, the response spectrum method neglects the randomness of seismic effects. Moreover, it does not consider the redistribution of internal forces in a structure due to changes in its dynamic properties, such as period, damping, and vibration mode, as the structure approaches plasticity during rare earthquakes. Additionally, the response spectrum method presumes uniform ground motions across all structural supports, thereby overlooking the interaction between the foundation and the soil layer.
In the 1970s and 1980s, advancements in electronic computation technology and experimental techniques occurred, along with an increase in the number of strong seismic observatory stations. Consequently, more comprehensive studies of linear and nonlinear processes in various types of structures under seismic action were undertaken, advancing seismic design based on dynamic theory. The high-frequency part of the response spectrum is represented by horizontal bands, which are suitable for structures with minimal response to high-order vibration modes. However, for high-rise structures, the impact of high-order vibration modes tends to be more significant, yielding more conservative outcomes from the response spectrum method. During time-range analysis, the peaks in the high-frequency bands of ground motion are not simplified into horizontal bands. As a result, the peak seismic response at the top of a high-rise building or in other locations significantly affected by high-order vibration modes appears more realistic than the results of the response spectrum analysis. While elastoplastic time history analysis accounts for the duration characteristics of ground motion, it proves to be computationally intensive and time-consuming. The accuracy of the results obtained is contingent upon the delineation accuracy of the model units, the intrinsic relationships of the materials, and the selection of seismic waves. Furthermore, elastoplastic time history analysis demands high-level hardware due to the considerable volume of data required for processing. Given its computational complexity, elastoplastic time history analysis is reserved for major engineering projects, including nuclear power plants, large dams, large bridges, and high-rise buildings. Additionally, inputting the time histories of ground motion is crucial when utilizing structural dynamic analysis methods for seismic analysis. Whether utilizing modified natural seismic waves or man-made seismic waves derived from field seismic safety assessments, the seismic design merely reflects the structure’s seismic resistance reliability under the specific ground motion of the selected time history. Resilience in seismic design has gained significant attention in recent years, particularly in the context of post-earthquake recovery and structural performance. This study contributes to the growing body of knowledge on seismic resilience by proposing a novel approach to structural damage assessment. For a comprehensive discussion on resilience in seismic design, refer to the recent study by Yiyao Shen, et al. [11].
The Pushover method was initially proposed in 1975 by Freeman et al. [12], but initially garnered little attention. Performance-based seismic design theory emerged in the 1990s [13], captivating Japanese and European peers. Subsequently, national codes, including the U.S. Applied Technology Council’s ATC-40, the Federal Emergency Management Agency’s FEMA-273 & 274, and those of Japan and China, embraced performance-based seismic design. Pushover analysis is founded on two basic assumptions: 1) The structure's response correlates with an equivalent single-degree-of-freedom system, dominated by the first vibration mode; 2) The structure's shape vector stays unchanged during the seismic response. During large earthquakes, the structure transitions to an elastic-plastic state, which hinders effective estimation of the structure's performance. In contrast, Pushover analysis enables the estimation of nonlinear deformations in structures and members, with results that are more reflective of actual conditions than those of load-bearing design. Compared with nonlinear time history analysis, Pushover analysis yields more consistent outcomes, minimizing result variability and notably reducing both analysis time and workload. However, while Pushover analysis involves monotonically increasing loads, the forces in real earthquakes fluctuate in both magnitude and direction. Although the analysis assumes isotropic load and structural response, real seismic excitation and structural responses may not adhere to this isotropy. As the structure transitions into the nonlinear phase, changes in stiffness and vibration modes occur, yet Pushover analysis presumes constant vibration modes, which can lead to discrepancies in outcomes. Pushover analysis overlooks inertia forces generated by mass, a significant divergence from time history analysis, particularly in the loading and unloading paths of the hinges.
2. Definition of the structural damage curve
This study aims at developing a method that reflects the effects of ground motion reciprocation and the high-order vibration mode without necessitating complex elastoplastic time history analysis. Simultaneously, this method takes into account the elastic-plastic accumulation in structures attributable to ground motion duration. Under seismic loading, the stiffness of a building structure begins to degrade as soon as a member enters the plastic deformation phase, subsequently impacting the stiffness of the entire structure. It is often the case that structural damage is indicated by the degradation of structural element stiffness [14]. Numerous indicators commonly employed to assess damage, including ductility and drift ratios, fail to account for the effects of strong vibration duration, cumulative inelastic deformation, or energy dissipation within the structure [15].
Earthquakes tend to occur in clusters in many regions around the world characterized by complex fault systems. The repeated shaking typically results in accumulative damage to the affected structures. In structural systems, damage accumulation leads to increased degradation in stiffness and a reduction in strength. Many existing analytical tools for modeling RC structures do not include the critical damage features necessary to account for stiffness and strength degradation due to repeated earthquake loading. As a result, these tools prove inadequate for analyzing the response of structures in regions susceptible to recurrent earthquake hazards [16, 17].
Guo et al. [18] developed a damage model focused on stiffness degradation for reinforced concrete members and structures, utilizing fiber beam-column elements. Damage indicators for concrete and steel fibers are determined by the initial reloading modulus degradation and the low-cycle fatigue law. Damage assessment for the section, member, floor, and structure involved evaluating the degradation of section bending stiffness, rod end bending stiffness, floor lateral stiffness, and structure lateral stiffness, respectively. Ni et al. [19] conducted experimental investigations and modeling on the stiffness degradation of shear walls under cyclic loading. They proposed a four-phase stiffness degradation model, delineated by the crack point, yield point, peak point, and limit point, along with a method to calculate the values for each phase. Using a four-linear stiffness degradation model, analytical curves for wall specimens were derived and then compared to experimental stiffness degradation curves. Results indicated an acceleration in stiffness degradation with increasing drift ratios. Hirotoshi et al. [20] proposed simple equations for assessing the extent of structural damage in high-rise residential buildings following strong ground motions. These equations utilize ambient vibration recordings to estimate stiffness degradation rates and peak inter-story drift ratios, as opposed to using recordings from strong seismic events for high-rise reinforced concrete buildings subjected to strong earthquakes. Hamidia et al. [21] introduced an image-based method to quantify the residual stiffness in reinforced concrete members after seismic damage. Historically, damage detection in frame structures has primarily focused on identifying damage to beam and column elements. Research has demonstrated that beam-column joints in frame structures exhibit a higher susceptibility to damage than other structural components. Damage to joints may manifest as a reduction in the rigidity of beam-column connections. Thus, detecting damage in a frame structure with joint damage entails identifying changes in joint connection stiffness, in addition to the stiffness of beams and columns.
During strong earthquakes, certain structural members initially undergo plastic deformation, succeeded by localized stiffness degradation. This stiffness degradation progressively intensifies with ongoing seismic activity, culminating in member failure. Subsequent collapse and overall structural destruction ensue, further exacerbating stiffness degradation. The calculation of the natural vibration period for a spring oscillator system in an ideal state proceeds as follows:
where represents the system's natural vibration period, denotes the mass of the oscillator, and signifies the spring stiffness. Changes in the natural vibration period, , can quantify the extent of structural stiffness degradation, , thereby gauging the structure's damage level. Based on this, the curve depicting variations in due to stiffness degradation in structural members under seismic activity is termed the structural damage curve.
3. Typical structural damage curves of the earthquake in Türkiye
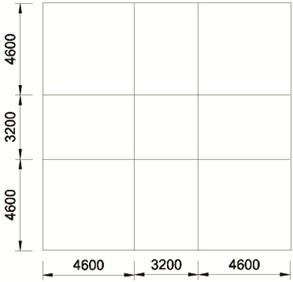
Most of the buildings in Türkiye’s epicenter lack seismic design, making it difficult to quantify. Therefore, this paper selects a 10-storey reinforced concrete building [2] as the research object. The model’s first floor stands at 3.8 m, with subsequent floors each measuring 3.1 m in height. Fig. 1 displays the model’s perspective view, while Fig. 2 presents the pan view of a standard story. It is assumed that the column footings are ideally bonded to the ground, ensuring a solid foundation for the structural analysis. The section size is 400×400 mm for columns and 300×250 mm for beams. The dimensions and material properties of the beams and columns were chosen based on typical values for buildings.
It states that the minimum characteristic compressive strength of concrete used in buildings in seismic zones is 20 MPa [2]. Therefore, the characteristic compressive strength of concrete was set to 20 MPa, mass density 2700 kg/m3, modulus of elasticity 30 GPa, and Poisson’s ratio . Reinforcement tensile strength 300.0 MPa, mass density 77.0 t/m3, elastic modulus 200.0 GPa.
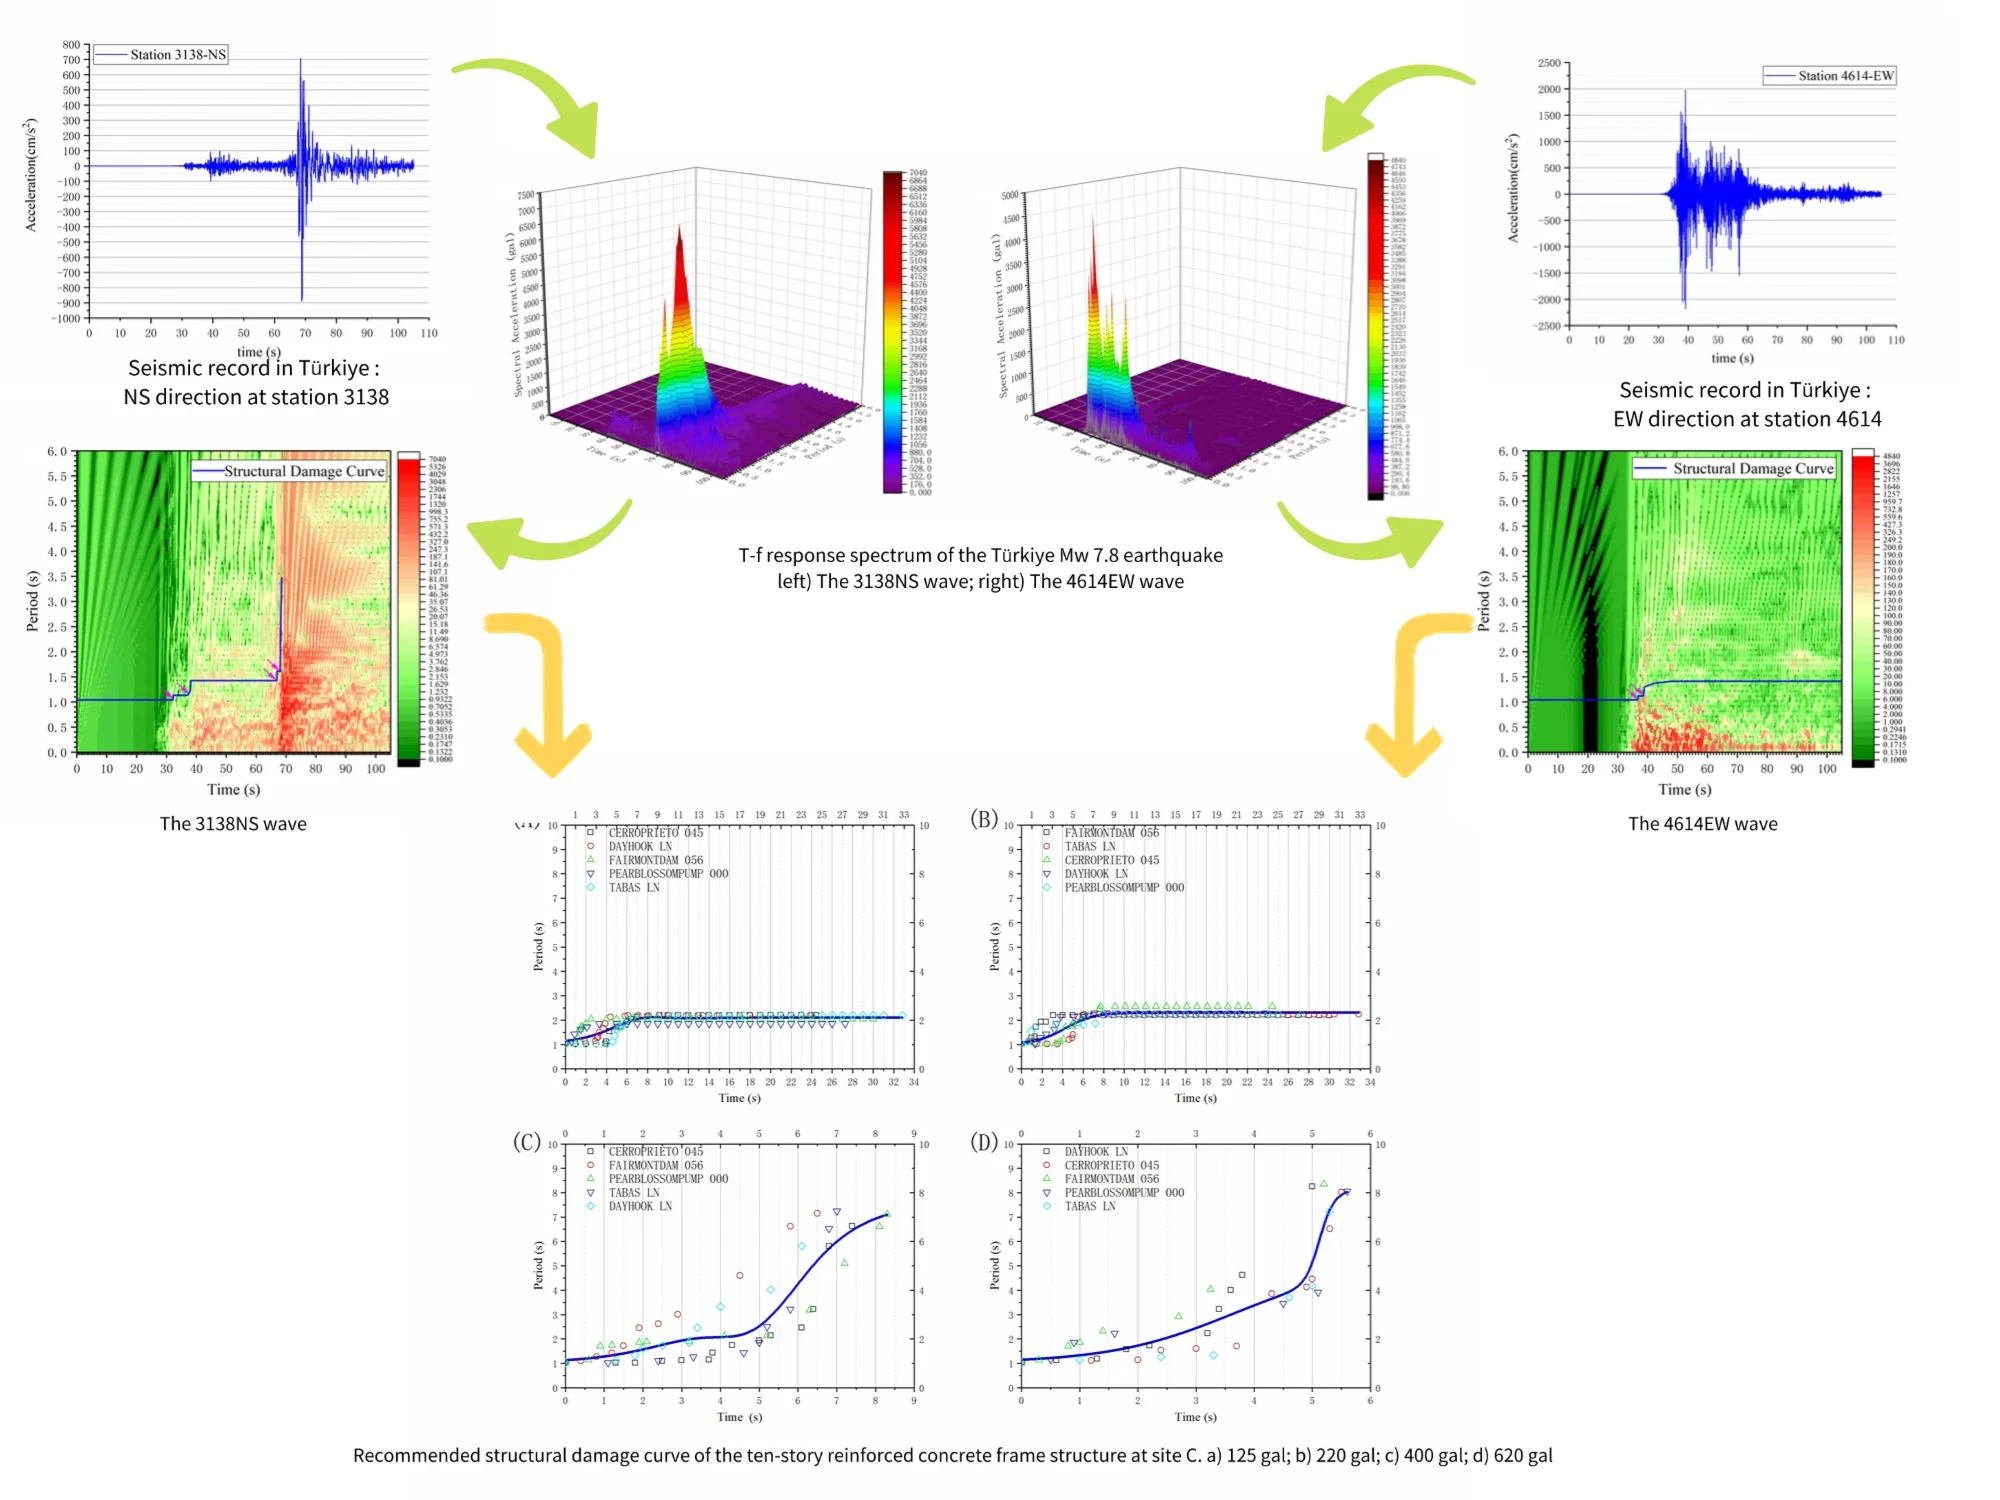
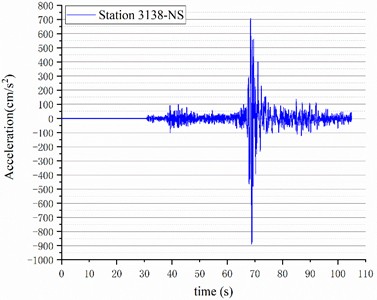
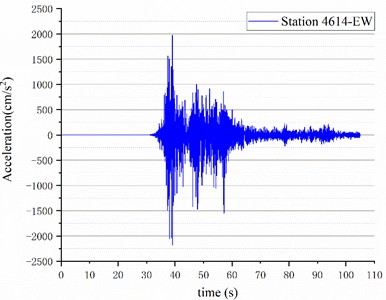
The input ground motions included the north-south wave from station 3138 (3138NS wave) and the east-west wave from station 4614 (4614EW wave) during the Mw 7.8 earthquake in Türkiye, as illustrated in Fig. 3. For the 3138NS wave, the peak acceleration reached 888.7 gal, while the 4614EW wave’s peak acceleration was 2178.7 gal. To underscore the cumulative damaging effects of ground motion duration () and natural vibration period () on the structure, this study adjusted the peak acceleration of the 3138NS wave to match that of the 4614EW wave. A detailed comparison of the selected earthquake records from the US Pacific Earthquake Engineering Research Center database with the actual site conditions in Türkiye is provided, highlighting the similarities and differences.
Fig. 1Perspective view of the frame
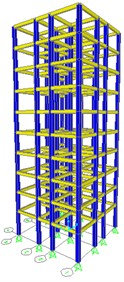
Fig. 2Pan view of the standard storey (mm)
The ten-story reinforced concrete frame structure underwent elastoplastic time history analysis using the 3138NS wave, as depicted in Fig. 4. To simulate stiffness degradation in the plastic stage, plastic hinges are placed near the endpoint nodes of beams and columns. This approach enables identification of the sequence of member yielding and points of concentrated plastic deformation during rare earthquakes, thereby generating the structural damage curve for the entire structure. Yielding plastic hinges are marked in pink, dark blue for immediate occupancy capacity levels, light blue for life safety, yellow (green) for collapse prevention (indicating the onset of bearing capacity loss), and orange and red for failure [22].
Fig. 3Typical seismic record of the Mw 7.8 earthquake in Türkiye: a) NS direction at station 3138, b) EW direction at station 4614
a)
b)
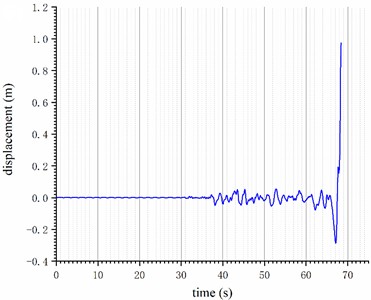
Exposed to the 3138NS wave, the frame structure exhibited pink plastic hinges in four bottom-level middle beams at 32.3 seconds. By 38.0 seconds, pink plastic hinges had progressed from the bottom to the middle of the structure, affecting a total of 36 beams with plastic deformation. At 67.0 seconds, hinge yielding was evident in 90 % of the beams, with dark blue plastic hinges appearing in eight bottom-level beams, yet the structure remained in an immediate occupancy state; by 68.1 seconds, light blue plastic hinges, signaling a risk to life safety, began appearing on the structure. From 68.2 to 68.4 seconds, yellow plastic hinges indicative of potential collapse appeared at the structure’s bottom level, rapidly progressing upward and culminating in the structure’s complete collapse at 68.5 seconds. The top displacement time history curve, as shown in Fig. 5(a), vividly illustrates the rapid increase in top-level displacement at the moment of the structure's collapse.
Fig. 4Plastic hinge development processes of the ten-story reinforced concrete frame structure subjected to the 3138NS wave
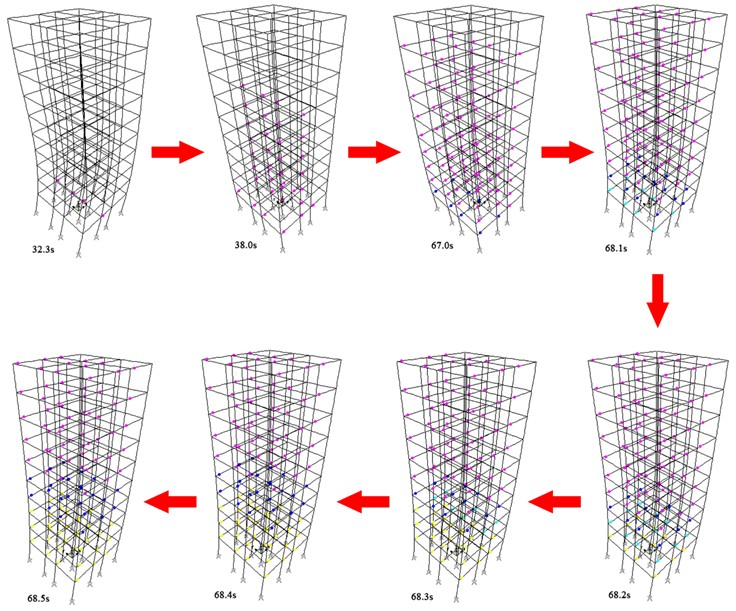
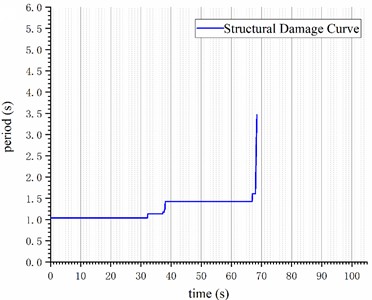
Fig. 5Elastoplasticity time history analysis results of the structure under the 3138NS wave: a) top displacement time history curve; b) structural damage curve
a)
b)
The modal analysis revealed that the fundamental period of the structure is 1.04 seconds. The structural damage curve, derived from the sequence of plastic hinge development, is calculated and illustrated in Fig. 5(b). The structural damage curve clearly depicts the damage development process within the structure. It is categorized into three distinct phases: a) A first step jump from 32.3 seconds to 37.8 seconds; b) A second step jump from 37.9 seconds to 66.9 seconds; c) A rapid ascent following a brief step jump from 67.0 seconds to 68.5 seconds.
Fig. 6Plastic hinge development processes of the ten-story reinforced concrete frame structure subjected to the 4614EW wave
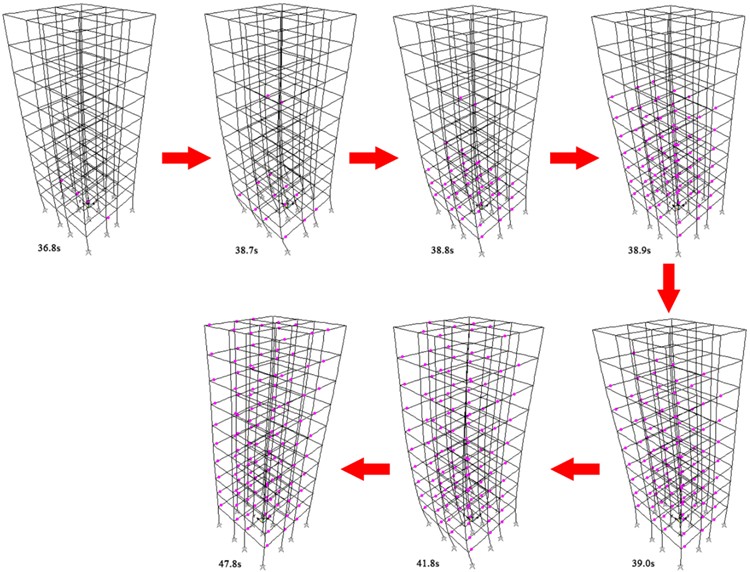
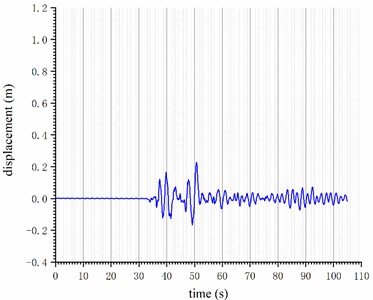
Fig. 7Elastoplasticity time history analysis results of the structure under the 4614EW wave: a) top displacement time history curve; b) structural damage curve
a)
b)
The ten-story reinforced concrete frame structure underwent elastoplastic time history analysis with the 4614EW wave, as shown in Fig. 6. At 36.8 seconds, under the 4614EW wave’s influence, four bottom-level middle beams of the frame structure exhibited pink plastic hinges; At 38.7 s, the pink plastic hinges progress from the middle of the bottom level to the two sides of the bottom; by 38.8 seconds, the pink plastic hinges had extended to the beams across the bottom three levels. At 38.9 seconds, pink plastic hinges continued their upward progression, reaching the beams at level 7. By 39.0 seconds, pink plastic hinges had advanced to the beams in level 9. By 41.8 seconds, hinge yielding was observed in 95 % of the beams, indicating significant structural response to the seismic activity. By 47.8 seconds, all beams from bottom to top exhibited pink plastic hinges, signaling the structure’s entry into the plastic stage. However, beyond this point, the structure maintained its state from 47.8 seconds onwards, with no additional plastic hinge yielding observed. Furthermore, the top displacement time history curve of the structure, as illustrated in Fig. 7(a), corroborates the aforementioned analysis.
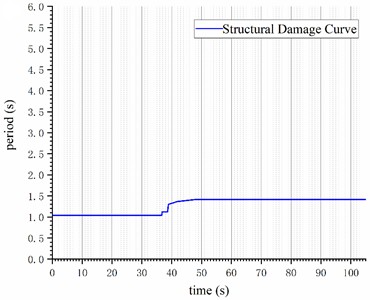
The structural damage curve, derived from the sequence of plastic hinge development within the structure, is calculated and depicted in Fig. 7(b). The structural damage curve clearly delineates the damage development process within the structure. It is categorized into two distinct phases: a) A first small-scale step jump from 36.8 seconds to 38.7 seconds; b) A second, more significant step jump from 38.8 seconds to 47.8 seconds.
4. T-f response spectrum and structural damage mechanism analysis
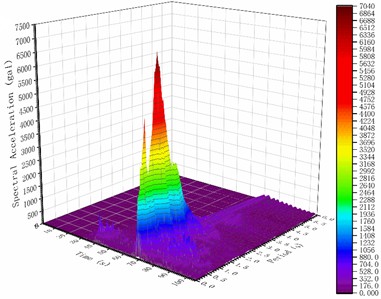
Fig. 3 comparison indicates that the 3138NS wave exhibits continuous high peak accelerations for approximately 6 seconds, from 67 seconds to 73 seconds. Conversely, the 4614EW wave demonstrates continuous high peak accelerations for approximately 24 seconds, spanning from 36 seconds to 60 seconds. Intuitively, equalizing the peak accelerations of both waves suggests that the 4614EW wave could inflict more damage on the same structure compared to the 3138NS wave. Interestingly, the actual elastoplasticity analysis results suggest the opposite outcome. The structure collapses at 68.5 seconds due to the 3138NS wave. Conversely, despite the extensive plastic damage induced by the 4614EW wave, the structure maintained its normal function. To elucidate this phenomenon and delve deeper into the structure’s damage mechanism, the T-f response spectra of both seismic waves are illustrated in Fig. 8, while the structural damage curve, alongside the T-f response spectrum contour map, is presented in Fig. 9.
Fig. 8T-f response spectrum of the Türkiye Mw7.8 earthquake: a) the 3138NS wave; b) the 4614EW wave
a)
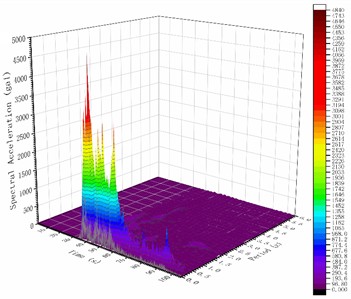
b)
Under the 3138NS wave’s influence, as depicted in Fig. 9(a), the structural damage curve reaches a small peak value region on the T-f response spectrum at 32.3 seconds (marked by a pink arrow), resulting in a minor step jump that implies slight structural damage. Subsequently, at 38.0 seconds, the curve enters another small peak region on the T-f spectrum (marked by a pink arrow), indicating a minor step jump and an escalation in slight structural damage. Following this, at 68.2 seconds, the curve reaches a large peak value region (dark red, marked by a pink arrow) on the spectrum, experiencing a brief minor step jump, suggesting the onset of moderate structural damage. The damage curve progresses into the dark red, large peak value region (marked by a pink arrow) on the spectrum, escalating rapidly before halting at 68.5 seconds. The collapse’s root cause is that at 68.2 seconds, the damaged structure's fundamental period remains within the peak range of the medium (compared to short and long periods) component-rich 3138NS wave, leading to rapid, sustained, and critical damage.
Fig. 9T-f response spectrum contour chart and the structural damage curve a) the 3138NS wave; b) the 4614EW wave
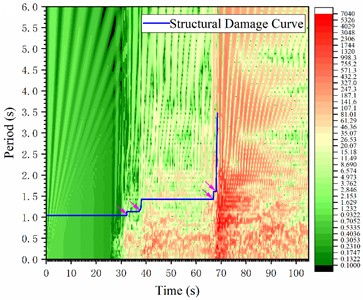
a)
b)
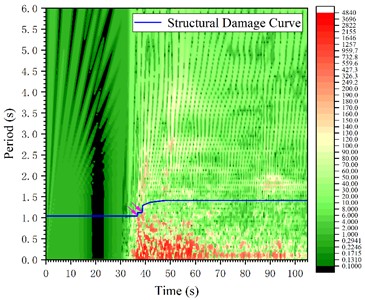
Under the influence of the 4614EW wave, as illustrated in Fig. 9(a), the structural damage curve enters a small peak value region on the T-f response spectrum at 36.8 seconds (highlighted by a pink arrow), resulting in a minor step jump that indicates slight damage to the structure. Subsequently, at 38.9 seconds, the curve enters another small peak value region on the T-f spectrum (marked by a pink arrow), leading to another minor step jump, signaling an escalation in slight structural damage. Following this, from 39.0 to 47.8 seconds, the structural damage curve exhibits a slow, continuous rise on a small scale, eventually stabilizing at 1.412 seconds. Despite the dark red peak value region on the T-f response spectrum of the 4614EW wave being abundant in short-period components, the structural damage curve successfully avoids the dark red region after two minor jumps, keeping the structure intact.
5. Regression analysis of the structural damage curve
The preceding analysis underscores the utility of structural damage curves for investigating structural damage mechanisms and forecasting the impact of ground motion on structures. However, two significant issues arise from the reliance on nonlinear time history analyses to generate structural damage curves: a) the considerable expense associated with conducting nonlinear time history analyses, which impedes their widespread adoption in practical engineering; b) the comprehensive insights provided by time history analyses into both the effects of ground motion on structures and the underlying damage mechanisms, potentially rendering the analysis of damage curves redundant.
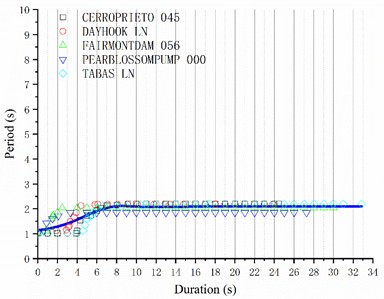
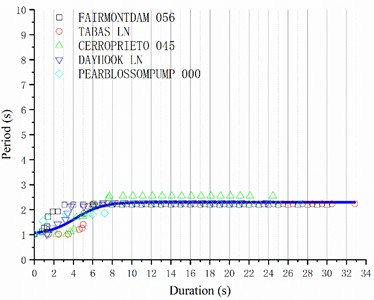
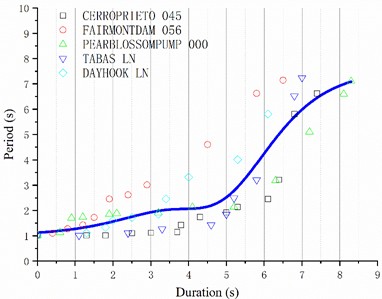
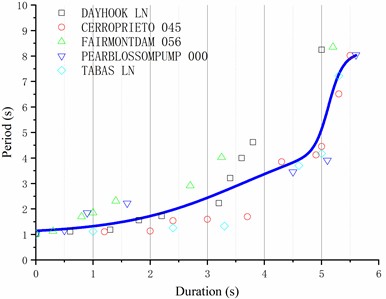
To tackle the identified challenges, this study advocates for regression analyses [23-27] on structural damage curves across specific buildings and site classes, aiming to generate statistically significant and broadly applicable recommended structural damage curves. In the US, site types are classified based on the equivalent shearing wave velocity within the top 30 m of the soil layer. Given that the equivalent shearing wave velocities at the selected seismic stations are 618 m/s and 671 m/s, corresponding to site C, five relevant earthquake records were chosen from the US Pacific Earthquake Engineering Research Center ground motion database (Table 1). Subsequently, based on the Code for Seismic Design of Buildings' recommendations for rare earthquake time history analysis, the peak ground motion accelerations were adjusted to 125 gal, 220 gal, 400 gal, and 620 gal, respectively. Next, nonlinear time history analyses were performed on the ten-story reinforced concrete frame structure to derive structural damage curves for the same site at varying peak accelerations. Ultimately, nonlinear regression analyses on the damage curve control points yielded recommended structural damage curve expressions for site C under various earthquake peak accelerations, catering to diverse engineering requirements.
Table 1Site C earthquake records
Earthquake event | Time | Recording station | Magnitude | (m/s) |
Victoria, Mexico | 1980 | Cerro Prieto 045 | 6.33 | 659.6 |
Tabas, Iran | 1978 | Dayhook LN | 7.35 | 659.6 |
San Fernando | 1971 | Fairmont Dam 056 | 6.61 | 684.9 |
San Fernando | 1971 | Pearblossom Pump 000 | 6.61 | 529.1 |
Tabas, Iran | 1978 | Tabas LN | 7.35 | 761.8 |
Through observation of the structural damage curve’s characteristics, it is evident that the initial segment is a horizontal line, representing the structure’s fundamental natural vibration period. The middle segment exhibits a small-scale step jump rise. in scenarios without failure, the concluding segment remains a straight line, corresponding to the altered fundamental natural vibration period due to changes in stiffness. Conversely, in the event of failure, this segment is characterized by a rapid, large-scale increase. Accordingly, the regression equation for the structural damage curve is derived from these characteristics:
where is the fundamental natural vibration period of the structure, , , , , , and are the regression parameters. The goodness of fitting is evaluated based on the decision coefficient , which ranges from 0 to 1. being closer to 1 indicates better fitting. in contrast, being closer to 0 indicates worse fitting. However, the decision coefficient is largely affected by the number of data points for fitting, and increasing the sample size improves the value. To eliminate this effect, the adjusted decision coefficient is introduced. Like , being closer to 1 also indicates better fitting. The regression analysis results are presented in Fig. 10 and Table 2, where a good nonlinear fitting effect can be observed. However, it is advisable to expand the sample size and undertake additional research across various site classes and structural types to enhance the adaptability and credibility of the structural damage curves. the pertinent findings will be disseminated in a subsequent publication. The regression parameters in Eq. (2) were determined using nonlinear regression techniques, and the sensitivity of the results to changes in these parameters is discussed.
Table 2Structural damage curve regression parameters under different peak accelerations
Regression parameter and adjusted decision coefficient | |||||||
Peak acceleration 125 gal | 2.09876 | 8.48821 | 5.85994 | 0.30146 | 0.20481 | –0.85786 | 0.71169 |
Peak acceleration 220 gal | 2.29216 | 4.24408 | 0.41484 | 0.30146 | –9.50664 | 1.00659 | 0.73732 |
Peak acceleration 400 gal | 7.56534 | 4.6343 | 4.6235 | 0.50281 | 0.50635 | 101.70133 | 0.76224 |
Peak acceleration 620 gal | 8.63472 | 3.63405 | 5.12099 | 0.41146 | 3.60291 | 0.52726 | 0.8276 |
6. Conclusions
Considering the limitations of traditional seismic design methods, this study aims to develop a novel approach that eliminates the need for complex elastoplastic time history analysis while still capturing the interaction of ground motion and the impact of high-order vibration modes. Simultaneously, this method takes into account the accumulated plastic deformation resulting from the duration of ground motion. in the event of severe earthquakes, certain structural members initially transition into the plastic phase, leading to localized stiffness degradation. This stiffness degradation advances with ongoing ground motion, culminating in the failure of individual members, which sequentially triggers further stiffness degradation among additional members and ultimately the structure’s collapse. Consequently, this research quantifies the structure’s stiffness degradation through changes in its natural vibration period, thereby characterizing the damage extent. Based on these principles, the curve depicting variations in the structure’s natural vibration period due to member stiffness degradation under significant earthquakes is identified as the structural damage curve.
Fig. 10Recommended structural damage curve of the ten-story reinforced concrete frame structure at site C: a) 125 gal; b) 220 gal; c) 400 gal; d) 620 gal
a)
b)
c)
d)
Two typical earthquake records, the 3138NS and 4614EW waves, are selected from the Türkiye Mw 7.8 earthquake on 6 February 2023 to conduct elastoplasticity time history analysis on a typical ten-story reinforced concrete frame structure, and plastic hinges are employed to skillfully obtain the structural damage curves. Using the structural damage curve and T-f response spectrum, the distinctive extents of damage to the structure under the action of the two seismic waves are thoroughly analyzed. The results indicate that a) the structural damage curve based on the natural vibration period variation can reflect the plastic development of the structure; b) the T-f response spectrum considering the ground motion amplitude, frequency spectrum, and duration can facilitate more intuitive analyses of the structural damage mechanism when combined with the damage curve; c) different seismic waves still cause distinctive effects on the structure even after adjusting their peaks to the same value due to their different time-frequency properties manifested as different time-frequency response spectra.
Furthermore, five earthquake records, corresponding to the same site type as the 3138NS and 4614EW records from the Türkiye Mw 7.8 earthquake, were selected from the US Pacific Earthquake Engineering Research Center ground motion database. Regression analysis was then applied to derive recommended structural damage curves for peak ground motion accelerations of 125 gal, 220 gal, 400 gal, and 620 gal. This methodology not only enhances the precision of structural damage assessments under various seismic intensities but also offers a detailed analysis of the site-specific seismic response characteristics, contributing significantly to the advancement of seismic engineering practices. The proposed structural damage curves were validated with additional data and case studies, addressing potential limitations and strengthening the conclusions.
References
-
“Disaster and Emergency Management Presidency.” AFAD. https://en.afad.gov.tr/
-
“Turkish Seismic Earthquake Code,” TBEC, 2018, https://www.resmigazete.gov.tr/eskiler/2018/03/20180318m1-2-1.pdf.
-
B. Balun, “Assessment of seismic parameters for 6 February 2023 Kahramanmaraş earthquakes,” Structural Engineering and Mechanics, Vol. 88, No. 2, pp. 117–128, Oct. 2023, https://doi.org/10.12989/sem.2023.88.2.117
-
Y. Li and L. Chen, “Analysis of the seismicity related to the tidal stress prior to the Mw7.8 Kahramanmaras, Türkiye earthquake,” Geomatics, Natural Hazards and Risk, Vol. 15, No. 1, Dec. 2024, https://doi.org/10.1080/19475705.2023.2284118
-
G. W. Housner, “Calculating the response of an oscillator to arbitrary ground motion,” Bulletin of the Seismological Society of America, Vol. 31, No. 2, pp. 143–149, Apr. 1941, https://doi.org/10.1785/bssa0310020143
-
M. A. Biot, “Analytical and experimental methods in engineering seismology,” Transactions of the American Society of Civil Engineers, Vol. 108, No. 1, pp. 365–385, Jan. 1943, https://doi.org/10.1061/taceat.0005571
-
M. Čaušević, S. Mitrović, and M. Bulić, “Determination of seismic load for buildings using different response spectra and application on different methods of analysis,” Cogent Engineering, Vol. 10, No. 1, Dec. 2023, https://doi.org/10.1080/23311916.2023.2220494
-
C. Guan, Y. Liu, and M. Beer, “Effects of Response spectrum of pulse-like ground motion on stochastic seismic response of tunnels,” Engineering Structures, Vol. 289, No. 1, 2023.
-
Q. Lin, G. Peng, Q. Zhang, and D. Chen, “Simulation of response spectra of far-source long-period ground motion based on the response spectrum ratio,” Iranian Journal of Science and Technology, Transactions of Civil Engineering, Vol. 47, No. 5, pp. 2985–2998, Mar. 2023, https://doi.org/10.1007/s40996-023-01079-w
-
X. Han, S. Yang, J. Bo, C. Chang, M. Guo, and Y. Cai, “A new method for the calibration of site‐related response spectra,” Advances in Civil Engineering, Vol. 2022, No. 1, Jul. 2022, https://doi.org/10.1155/2022/1713482
-
Y. Shen, M. Hesham El Naggar, D. Zhang, Z. Huang, and X. Du, “Optimal intensity measure for seismic performance assessment of shield tunnels in liquefiable and non-liquefiable soils,” Underground Space, Vol. 21, No. 2, pp. 149–163, Apr. 2025, https://doi.org/10.1016/j.undsp.2024.03.008
-
S. A. Freeman, “Evaluations of existing buildings for seismic risk-A case study of Puget sound naval shipyard,” in Proceedings of U.S. National Conference on Earthquake Engineering, pp. 113–122, 1975.
-
R. D. Bertero and V. V. Bertero, “The inner product vector as an output-only cross-correlation-based feature to structural damage assessment,” Earthquake Engineering and Structural Dynamics, Vol. 31, No. 3, pp. 627–652, 2002.
-
Y. Lei, H. Zhou, and Z.-L. Lai, “A computationally compact algorithm for real-time detection of abrupt structural stiffness degradations,” Structural Health Monitoring, Vol. 55, No. 2, pp. 1339–1346, Jan. 2015, https://doi.org/10.12783/shm2015/141
-
J. Carrillo, “Damage index based on stiffness degradation of low‐rise RC walls,” Earthquake Engineering and Structural Dynamics, Vol. 44, No. 6, pp. 831–848, Oct. 2014, https://doi.org/10.1002/eqe.2488
-
A. E. Abdelnaby and A. S. Elnashai, “Numerical modeling and analysis of RC frames subjected to multiple earthquakes,” Earthquakes and Structures, Vol. 9, No. 5, pp. 957–981, Nov. 2015, https://doi.org/10.12989/eas.2015.9.5.957
-
A. E. Abdelnaby and A. S. Elnashai, “Performance of degrading reinforced concrete frame systems under the Tohoku and Christchurch earthquake sequences,” Journal of Earthquake Engineering, Vol. 18, No. 7, pp. 1009–1036, Oct. 2014, https://doi.org/10.1080/13632469.2014.923796
-
Z. Guo, Y. Zhang, J. Lu, and J. Fan, “Stiffness degradation-based damage model for RC members and structures using fiber-beam elements,” Earthquake Engineering and Engineering Vibration, Vol. 15, No. 4, pp. 697–714, Nov. 2016, https://doi.org/10.1007/s11803-016-0359-4
-
X. Ni, S. Cao, Y. Li, and S. Liang, “Stiffness degradation of shear walls under cyclic loading: experimental study and modelling,” Bulletin of Earthquake Engineering, Vol. 17, No. 9, pp. 5183–5216, Jul. 2019, https://doi.org/10.1007/s10518-019-00682-5
-
H. Uebayashi, M. Nagano, T. Hida, T. Tanuma, M. Yasui, and S. Sakai, “Evaluation of the structural damage of high‐rise reinforced concrete buildings using ambient vibrations recorded before and after damage,” Earthquake Engineering and Structural Dynamics, Vol. 45, No. 2, pp. 213–228, Sep. 2015, https://doi.org/10.1002/eqe.2624
-
M. Hamidia, M. Afzali, S. Jamshidian, and M. Safi, “Post‐earthquake stiffness loss estimation for reinforced concrete columns using fractal analysis of crack patterns,” Structural Concrete, Vol. 24, No. 3, pp. 3933–3951, Mar. 2023, https://doi.org/10.1002/suco.202200351
-
Q. Zhi‐Gang and L. Qi‐Feng, “Analysis of normalized time‐frequency response spectra for three seismic records,” Chinese Journal of Geophysics, Vol. 59, No. 2, pp. 172–179, Jun. 2016, https://doi.org/10.1002/cjg2.20223
-
R. Dani, A. Tri, M. Fauziyah, and I. N. Budiantara, “Performance‐based seismic engineering: the need for a reliable conceptual comprehensive approach,” Engineering Letters, Vol. 31, No. 4, pp. 1649–1655, 2023.
-
X. Dong, M. Sun, T. Zhang, Q. Liu, and W. Jia, “A reliable ensemble classification algorithm by genetic neural network based on multiple regression,” IAENG International Journal of Computer Science, Vol. 50, No. 4, pp. 539–546, 2023.
-
H. Nurcahayani, I. N. Budiantara, and I. Zain, “The new estimation of bi-response nonparametric regression curve with combined estimators,” Engineering Letters, Vol. 31, No. 1, pp. 435–443, 2023.
-
M. A. D. Octavanny, I. N. Budiantara, H. Kuswanto, and D. P. Rahmawati, “The estimation of a regression curve by using mixed truncated spline and Fourier series models for longitudinal data,” Engineering Letters, Vol. 30, No. 1, pp. 335–343, 2022.
-
G. Qingwei, W. Wanpeng, Y. Xiong, and S. Zheng, “Data pre-processing method of explosion seismic waves based on cross-correlation analysis,” Engineering Letters, Vol. 31, No. 4, pp. 1656–1666, 2023.
About this article

The support of Frontier Research Team of Kunming University 2023 is gratefully acknowledged. The authors also acknowledge financial support from the Yunnan Fundamental Research Project (Grant No. 202101AT070144, Grant No. 202401CF070004) and Yunnan Province Foreign Talent Introduction Special Project – Key Foreign Expert Project (Grant No. 202505AO120030). The authors also acknowledge the support of Kunming University Science and Technology Innovation Team 2020.
The datasets generated during and/or analyzed during the current study are available from the corresponding author on reasonable request.
Zhigang Qiu: Study conception and design, data collection, analysis and interpretation of results. Liwei Yang: draft manuscript preparation. All authors reviewed the results and approved the final version of the manuscript.
The authors declare that they have no conflict of interest.
