Abstract
Microfluidic chips, featuring microchannels as key components, are crucial in chemistry, biology, and medical diagnostics. This study uses an RF CO₂ laser for direct writing on glass substrates, offering a cost - effective and fast fabrication method for microfluidic chip development. We investigated the RF CO2 laser’s energy distribution to set guidelines for processing line widths. Key parameters, laser power, processing speed, PPI, and repetition frequency, were studied for their effects on microchannel surface width and depth. We also examined how processing speed, laser power, and surface water films affect edge chipping on glass. Findings show that when PPI exceeds 2000 and processing speed is above 2000 mm/s, microchannel surfaces are smoother. There is a linear relationship between microchannel surface width/depth and laser power/repetition count. To minimize edge chipping, glass processing should remove internal stress, use high speeds, and apply low laser power. Edge chipping can undermine microchannel quality; thus, controlling processing parameters to reduce it is vital for high-quality microfluidic chip fabrication.
1. Introduction
The emergence of microfluidic chips, enabling precise fluid manipulation at the tens to hundreds – micrometer scale, has revolutionized laboratory operations in biology, chemistry, and physics. Compared to traditional experimental setups, microfluidic chips excel in flexibility, safety, and portability. They also feature higher automation, miniaturization, and cost – effectiveness [1]. As a result, microfluidic technology has been widely applied across various fields, spanning from biology and chemistry to medicine. Microchannels, the fundamental components of microfluidic chips, are crucial for facilitating essential functions such as sample separation and mixing. Microfluidic chips can be fabricated from a variety of materials, including silicon, PDMS, glass, and metal. To produce these chips, multiple processing techniques are utilized, such as mechanical processing, chemical etching, photolithography, and laser processing [2].
Glass, known for its stability and cost-effectiveness, has become a popular choice in microfluidics. Laser processing, characterized by its rapid processing speed and high flexibility, is well-suited for developing glass microfluidic chips. In 2002, Markillie et al. published a landmark study in Applied Optics [3]. By exploring the effects of vaporization and melt ejection during the laser machining of silica glass, they uncovered fundamental mechanisms. These findings are highly relevant to the development of glass microfluidic chips, providing theoretical support for optimizing laser processing parameters.
The field of glass microfluidic chip fabrication via laser processing has witnessed a flurry of innovative research. In addition to the efforts of early researchers, recent studies have introduced novel equipment and techniques. Hosseini,. et.al. [4] introduced glass via laser equipment developed by DR Laser, a leading enterprise in laser precision micro - nano processing equipment manufacturing. This equipment, adopting the “laser - induced modification + chemical etching” approach, can create various via structures in different glass materials, including quartz, borosilicate, soda-lime, and aluminosilicate glass. It also enables multiple morphological processes, significantly expanding the scope of glass microfluidic chip fabrication.
In the pursuit of three-dimensional and multi-functional microfluidic chips, Nasser, GA et al. [5] developed a composite laser micro-nano processing system. By etching three-dimensional microfluidic channels in glass using femtosecond lasers and integrating three-dimensional high-precision micro-optical devices through two-photon polymerization technology, they constructed multi-scale true three-dimensional optofluidic devices. Their research delved into the ultrafast absorption mechanism and key processes of femtosecond laser etching of glass microchannels, setting a new standard for advanced microfluidic chip development.
Zhang, HB et al. [6] demonstrated the unique advantages of femtosecond lasers in micro-hole processing for microfluidic chips. Through femtosecond laser processing, a high-density distribution of micro-holes with precise spacing can be achieved on conical surfaces. The process features a minimal thermal-affected zone, high surface smoothness, and high efficiency. This not only showcases the potential of femtosecond lasers in enhancing processing precision but also provides a new approach for high-precision micro-hole processing of microfluidic chips.
When it comes to high-precision laser processing, the work of Lansang, Rafael Paolo et al.is particularly notable [7]. They explored the precision laser processing of optical microstructures with slab waveguide CO₂ lasers, highlighting the significance of CO2 lasers in this domain. San Juan review published in Micromachines [8], comprehensively analyzed micro-hole drilling on glass substrates. Their work not only summarized existing techniques but also identified ongoing challenges and opportunities in laser-based glass machining.
Although femtosecond lasers often have an edge in laser processing [9] and near-infrared lasers are essential for laser cladding [10], RF CO2 lasers – low-cost far-infrared high-power lasers – deserve more attention. Ordinary glasses like quartz exhibit weak absorption in the visible to near-infrared range but strong absorption in the near-ultraviolet and infrared regions. This property makes near-infrared and infrared lasers, especially RF CO2 lasers, highly effective for processing. Hof, Lucas A et al. successfully fabricated glass microfluidic channels using CO2 lasers [11]. Their achievement not only demonstrates the feasibility of CO2 lasers in microfluidic chip fabrication but also validates the effectiveness of RF CO2 lasers in direct glass writing for low-cost microchannel production. Torabi, R conducted a numerical simulation of glass machining by dual CO2 – laser beams [12]. Their simulation provided valuable theoretical insights into the complex interactions between CO2 lasers and glass. Posa, Vishnu Vardhan et al. investigated the CO2 laser-assisted micro-slot milling characteristics of borosilicate glass [13].
Despite these studies on CO2 lasers, the majority of previous research has focused on femtosecond and nanosecond lasers, overshadowing the full potential of RF CO2 lasers in microfluidic chip development. Compared with these existing studies, current understanding of RF CO2 laser processing for microfluidic chips remains incomplete. This study aims to fill this research gap by [describe your research objectives and methods here]. Our work is expected to provide novel insights into RF CO2 laser processing, thereby promoting the development and wider application of glass microfluidic chips.
2. Analysis of RF CO2 laser output energy
The distribution of laser energy has a significant impact on processing. The output laser is a Gaussian beam, and its energy distribution changes during propagation. In order to obtain the final spot diameter, Zemax is used for analysis. The laser used in the processing system is the Ti60 laser produced by Synrad, with parameters including power greater than 60 W, wavelength of 10.6 μm, laser output spot diameter of 2.0±0.3 mm (1/e2), beam quality M2 < 1.2, divergence angle < 7.0 mrad, ellipticity < 1.2, linear polarization, and frequency ranging from 0 to 160 kHz. The beam expander used in the processing system is 2.5X, and the focusing lens is 2 inches with a focal length of 50.8 mm. The processing is achieved by the movement of light in two dimensions through two sets of prisms, with a range of 300 mm×500 mm. Since the prisms have minimal impact on the spot, their influence can be neglected. As most processing is done at the center position, it can be simplified as after beam expansion, the laser is focused on the surface of the object to be processed after a distance of (300 mm+ 500 mm)/2, as shown in Table 1, parameters 4 to 10. Based on the laser parameters, Zemax analysis is used to obtain the beam waist position (Table 1, parameter 1). The simplified optical path model of the laser processing system is shown in Fig. 1. After optimizing the focal length using Zemax, the corresponding minimum spot diameter corresponds to a focal length of 52.298 mm.
Table 1Major optical path parameters of laser processing system
Number | Type | Comment | Radius | Thickness | Material | Semi-Diameter |
0 | STANDARD | Infinity | 0.000 | 0.000 | ||
1 | STANDARD | Waist location | Infinity | 332.852 | 0.000 | |
2 | STANDARD | Laser output | Infinity | 10.000 | 1.1.000 | |
3 | STANDARD | Measured beam | Infinity | 10.000 | 1.1.000 | |
4 | STANDARD | 2.5×1 front | –75.000 | 8.000 | ZNSE | 12.500 |
5 | STANDARD | 2.5×1 back | 75.000 | 40.080 | 12.500 | |
6 | STANDARD | 2.5×2 front | Infinity | 8.000 | ZNSE | 15.000 |
7 | STANDARD | 2.5×2 back | –97.000 | 400.000 | 15000 | |
8 | STANDARD | Focus lens front | 150.000 | 10.000 | ZNSE | 25.400 |
9 | STANDARD | Focus lens back | –150.000 | 52.298 | 25.400 | |
10 | STANDARD | Object | Infinity | 0.000 | 4.574E-3 |
Fig. 1Simplified optical path model of laser processing system
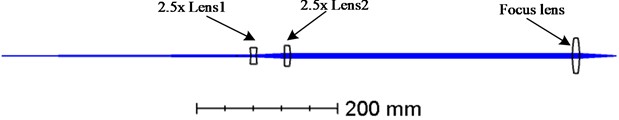
Fig. 2Analysis of laser Gaussian light energy distribution and diameter size
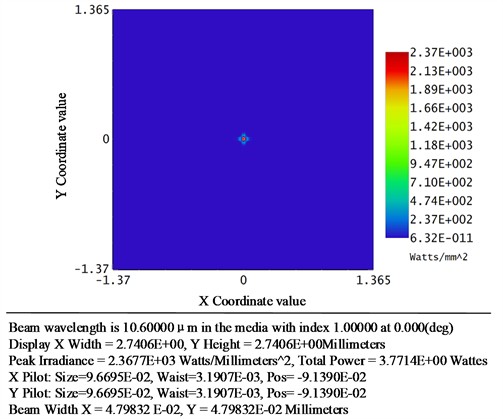
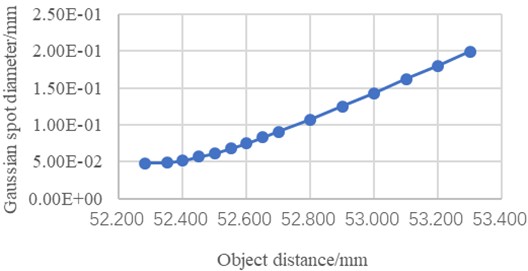
According to the formula for an infinitely distant Gaussian beam, , where the laser beam waist is 0.0428 mm, the laser spot width is 0.00480 mm as analyzed by the Gaussian beam analysis system, as shown in Fig. 2. Therefore, the CO2 laser can mark lines on the processed object with a minimum width of 0.005 mm. By modifying the distance between the focusing lens and the test mirror, the relationship between the spot diameter and the focal length is analyzed, as shown in Fig. 3. It can be seen that when defocused, the diameter of the Gaussian spot quickly increases, resulting in reduced energy. As a result, the laser processing effect becomes cone-shaped. When defocusing exceeds a certain range, the energy decreases below a threshold and it becomes impossible to perform processing.
Fig. 3Shows the relationship between the diameter of a laser Gaussian beam spot and the object distance
3. Experimental methodology
3.1. Experimental materials
In this paper, glass slides were selected as the experimental substrates, which are primarily composed of quartz glass. Quartz glass is renowned for its high flatness and chemical stability. It exhibits weak absorption in the visible to near-infrared spectrum but strong absorption in the near-ultraviolet and infrared regions. This property makes it highly suitable for processing with the RF CO2 laser, which operates at a wavelength of 10.6 μm. Glass slides are widely available, cost-effective, and have good compatibility with microfluidic applications, making them ideal experimental materials.
3.2. Experimental setup
The experimental setup centered around the Synrad Ti60 laser. This laser has a power output exceeding 60 W, and its 10.6 μm wavelength is well - matched to the absorption characteristics of quartz glass, facilitating precise energy deposition. The laser output spot diameter (at the 1/ intensity level) is 2.0±0.3 mm. With a beam quality factor of less than 1.2, a divergence angle of less than 7.0 mrad, an ellipticity of less than 1.2, and linear polarization, the laser offers efficient material processing and flexible energy control. Its frequency can be adjusted within the range of 0-160 kHz.
A 2.5X beam expander was integrated into the system to increase the laser beam diameter, improve beam quality, and reduce the divergence angle, resulting in a smaller and more focused spot. A 2-inch focusing lens with a focal length of 50.8 mm, optimized using Zemax software and made of high - quality optical materials with low absorption and dispersion, was used to focus the laser beam effectively. The two-dimensional movement of the laser beam was achieved through a pair of galvanometric mirrors. These mirrors, controlled by a computer-based motion control system, can rapidly and accurately position the laser beam within a scanning area of 300 mm×500 mm. They can also be programmed to create complex scanning patterns and control the processing speed, with negligible impact on the laser beam characteristics.
The Shanghai Bato Instrument BMM-580V microscope was employed to measure the surface width and depth of the microchannels. Equipped with high-magnification objectives and a precision-calibrated stage, and integrated with image analysis software, it enables non-destructive high-resolution imaging and automated dimension measurement, reducing human error.
3.3. Experimental parameter selection
To comprehensively explore the effects of processing parameters on microchannel fabrication, four key parameters were chosen: laser power, processing speed, pulses per inch (PPI), and the number of processing repetitions. The value ranges and step sizes of these parameters were determined based on the performance of the experimental equipment and the requirements of the study. When analyzing the effect of PPI on microchannel width, the PPI was varied from 500 to 4000 in steps of 500, while the laser power was fixed at 9 W, the processing speed at 2880 mm/s, and the number of processing repetitions at 1. For the impact of processing speed, the speed ranged from 180 mm/s to 3600 mm/s with a step of 180 mm/s, the laser power was 12 W, the PPI was 4000, and the number of repetitions was 1. To study the influence of laser power, the power was adjusted from 1.5 W to 30 W in 1.5 W increments, with the processing speed at 3240 mm/s, the PPI at 4000, and the number of repetitions at 1. Regarding the effect of the number of processing repetitions, it was varied from 1 to 20 with an increment of 1, with the laser power at 3 W, the processing speed at 3240 mm/s, and the PPI at 4000.
After determining that a PPI of 4000 resulted in the minimum microchannel surface width and the highest processing precision, further experiments were carried out to study the effects of processing speed, power, and repetition on microchannel depth. The processing speed was changed from 360 mm/s to 3600 mm/s in steps of 720 mm/s, the laser power was set at 15 W, and the number of repetitions was 1. The laser power was adjusted from 3 W to 30 W with a step of 3 W, the processing speed was fixed at 3240 mm/s, and the number of repetitions was 1. The number of repetitions was set as 1, 4, 7, 9, 11, the laser power was 3 W, and the processing speed was 3240 mm/s.
3.4. Experimental procedure
Before laser processing, the glass slides were thoroughly cleaned by ultrasonic treatment in acetone, ethanol, and deionized water successively to remove surface contaminants, and then dried with nitrogen gas to ensure a clean and dry surface. The cleaned glass slides were placed on the processing platform of the laser system. The preset processing parameters were input into the motion control system. The laser was then activated, and the microchannels were fabricated by scanning the laser beam along the predefined paths. Each set of parameters was repeated multiple times to ensure the reliability of the experimental results. After processing, the glass slides were transferred to the BMM-580V microscope. High-resolution images of the microchannels were captured at multiple positions, and the surface width and depth were measured using the image analysis software. The average value of multiple measurements was taken as the measurement result.
Scanning electron microscopy (SEM) and atomic force microscopy (AFM) were used to analyze the surface morphology of the microchannels. SEM was used to observe the overall structure and edge quality at high magnification, and AFM was used to measure the surface roughness at the nanoscale level, in order to evaluate the quality of the microchannels and the effectiveness of the laser processing parameters. To study the effect of a surface water film on the microchannel morphology, a thin layer of deionized water was applied to the surface of some glass slides before processing. Both the water-coated and uncoated glass slides were processed under the same laser parameters. After processing, SEM and AFM were used to compare and analyze the edge quality and surface roughness of the microchannels on the two types of slides, so as to clarify the impact of the water film on the laser processing process and the quality of the microchannels.
4. Experimental design and analysis
4.1. Analysis of effects on microchannel surface width
The quality of laser processing is related to both laser processing parameters and material properties. The main processing parameters include laser power, processing speed, PPI, repeat times, and focal position. PPI, also known as DPI, represents the number of points per inch. Material properties include material type, thickness, and internal stress. Glass slides are the most commonly used glass instruments, with high flatness and are usually made of quartz glass. Choosing glass slides as the processing objects offers a higher cost-performance ratio. By using glass slides as the processing objects, the experiment is conducted to test and analyze the main influencing factors. Four influencing factors are set: processing power, processing speed, PPI, and repeat times. Each group of experimental parameters analyzes one influencing factor, and for each influencing factor, the minimum value, maximum value, and step value are set based on the characteristics of the machine equipment. The parameter groups are shown in Table 2. For example, in the case of sequence number 1 in Table 2, the influence of PPI on microchannel width is analyzed, where 500:500:4000 (the first value represents the minimum value, the second value represents the step value, and the last value represents the maximum value) means that the PPI minimum value is set to 500, with increments of 500, and the maximum value is 4000.
Table 2Experimental parameter groups for analysis of laser processing parameters’ influence
No. | Power (W) | Speed (mm/s) | Number of repetitions | PPI | Number of experiments |
1 | 9 | 2880 | 1 | 500:500:4000 | 8 |
2 | 12 | 180:180:3600 | 1 | 4000 | 20 |
3 | 1.5:1.5:30 | 3240 | 1 | 4000 | 20 |
4 | 3 | 3240 | 1:1:20 | 4000 | 20 |
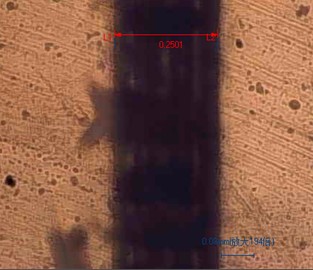
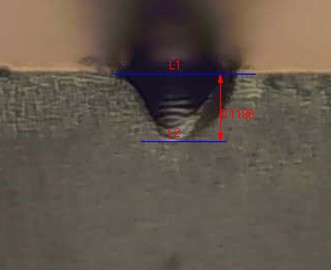
Use the machining data from Table 2 to mark a channel on the surface of the glass slide with a length of 10 mm and a width of 0.02 mm. Measure the surface width and depth of the microchannel on the glass slide using the Shanghai Bato Instrument BMM-580V microscope, as shown in Fig. 4.
Fig. 4Analysis of the effects of width and depth on the surface of microchannels in laser direct writing on glass slides
In this paper, we investigated the impact of multiple parameters on the width of the microchannel surface in glass processing. The results are presented clearly; however, the discussion has been enhanced to delve deeper into the reasons why certain parameters, such as PPI and processing speed, exert a greater influence on microchannel width compared to others. According to the four sets of data shown in Figs. 5 to 8, the width of the flow channel surface is larger than the set line width, with a minimum close to 0.1 mm.
As depicted in Fig. 5, as the PPI (Pixels Per Inch) increases, the width of the flow channel surface decreases, with the most significant fluctuations at a PPI value of 500. The reason behind this lies in the fact that a higher PPI corresponds to a more concentrated distribution of laser energy. When the PPI is increased, the laser beam is focused onto a smaller area, delivering more energy per unit area. This leads to more efficient etching of the glass, resulting in a narrower flow channel surface. Conversely, a lower PPI spreads the laser energy over a larger area, reducing the energy density at the processing site. As a result, the etching process is less efficient, and the flow channel surface remains wider. When the PPI value is too small, the energy distribution becomes extremely uneven, causing a significant impact on the surface width.
Fig. 5The influence of PPI on the width of the microchannel surface
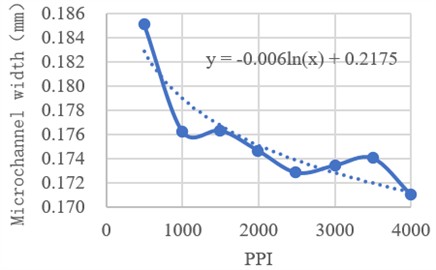
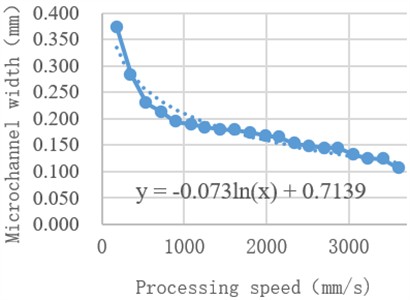
Fig. 6 shows that the processing speed has a significant impact on the width of the microchannel surface, especially when the value is small. As the processing speed increases, the energy received by the glass per unit of time decreases, resulting in a decrease in width. The logarithmic fitting is consistent with the actual situation, indicating that the width of the surface is logarithmically related to the processing speed. At low processing speeds, the glass is exposed to the laser for a longer time, receiving more energy. This excess energy causes more material to be removed from the glass surface, widening the microchannel. As the speed increases, the exposure time is shortened, and the energy input per unit area decreases, leading to a narrower microchannel.
Fig. 6The influence of processing speed on the width of the microchannel surface
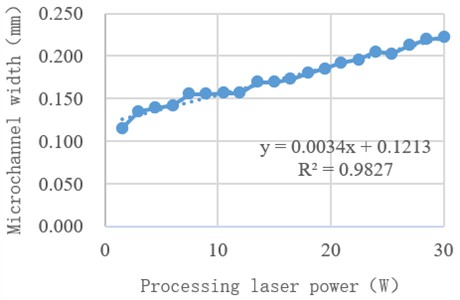
From Fig. 7, it can be observed that as the processing power increases, the width of the microchannel surface becomes wider. The fitted curve in the figure indicates that the influence of power on the width of the channel surface follows a linear relationship. The etching energy of the glass depends on the energy of a single-pulse laser. When the processing power is increased, the energy of each laser pulse increases. A higher-energy pulse can remove more glass material during the etching process, thus widening the microchannel surface.
Fig. 7Influence of processing power on the width of the microchannel surface
According to Fig. 8, the influence of the number of processing repetitions on the width of the surface line is weak. The possible reason for this phenomenon is that the number of processing repetitions has a greater impact on the processed residue, resulting in increased width. However, the width of the flow channel surface is still primarily affected by the energy of a single laser pulse. The repeated processing may accumulate some residues on the surface, which can slightly increase the width. But compared to the dominant factors like PPI, processing speed, and processing power, the impact of the number of repetitions is relatively minor.
Fig. 8The influence of processing repetition times on the width of the microchannel surface
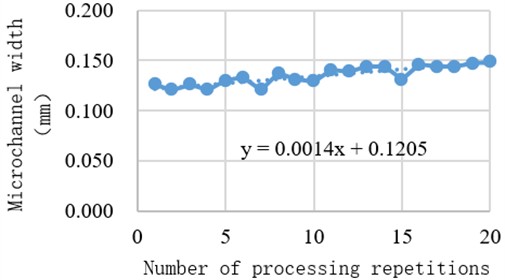
From the above four experiments, it can be seen that changing PPI and the number of repetitions have a relatively weak effect on the surface width of the microchannel in most cases. However, when the PPI value is too small, it has a significant impact on the surface width. Changing the laser processing speed and the processing power have a significant impact on the surface width of the glass microchannel. A low speed, similar to a small PPI value, has a larger impact. In terms of processing stability, the speed should be greater than 2000 mm/s and the PPI should be greater than 2000, while the processing power and number of repetitions should be set according to the requirements.
4.2. Experimental design and analysis
In the research of microchannel processing, the analysis of the influence of surface width revealed that when the pixels per inch (PPI) reached 4000, the minimum surface width could be achieved, enabling the most precise machining. Based on this, the PPI of 4000 was selected for subsequent experiments. Subsequently, different laser processing parameters, including processing speed, power, and repetition count, were investigated to test their specific impacts on the microchannel depth. The specific experimental parameter settings are shown in Table 3.
Table 3Experimental parameter groups for the analysis of laser processing parameters
No. | Power (W) | Speed (mm/s) | Number of repetitions | PPI | Number of experiments |
1 | 15 | 360:720:3600 | 1 | 4000 | 5 |
2 | 3:6:30 | 3240 | 1 | 4000 | 5 |
3 | 3 | 3240 | 1\4\7\9\11 | 4000 | 5 |
Based on the experimental parameters in entry 1 of Table 3, tests were carried out on the impact of laser processing speed on the microchannel depth, and the experimental results are shown in Fig. 9. Through in-depth analysis of the data in Fig. 9, it can be seen that when the laser processing speed reaches a certain value, its impact on the microchannel depth becomes extremely weak. Therefore, in the actual processing, a higher speed can be adopted, which can not only improve the processing efficiency but also enhance the stability of the processing process.
Fig. 9Influence of laser moving speed
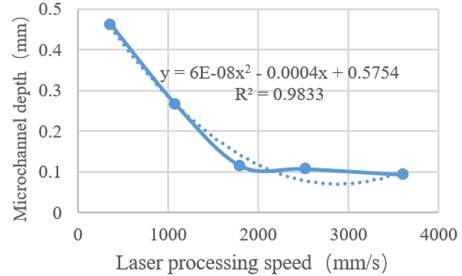
The horizontal axis of this figure represents the laser processing speed (mm/s), with a range from 0 to 3600 mm/s. The vertical axis represents the microchannel depth (the specific unit is not clearly marked). Multiple data curves are plotted in the figure, showing the changes in the microchannel depth at different speeds. Through the trend of the curves, it can be intuitively seen that when the speed is low, the microchannel depth changes significantly with the increase of the speed. However, when the speed exceeds a certain value, the curve gradually flattens, indicating that the influence of the speed on the microchannel depth gradually decreases.
Fig. 10Influence of processing power
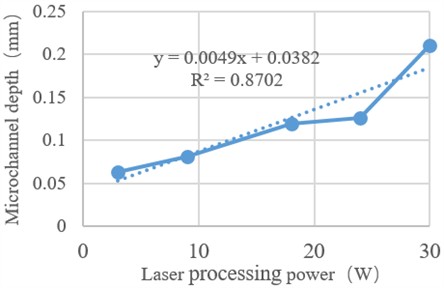
In the experimental parameters of entry 2 in Table 3, a speed of 3240 mm/s was specifically selected to analyze the influence of different laser powers on the microchannel depth. The specific situation is shown in Fig. 10. From the data presented in Fig. 10, it can be clearly observed that there is a relatively obvious linear relationship between the laser power and the microchannel depth. That is, as the laser power increases, the microchannel depth will increase linearly accordingly.
The horizontal axis of this figure is the laser processing power (W), with a value range from 0 to 30 W. The vertical axis is also the microchannel depth (unit not marked). The data points in the figure are fitted into a line with the fitting equation and the coefficient of determination 0.8702. There is also a line with a higher fitting degree and 0.9833. These data and equations clearly show the linear relationship between the laser power and the microchannel depth. That is, as the laser power increases, the microchannel depth shows a linearly upward trend.
In the experimental parameters of entry 3 in Table 3, the power was set to 3 W. By measuring the microchannel depths under different repetition counts, the influence of the repetition count on the microchannel depth was analyzed in depth. The relevant results are shown in Fig. 11. It can be clearly seen from Fig. 11 that the influence of the repetition count on the microchannel depth also shows a relatively obvious linear pattern.
Fig. 11Influence of processing times
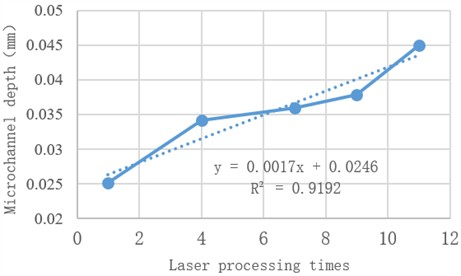
The horizontal axis of Fig. 11 represents the laser processing repetition count, ranging from 0 to 12 times. The vertical axis is the microchannel depth (unit not marked). The straight-line equation fitted by the data points in the figure is , and the coefficient of determination 0.9192. It can be seen from the figure that as the processing repetition count increases, the microchannel depth increases linearly, further demonstrating the linear relationship between the repetition count and the microchannel depth.
4.3. Influence on machining surface morphology
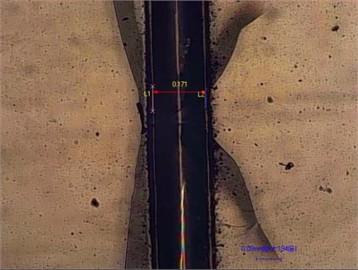
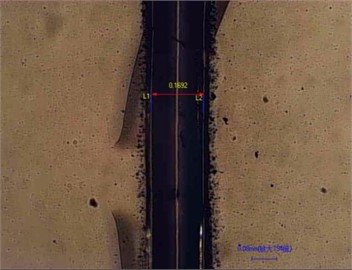
An analysis was conducted on the effects of adding a water film to the surface of glass on the processed morphology. The fixed pulse per inch (PPI) value was set at the maximum value of 4000, and a laser processing power of 15 W was used. The processing speeds were set at 1080 mm/s and 3600 mm/s respectively, for glass slides with and without a water film on the surface. Fig. 12 shows the morphology of the microchannel surface at a processing speed of 1080 mm/s, where Fig. 12(a) represents the morphology with a water film and Fig. 12(b) represents the morphology without a water film. It was observed that the presence of a water film resulted in a more severe edge break, which could be attributed to the larger thermal gradient and thermal stress caused by the water film. This led to a greater degree of edge break and increased roughness at the edges. Figs. 12(c) and (d) show the morphology of the microchannel surface at a processing speed of 3600 mm/s, with (c) representing the morphology with a water film and (d) representing the morphology without a water film. When comparing the presence and absence of a water film, it was found that the edge break was more severe with a water film. However, compared to the processing speed of 1080 mm/s, the degree of edge break was significantly reduced, and the roughness at the edges was also improved. Therefore, drying or heating the glass before processing to reduce stress and using a faster processing speed can improve the quality of processing.
Fig. 12Analysis of the influence of processing speed and surface water film on the edge on the edge collapse of microchannel surface
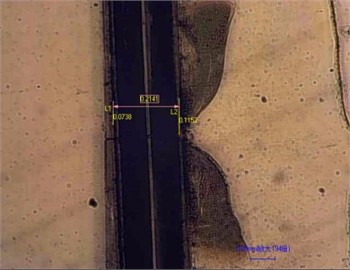
a) 1080 mm/s, have water film
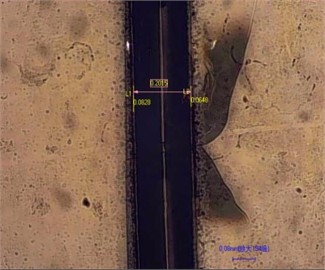
b) 1080 mm/s, without water film
c) 3600 mm/s, Have water film
d) 3600 mm/s, without water film
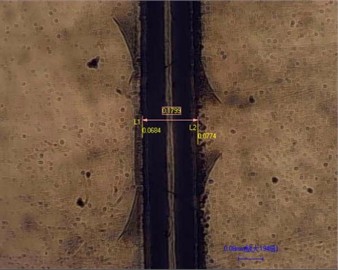
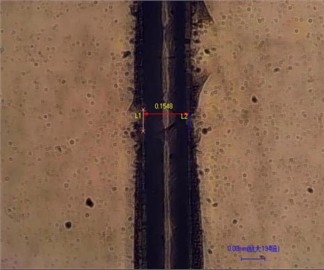
Continuing the analysis of the effects of surface wetting and processing power on the microchannel morphology, with a set PPI value of 4000 and a processing speed of 2880 mm/s, and repeating the process once, the water-wetted and dry glass surfaces were processed using both 18 W and 24 W powers. As shown in Fig. 13(a) and (b) illustrate the morphology of the microchannel surface at 18 W, with significant edge breakage on the water-wetted microchannel surface, similar to the analysis of the processing power breakage. (c) and (d) show the morphology of the microchannel surface at 24 W processing power, with even more severe edge breakage on the water-wetted microchannel surface, consistent with the previous analysis. Compared to 18 W power, the edge breakage on the microchannel surface is more severe at 24 W power. Therefore, using lower power and lower speed can reduce edge breakage.
Fig. 13Analysis of the influence of processing power and surface water film on the edge collapse of microchannel
a) 18 W, have water film
b) 18 W, without water film
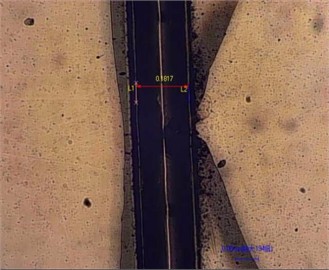
c) 24 W, Have water film
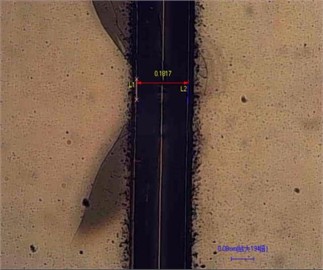
d) 24 W, without water film
5. Conclusions
This paper analyzed the RF CO₂ laser's performance in microchannel fabrication on glass substrates. When defocused, the laser spot enlarged and its energy decreased, and the actual processing width deviated from the ideal value, suggesting room for improvement in the focusing system. Key parameters like PPI, processing speed, laser power, and repetition rate showed distinct impacts on microchannel width and depth. Higher PPI and speed values, along with appropriate power and repetition rates, were found to be beneficial. Also, a water film on the glass substrate, along with low speed and high power, led to severe edge chipping, indicating the need for dry processing conditions.
This paper has important implications for microfluidics. The optimized microchannel fabrication method can enhance fluid handling efficiency in microfluidic chips, which is crucial for applications such as biological and chemical analysis, where precise sample manipulation is necessary for accurate results. In medical diagnostics, it can enable faster and more sensitive detection. However, the research has limitations. It was mainly focused on quartz glass slides, and the findings may not apply to other materials. Also, only 2D microchannels were fabricated, and more parameters and environmental factors could influence the results. Future research could explore processing different materials, creating 3D microchannels, and studying the combined effects of various factors to further improve microchannel fabrication technology.
References
-
Y. Shi et al., “Research progress on functional microfluidic chips fabricated by femtosecond laser direct writing technology,” Chinese Journal of Lasers, Vol. 46, No. 10, pp. 9–28, Jan. 2019, https://doi.org/10.3788/cjl201946.1000001
-
H. Jiang, M. Ochoa, R. Rahimi, W. Yu, and B. Ziaie, “Laser-treated glass platform for rapid wicking-driven transport and particle separation in bio microfluidics,” RSC Advances, Vol. 9, No. 34, pp. 19531–19538, Jun. 2019, https://doi.org/10.1039/c9ra03448j
-
G. A. J. Markillie, H. J. Baker, F. J. Villarreal, and D. R. Hall, “Effect of vaporization and melt ejection on laser machining of silica glass micro-optical components,” Applied Optics, Vol. 41, No. 27, p. 5660, Sep. 2002, https://doi.org/10.1364/ao.41.005660
-
H. Hosseini, F. Guo, R. Barati Ghahfarokhi, and S. A. Aryana, “Microfluidic fabrication techniques for high-pressure testing of microscale supercritical CO2 foam transport in fractured unconventional reservoirs,” Journal of Visualized Experiments, No. 161, Jul. 2020, https://doi.org/10.3791/61369
-
G. A. Nasser, A. M. R. Fath El-Bab, A. L. Abdel-Mawgood, H. Mohamed, and A. M. Saleh, “CO2 Laser fabrication of PMMA microfluidic double t-junction device with modified inlet-angle for cost-effective PCR application,” Micromachines, Vol. 10, No. 10, p. 678, Oct. 2019, https://doi.org/10.3390/mi10100678
-
H. Zhang, Q. Zhang, P. Xiang, Y. Wang, and J. Lei, “Direct additive manufacturing of transparent fused silica glasses using an integrated paste printing and laser in-situ melting technology,” Additive Manufacturing, Vol. 84, p. 104135, Mar. 2024, https://doi.org/10.1016/j.addma.2024.104135
-
R. P. Lansang, M. Lam, H. R. Jakubovic, and R. Shukla, “Fox-Fordyce disease treated with fractional CO2 laser: A case report,” JAAD Case Reports, Vol. 37, pp. 5–7, Jul. 2023, https://doi.org/10.1016/j.jdcr.2023.04.028
-
J. D. San Juan and A. H. Mendelsohn, “Evaluation and application of CO2 laser fiber delivery for single port transoral robotic surgery,” The International Journal of Medical Robotics and Computer Assisted Surgery, Vol. 19, No. 4, Feb. 2023, https://doi.org/10.1002/rcs.2510
-
H. Hosseini, J. S. Tsau, J. Wasserbauer, S. A. Aryana, and R. Barati Ghahfarokhi, “Synergistic foam stabilization and transport improvement in simulated fractures with polyelectrolyte complex nanoparticles: Microscale observation using laser etched glass micromodels,” Fuel, Vol. 301, p. 121004, Oct. 2021, https://doi.org/10.1016/j.fuel.2021.121004
-
H. J. Baker, G. A. J. Markillie, P. Field, Q. Cao, C. Janke, and D. R. Hall, “Precision laser processing of optical microstructures with slab waveguide CO 2 lasers,” Advanced High-Power Lasers and Applications, Vol. 3888, p. 625, Feb. 2000, https://doi.org/10.1117/12.377073
-
L. Hof and J. Abou Ziki, “Micro-hole drilling on glass substrates-a review,” Micromachines, Vol. 8, No. 2, p. 53, Feb. 2017, https://doi.org/10.3390/mi8020053
-
R. Torabi, H. Salmani Nejhad, B. Kazemi, and M. H. Sarshogh, “Some experimental studies on the UV spark pin-array pre-ionization in TEA CO2 laser,” Laser Physics, Vol. 32, No. 4, p. 045002, Apr. 2022, https://doi.org/10.1088/1555-6611/ac5818
-
V. V. Posa and M. Sundaram, “Experimental study of micromachining on borosilicate glass using CO2 laser,” Journal of Manufacturing Science and Engineering, Vol. 143, No. 5, p. 051007, May 2021, https://doi.org/10.1115/1.4048639
About this article

This work is Supported by the scientific research project of Hunan Provincial Department of Education (No. 22B0806); Hunan Provincial Natural Science Foundation Project (No. 2024JJ7195); Yongzhou guiding science and technology plan project (No. 2023YZ025); Scientific research project of Hunan University of Science and Engineering (No. 23XKYZZ12).
The datasets generated during and/or analyzed during the current study are available from the corresponding author on reasonable request.
The authors declare that they have no conflict of interest.
