Abstract
The operational duration and environmental factors associated with current transformers (CTs) in distribution networks makes them prone to measurement miscalibration during their operation. To address this, a kernel k-nearest neighbor (k-kNN) miscalibrated CT identification method based on line topology is proposed. This method relies on the composite characteristics of load currents specific to certain line topologies. High-precision secondary-side CT current data provided by the current acquisition devices in the feeder area are used to construct a multiple linear regression model. The multiple linear regression model is established in the complex domain, and indirectly assesses the measurement status of the current transformers by analyzing the complex coefficients. Building upon the kNN identification algorithm, a kernel function is introduced to map low-dimensional distance feature vectors into a higher-dimensional feature space where linear separability is significantly enhanced, thus improving the accuracy with which abnormal coefficients can be detected in the multiple linear regression model. Experimental simulations and field application scenarios demonstrate that the proposed method significantly outperforms traditional kNN algorithms in terms of classification performance. Specifically, there is an increase of 12.0 % in the F1 score, a rise of 13.3 % in accuracy, and an improvement of 12.0 % in recall. Moreover, in practical engineering applications, the recognition metrics consistently exceed 93 %, which substantiates the effectiveness of the proposed miscalibrated CT identification method.
Highlights
- A multiple linear regression model is constructed based on high-precision secondary-side CT current data provided by the current acquisition devices within the feeder area.
- Building upon the k-kNN identification algorithm, a kernel function is introduced to map low-dimensional distance feature vectors into a high-dimensional feature space, thereby improving the algorithm's performance.
- The method studied in this paper was applied to an actual substation for testing, verifying the effectiveness of the algorithm.
1. Introduction
Current transformers (CTs) within distribution networks are vital components for monitoring grid conditions, implementing protective relaying, and upholding fairness in electric power transactions. The conventional approach to verifying CT errors predominantly relies on offline methodologies, characterized by intricate procedures and extended verification durations. These methods provide an inadequate reflection of the fluctuating error status of CTs across their entire operational lifespan [1-3]. Although energized calibration offers an instantaneous depiction of transformer operational states, it requires the calibration apparatus to interface with the transformer’s high-voltage side, entailing considerable operational hazards [4-5]. Thus, it is imperative to develop identification techniques that are more reflective of the operational state and adaptable to various practical scenarios.
There have been numerous studies in this area, with major methods falling into two categories: signal processing and model analysis. Reference [6] proposed a wavelet transform-based assessment method for state mutation in digital instrument transformers, while reference [7] studied a fault diagnosis method for electronically coupled instrument transformers using wavelet-based fractal analysis. Reference [8] used a diffusion map, local linear embedding, and autoencoder for feature extraction, and employed the Gustafson-Kessel and k-medoids algorithms to classify the encoded data, achieving fault diagnosis in material handling systems. Reference [9] investigated a fault diagnosis method for electronically coupled instrument transformers using a wavelet neural network. These signal processing methods are all premised on the assumption of stable primary signals in the main grid, whereas physical state quantities in the operation of distribution networks are random variables. Moreover, these methods are only applicable to sudden changes in CT errors and cannot be used to evaluate the gradual changes in CT error status. Reference [10] adopted an equivalent parameter modeling approach, starting from a mathematical model of the primary system of substations, and constructed an electrical diagnostic platform. This enables observation models to be built for transmission lines and transformers, allowing the output of the observer to be compared with the output values of the transducers. The resulting residual information can be used for transducer fault diagnosis. Reference [11] explored a method based on multi-parameter degradation models, comparing real-time measured degradation parameters with initial degradation parameters to assess the metering status of transducers. This method, however, is heavily reliant on precise physical models, which are subject to a series of assumptions during model construction. The complex structure and operating environment of distribution network lines mean that the accuracy of the models in assessing transducer metering errors often falls short of requirements. Therefore, relying solely on model analysis or signal processing methods cannot adequately address the challenges encountered in the typical environment of distribution networks.
To address this issue, a cyber-physical systems (CPS) approach has been widely applied across various fields in recent years. By integrating physical models with signal analysis, the algorithm performance is enhanced, making them suitable for complex task environments. Reference [12] identified abnormal users through real-domain multivariate regression, but did not consider the influence of the current phase, making it difficult to identify abnormal users under complex fault scenarios. Reference [13] capitalized on the premise that the residual current in a low-voltage feeder area is the vector sum of natural leakage currents in that area and leakage currents from faulty users. Within the complex domain, a multiple linear regression model (MLRM) for wiring error leakage faults was constructed. Because there is a significant distinction in complex coefficients during abnormal leakage, it is possible to indirectly identify leakage anomalies by comparing model coefficient thresholds. However, the metering errors of CTs in distribution networks are usually small, leading to highly complex distributions of feature coefficients for each transformer when constructing a complex MLRM using measurement data from various transformers. Traditional threshold comparison methods are highly sensitive to data fluctuations and the complexity of distributions, are easily influenced by outliers, and struggle to adapt to nonlinear classification boundaries. Directly classifying complex coefficients through threshold methods results in low accuracy. Hence, there is a need for an accurate and efficient identification algorithm to classify complex coefficients, thereby identifying miscalibrated transformers.
With continuous advances in intelligent technologies, machine learning algorithms such as decision trees, random forests, support vector machines (SVMs), and Bayesian classifiers have been widely applied in the field of pattern recognition [14-16]. However, the performance of these algorithms often hinges on the quality and quantity of the data, and their efficacy may be compromised if the event of insufficient data or substantial amounts of noise. The k-nearest neighbors (kNN) algorithm considers the majority decision of locally proximate instances for test samples and dynamically forms nonlinear decision boundaries in the process of solving nonlinear classification problems. Simultaneously, kNN minimizes the impact of global data fluctuations, complex distributions, and outliers on classification, effectively enhancing the classification accuracy. Reference [17] used the historical operational data of transducers to construct a virtual standardizer, employing a kNN algorithm to monitor the real-time status of transducers and trigger alarms in the case of anomalies. Reference [18] leveraged the features extracted from training data by deep learning networks and predicted labels for training data, before extracting features from test samples and feeding them into the kNN algorithm for open-set fault diagnosis. Reference [19] used thermal imaging technology and the kNN algorithm, alongside feature extraction through the gray level co-occurrence matrix, to detect and classify textile fabric defects. This enabled known category classification for photovoltaic arrays and unknown category fault detection. As a straightforward and practical classification algorithm, kNN (and its numerous variants) has been extensively researched. However, its reliance on Euclidean distance measures limits its performance in confronting many complex classification problems. To overcome this issue, common solutions focus on variable weighting [20] and a rapid search for nearest neighbor metrics [21], with less emphasis on research into distance measure transformations. With the widespread application of kernel function concepts in the field of pattern recognition [22-23], kernel methods effectively overcome the problem of the linear inseparability of data, and their complexity does not depend on the dimensionality of the data. The kernel kNN (k-kNN) algorithm, which introduces kernel function technology to kNN, enables data to be mapped into high-dimensional spaces, effectively addressing nonlinear separability, constructing complex decision boundaries, and improving the classification performance of traditional kNN algorithms.This paper proposes a kernel function-enhanced k-nearest neighbors (k-kNN) algorithm based on line topology analysis, specifically designed for identifying the metering status of current transformers (CTs). For complex distribution networks, the network is divided into multiple independent single-input multiple-output (SIMO) sub-regions. Within each sub-region, secondary-side current data from the CTs are used to construct a multiple linear regression equation. Subsequently, the k-kNN algorithm classifies the regression coefficients of the CTs within each sub-region to evaluate their metering performance. Finally, results from all sub-regions are aggregated to form an overall evaluation report. This method is flexible and can be applied to various configurations of distribution network structures, provided there is access to sufficient high-quality input data and clear line topology information.
Based on the composite characteristics of load currents in specific line topologies, this paper proposes a k-kNN-based miscalibrated CT identification method for distribution networks rooted in line topology analysis. This method enables the online detection of CT errors. Combined with simulation and application experiments, the superior performance of this method is validated. The main contributions of this paper are as follows:
1) By leveraging multi-source secondary current data provided by high-precision current acquisition devices in distribution networks and incorporating physical constraints, an MLRM is established in the complex domain.
2) A CT identification methodology grounded in CPS is introduced, which indirectly assesses the metering condition of CTs through the scrutiny of current model coefficients.
3) An enhanced kNN algorithm employing a kernel function is proposed. This algorithm projects low-dimensional features within the algorithm’s distance metric to a high-dimensional feature space, enhancing the feature distinguishability and consequently elevating the accuracy of kNN identification.
2. CT physical correlation analysis
2.1. Secondary-side current data analysis for CTs in the feeder area
The actual electrical load at the user end will dynamically change according to the switching status of the connected devices and the actual power consumption patterns of the users. Therefore, the load current at each user end can be calculated by the following formulas:
where represents the ratio difference of the CT, denotes the phase angle difference of the CT, is the rated transformation ratio of the CT, is the amplitude of the secondary-side current of the CT, is the true value of the primary-side current of the CT, is the phase of the secondary-side current of the CT, and is the true phase of the primary-side of the CT.
The feeder area load current is comprised of individual user load currents. According to the principle of vector superposition, there exists a linear relationship between the two. The load current model for the feeder area can be expressed as:
where represents the ratio difference of the CT on the th line, indicates the ratio difference of the busbar CT, and denotes the angular velocity of the current signal.
To further illustrate the correlation between the feeder area load current and the variation in load current at malfunctioning user ends within the feeder area when multiple user-end CTs experience miscalibration, an MLRM for the feeder area load current is constructed as follows:
where represents the complex coefficient of the th bias coefficient.
2.2. Establishing an MLRM
Within an analysis duration of length m, the primary current values measured by the feeder area CT and the user CT are and . According to Eq. (7), an MLRM is formulated to relate the load currents of the feeder area at various time points to the load currents at the user ends:
Eq. (8) can be represented in matrix form as:
When a CT experiences miscalibration, there will be a certain degree of error between the measured current values and the actual current values. This paper primarily focuses on identifying CT ratio errors. Thus, to maintain the validity of the equation set, the main analysis concentrates on the modulus of the complex coefficients. Henceforth, whenever the term complex coefficient is mentioned, it should be understood to refer to the modulus of a complex number. Upon miscalibration, the complex coefficient of a CT undergoes corresponding changes, thus establishing a certain relationship between the complex coefficients of various CTs and the errors in the CTs themselves.
2.3. Underlying principle of the method
Kernel methods effectively address the issue of linear inseparability in data by seeking nonlinear decision boundaries in high-dimensional spaces. They have the added advantage that their complexity is not influenced by the dimensionality of the data, making them suitable for handling high-dimensional data. In this paper, we present a kernelized enhancement of the kNN algorithm. The k-kNN algorithm achieves superior classification performance on complex datasets, demonstrating particular proficiency when dealing with high-dimensional and nonlinear data.
2.3.1. kNN Kernelization
The traditional kNN algorithm effectively enhances its classification performance through a linear transformation of the input samples, , as mentioned in reference [24]. In this approach, the distance metric matrix is learned by optimizing a cost function. Typical distance metrics employed include the Mahalanobis distance and the Euclidean distance :
where is the th sample and is the th sample, .
To extract the nonlinear features between samples, k-kNN expands the technique into a kernel-based nonlinear methodology, and provides a formula for computing distances accordingly:
where is the kernel matrix.
This kernelized form is not convenient for learning the distance measurement matrix. Thus, we develop an improved approach. Despite the lack of an explicit representation of the kernel mapping, samples in the feature space can nonetheless be explicitly denoted via the kernel matrix :
where is the projection vector and is the coefficient matrix.
If the kernel map is taken as a linear transformation, then Eqs. (14) and (15) imply that:
If a nonlinear transformation is taken, then the following holds:
The k-kNN method is an enhanced version of the kNN algorithm that introduces a kernel function to map low-dimensional feature vectors into a high-dimensional feature space, thereby improving classification performance. When dealing with multidimensional data, in particular, the k-kNN method can effectively address the nonlinear separability of data and complex patterns in high-dimensional feature spaces.
2.3.2. Data expansion
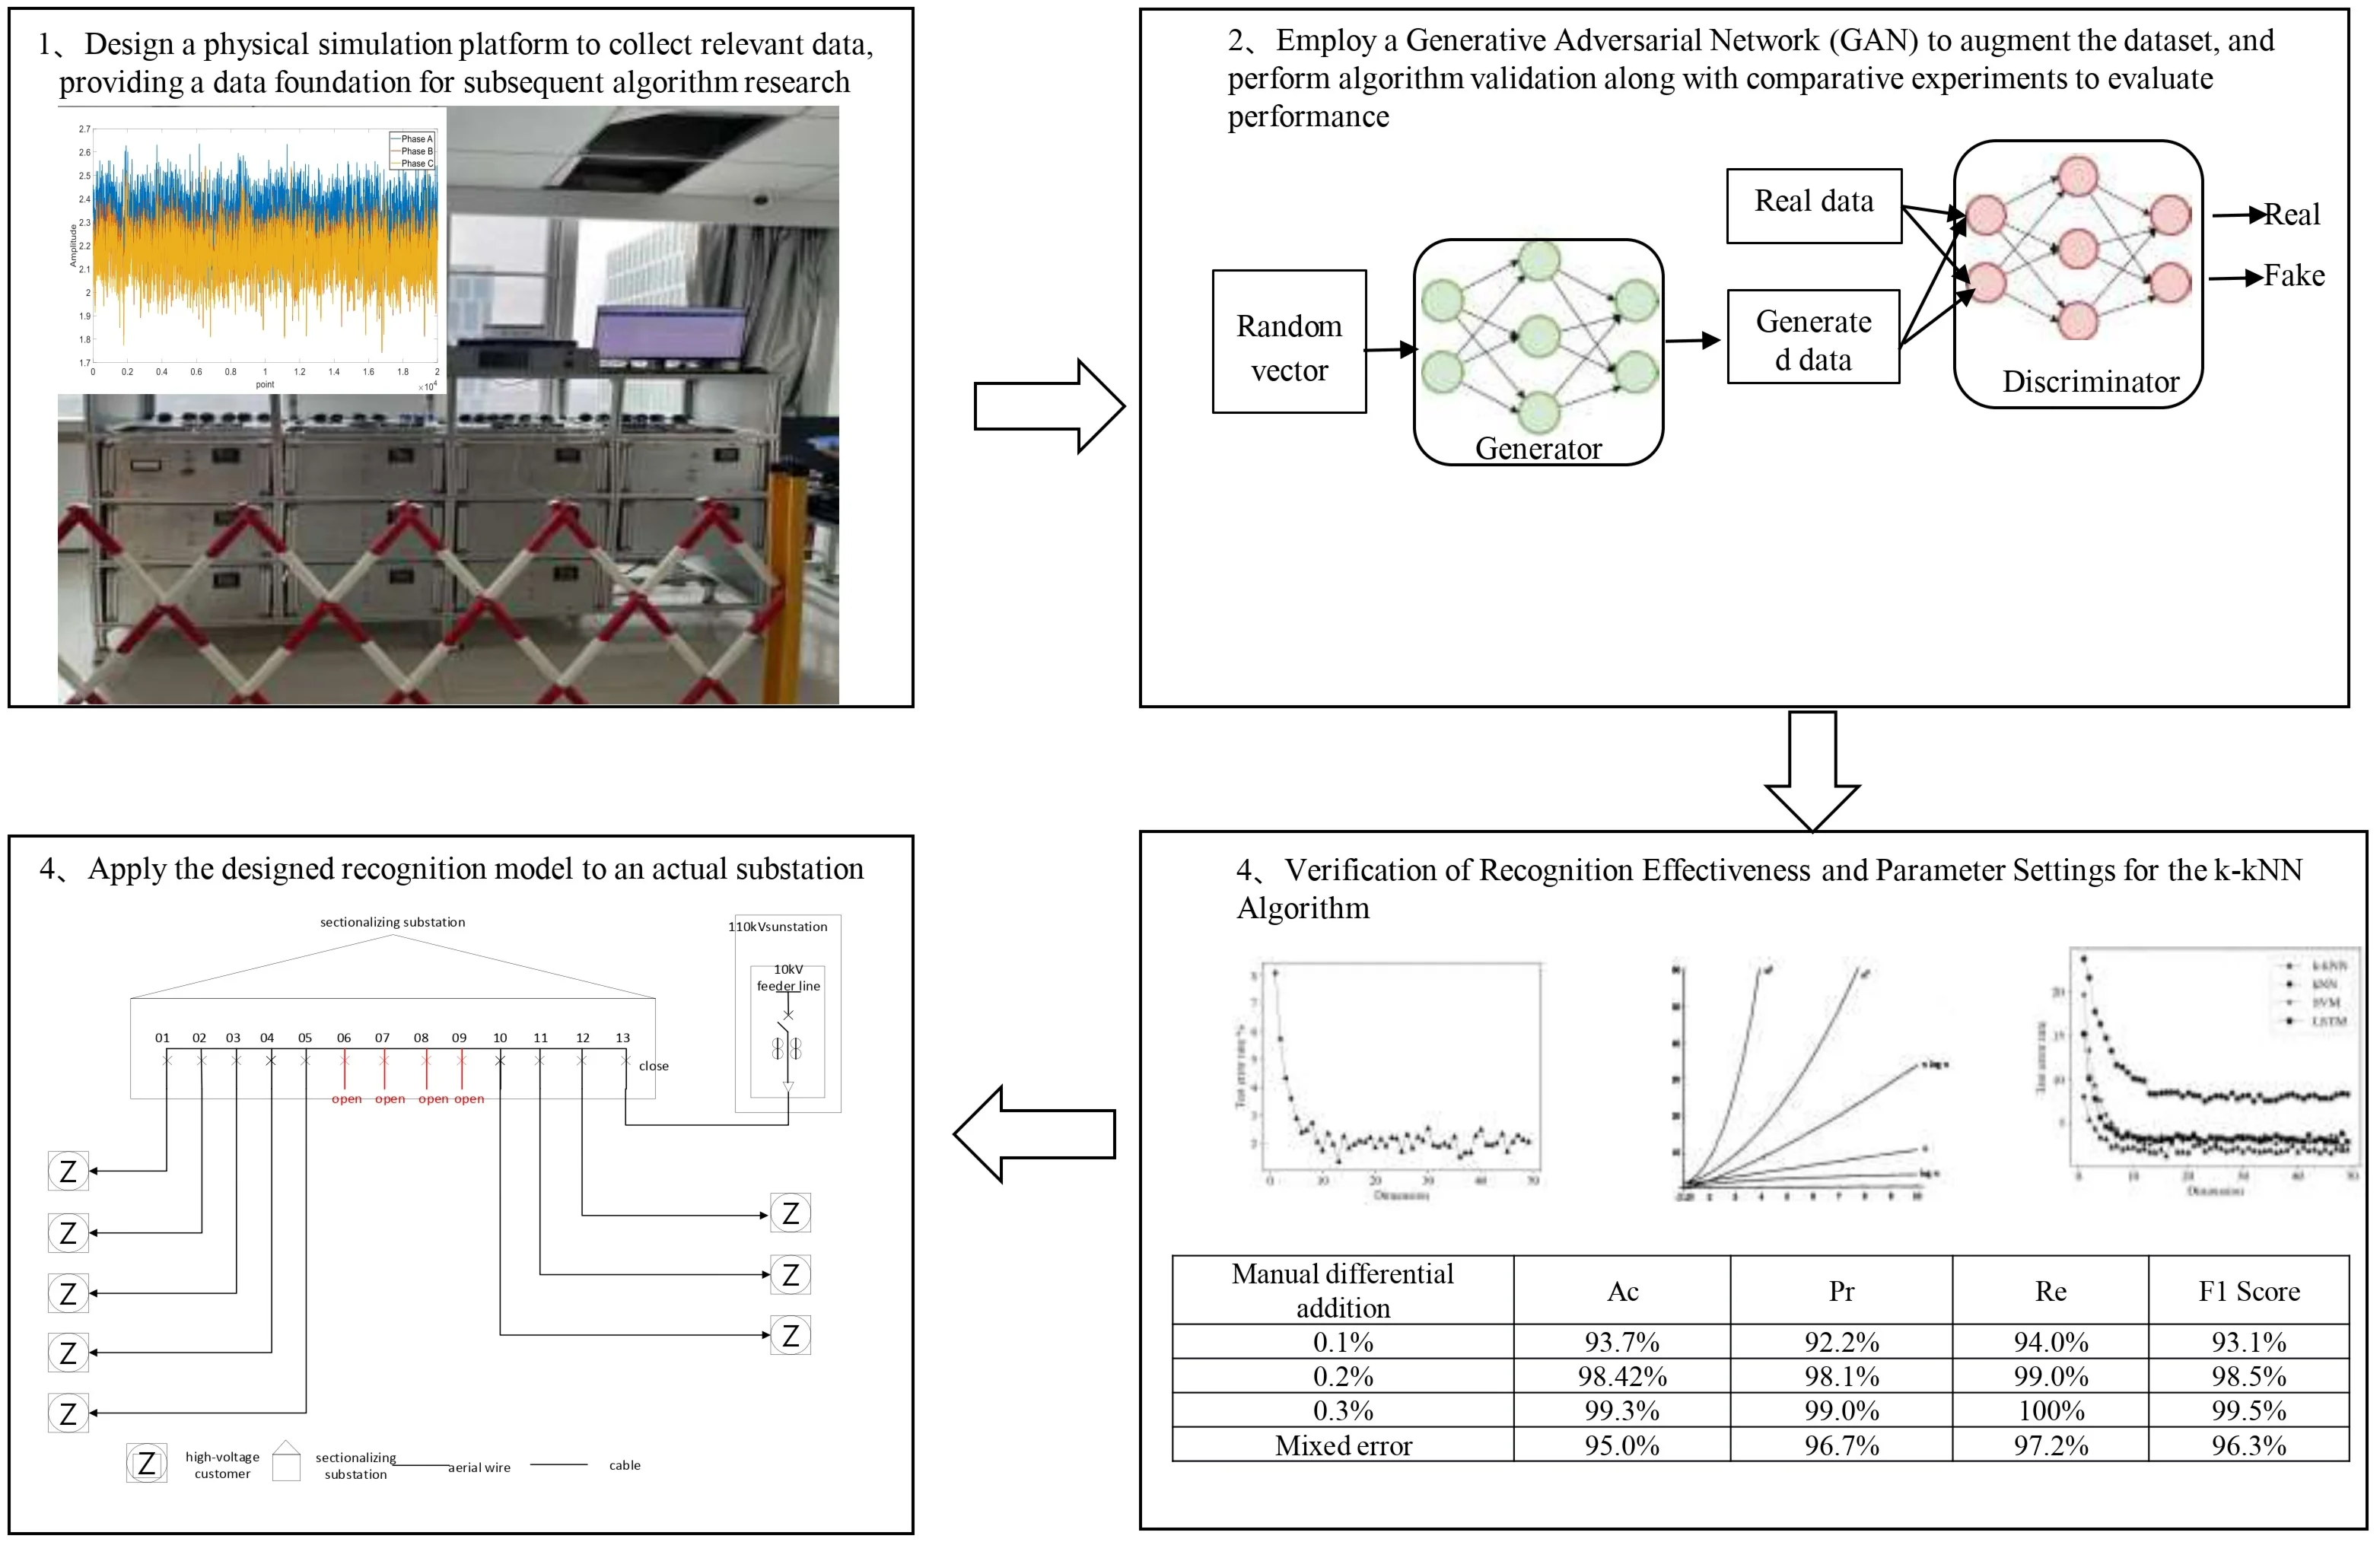
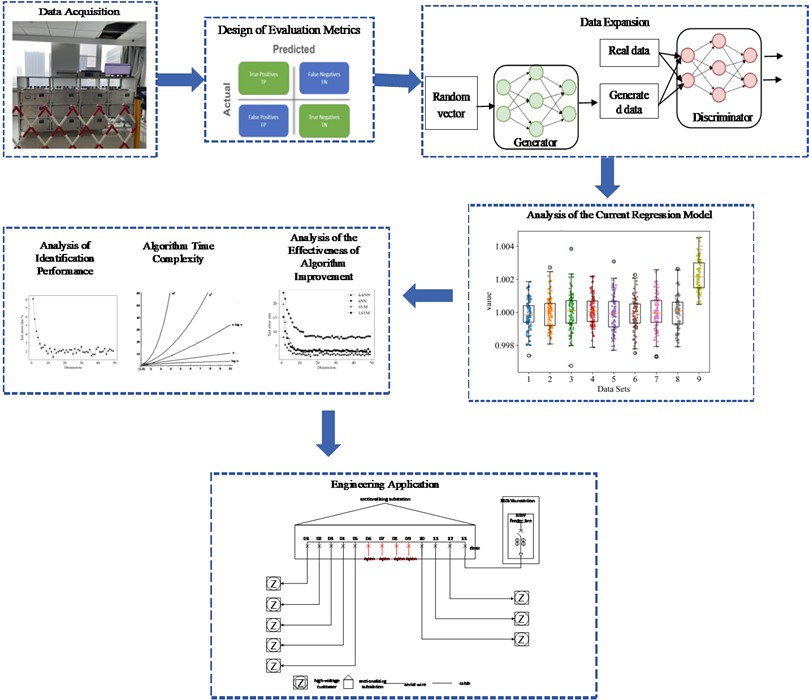
The techniques primarily used for generating new samples include data augmentation and data synthesis methods. Data augmentation generates new samples by applying transformations to existing data, such as rotating, flipping, and scaling images; time-stretching and pitch-shifting audio; and synonym substitution and sentence rearrangement for text. Data synthesis, on the other hand, utilizes statistical models or generative models (such as Generative Adversarial Networks (GANs), Variational Autoencoders (VAEs), etc.) to create entirely new samples that retain the primary characteristics and distribution properties of the original data. Both methods can effectively expand the dataset, enhancing the model's generalization ability and performance.
In this study, GANs (Generative Adversarial Networks) are employed for synthetic data generation. A GAN is a deep learning framework comprising two neural networks: the generator and the discriminator. The generator is responsible for creating realistic data samples from random noise, while the discriminator aims to distinguish between the generated fake samples and real data. Through adversarial training between the generator and the discriminator, the generator progressively learns to produce high-quality data that can deceive the discriminator, while the discriminator continually improves its ability to differentiate between real and fake data. This competitive process enables GANs to generate highly realistic new data samples, which is utilized in this study to augment the limited fault data of current transformers. The specific steps for expanding the historical data of current transformers are as follows:
1) Define the Generator and Discriminator .
2) Generator : where is a d-dimensional random noise vector drawn from a standard normal distribution.
3) Discriminator : it takes an m-dimensional vector as input and outputs a probability value between 0 and 1, indicating the likelihood that the sample is real data.
4) Set the Loss Function.
5) For the Discriminator , use the binary cross-entropy loss function :
where 1 indicates a real sample, 0 indicates a generated sample, represents the th real sample, and represents the corresponding random noise vector.
For the Generator , use the opposite loss function :
3. Training process
Initialize the parameters of the Generator and Discriminator . In each iteration, draw a batch of real samples , and corresponding random noise .
3.1. Generate new data
Certainly, here is the translation of the provided content into English: After sufficient training iterations, the Generator will learn to mimic the distribution of the real data. At this point, new random noise vectors can be input into the Generator to produce a batch of new historical data samples for current transformers. Through this process, the GAN algorithm not only increases the number of available training samples but also enhances the diversity of the samples. This, in turn, improves the robustness and generalization ability of the model.
3.2. Miscalibrated CT recognition process
CT miscalibration can cause changes in the relationship between the feeder area’s load current and the vector sum of individual user load currents. Hence, the complex coefficients corresponding to a miscalibrated CT are strongly associated with the miscalibration status. Given the precise and prompt electrical quantity information supplied by high-accuracy current collection equipment, in tandem with electrical a priori knowledge, one can employ a complex MLRM together with the k-kNN algorithm to realize the identification of miscalibrated CTs. The detailed procedure is as follows:
Step 1: First, data are gathered from the secondary side of the CT on the line via an acquisition device. With a unit time segment of 1 h, data at integer multiples of this time frame are selected to serve as the offline modeling dataset .
Step 2: Subsequently, a current model is developed employing the time series data acquired in step 1. Using Eq. (13), a complex MLRM is constructed from the data, following preprocessing. This results in the computation of the complex coefficient pertinent to every individual user. The ensemble of coefficients derived is subsequently partitioned, forming a training set and a test set.
Step 3: Based on Eq. (15), the kernel distances between the sample awaiting classification and all samples within the training set are computed.
1) To achieve adaptability to different line structures, a nonlinear relationship between the number of branch lines and the value has been introduced. A logarithmic function is used to convert the number of current transformers into smaller numerical values, thereby simplifying data representation when handling large numbers of branches. Given that the value must be an integer, the computed result is rounded. Additionally, a constant 10, determined through experimentation, is added to ensure the rationality of the threshold setting. The specific formula for calculating the adaptive value is as follows:
where, represents the number of branch lines in the circuit, and (round) denotes the rounding operation to the nearest integer. The constant 10 is the optimal offset determined through multiple experimental tests, aiming to balance recognition accuracy with computational efficiency. Find the r nearest training set samples from among the multiple kernel distances.
2) According to Eq. (19), compute the mean kernel distance between the sample awaiting classification and the r closest training samples:
Step 4: Compare with the average distance of samples from the training sample set. If is greater than or equal to the threshold, the CT metering status associated with this category of samples is normal. If y is less than the threshold, the CT metering status associated with this category of samples is abnormal.
The process is depicted in Fig. 1.
Fig. 1Flowchart of the miscalibrated CT recognition process
4. Verification by simulation experiments
To validate the practicability of the proposed miscalibrated CT recognition method for distribution networks, an experimental validation plan was devised under controlled laboratory settings. This plan took the measurement error condition of a 0.2-grade CT as a case study.
4.1. Analysis of computational resource requirement
For the application scenario of online identification of out-of-tolerance current transformers using the MLRM (Multiple Linear Regression Model) and k-kNN algorithm proposed in this paper, Table 3 provides specific parameter recommendations regarding CPU/GPU resources, memory consumption, and network bandwidth.
This table outlines the specific hardware and network parameters recommended to support the online identification of out-of-tolerance current transformers using MLRM and k-kNN algorithms, ensuring efficient processing, reliable operation, and real-time responsiveness.
Table 1Comparison of computation time for different algorithms
Category | Sub-item | Recommended parameters |
CPU | Recommended parameters | At least 8 cores; 16 cores or more recommended |
Clock speed | Each core should not be lower than 3.0 GHz | |
GPU | VRAM capacity | At least 8 GB GDDR5 or higher |
CUDA core count | More than 2048 CUDA cores, such as NVIDIA Tesla V100, A100 series | |
Memory | Total RAM | Not less than 32 GB DDR4; 64 GB or more recommended |
Memory frequency | Operating frequency above 2933 MHz | |
Bandwidth | Internal network speed | Gigabit Ethernet, ensuring a low-latency environment |
External network speed | 10 Gbps fiber connection, ensuring high bandwidth and stability | |
Network reliability | Equipped with redundant paths and support for Quality of Service (QoS) mechanisms | |
Storage system | Type | SSD solid-state drives recommended |
Capacity | Initial configuration of 1 TB SSD, expandable based on actual needs | |
Cooling and power supply | Cooling solution | Good cooling design, such as air-cooled or liquid-cooled solutions |
Uninterruptible power supply | Equipped with appropriate UPS devices to ensure the system can continue working for a period until safe shutdown in case of power failure |
4.2. Experimental design
Within the current simulation platform: One busbar set and nine feeder line sets are managed for connection by relay switches. An isolation transformer functions as a unit for voltage transformation and electrical insulation, tapping electricity from the distribution networks, which is subsequently reduced in voltage to supply the whole current platform as input voltage. The simulated load component comprises a voltage regulator and resistors. Each line’s voltage regulator is motor-controlled to mimic load fluctuations, thus replicating varying-current operational scenarios. The layout of the platform is depicted in Fig. 2.
Fig. 2Experimental platform circuit diagram
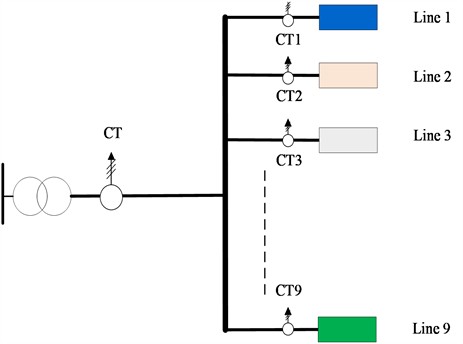
Each group’s single-phase CT is used to gather the current of their own line segments. The current acquisition and storage module, made up of acquisition cards and a host storage database, conveys and archives the data picked up by the CTs to the mainframe. The essential parameters of the platform are listed in Table 2.
Table 2List of main design components
Equipment | Model | Specification |
CT | 1A:50 mA 0.05% | Load Resistor 100 Ω |
CT | 1A:50 mA 0.2% | Load Resistor 100 Ω |
Load resistor | RX24 | 8 Ω 150 W |
Three-phase voltage regulator | TESGC2-1.5 | Step motor voltage regulation |
Isolation transformer | GFSBK-1200VA | 380 V: 20.7 V Y0/Y0 1200 VA |
4.3. Design of evaluation metrics
To substantiate the efficacy of the proposed approach, metrics are employed to evaluate the identification method. Model performance is gauged using methodologies characteristic of classifiers in the field of machine learning. The standard evaluation metrics for classifiers are the accuracy (Ac), precision (Pr), and recall (Re), which are computed as follows [25]:
where TP denotes true positives, TN denotes true negatives, FP denotes false positives, and FN denotes false negatives.
In real-world engineering applications, especially in the task of recognizing miscalibrated CTs, the count of TP instances significantly outweighs all other instances. Through the amalgamation of Pr and Re, the disproportionate effect of TPs on model assessment is circumvented. The combined evaluation standard of the F1 Score is therefore used, where a higher value signifies superior model recognition efficacy:
4.4. Analysis of the current regression model
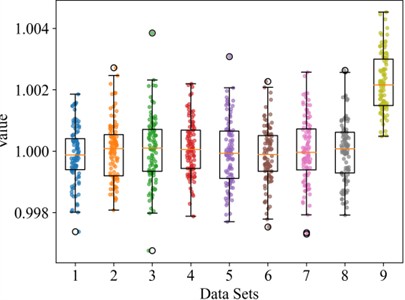
Employing a three-phase voltage regulator to emulate the electricity usage conditions of distribution network clients, data from measurements of three-phase CTs are gathered. The resulting dataset has a sample length of 20000, the output of which is illustrated in Fig. 3. Initially, leveraging the experimental line topology configuration, a multivariate linear equation grounded in CT measurement data is established, yielding the complex coefficients relating to every CT. The magnitude of a complex number quantifies the proportional discrepancy of CT ratio inaccuracies, so the magnitudes of complex numbers are substituted for complex coefficients to depict the impact of varying sample point counts on the optimal coefficient solution of the regression model. The root mean square error (RMSE) for differing sample point quantities is shown in Fig. 4. Through the manual introduction of discrepancies and stipulating the CT measurement of feeder No. 9 as anomalous, the magnitudes of the complex coefficients associated with each feeder line CT are computed. A boxplot of these results is portrayed in Fig. 5.
Fig. 3 illustrates that the inherent current fluctuations in the power grid make it challenging to directly distinguish between miscalibrated CTs and normal CTs solely from the data measured by the CTs. Therefore, it is necessary to separate the signal from the error characteristics of the line. As indicated by Fig. 4, the derivation of complex coefficients from a multivariate linear equation with varying sample sizes shows that there is an overall trend of decline as the number of samples increases, reaching equilibrium at around 300 sample points. Thus, the optimal number of sample points is set to 300. Fig. 5 shows that the statistics of miscalibrated CTs differ from those of normal CTs to some extent, confirming that complex coefficients reflect the metering status of CTs. However, during the operation of distribution networks, external disturbances may create sudden changes in coefficients, leading to overlapping phenomena between miscalibrated CT coefficients and those of normal CTs. The direct identification of miscalibrated CTs using a threshold method yields relatively low accuracy. Hence, there is a need for a simple and efficient identification algorithm for classifying complex coefficients, achieving detection of the CT metering status.
Fig. 3CT measurement data
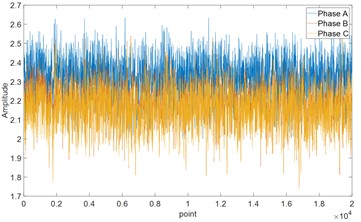
Fig. 4RMSE for different sample sizes
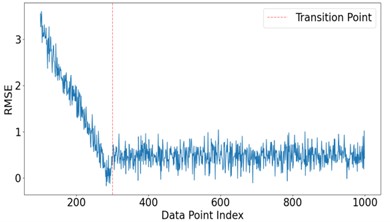
Fig. 5Boxplot of CT complex coefficients under different error states
4.5. Analysis of identification performance
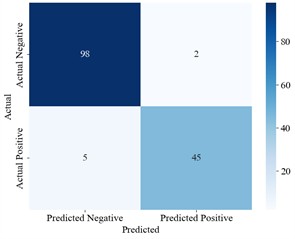
To substantiate the efficacy of the k-kNN identification algorithm proposed herein, computations are conducted on the coefficients of the MLRM formulated from the CT measurement data within a designated line topology context of distribution networks. An identification process is executed following every 1000 sets of coefficients, giving a total of 150 identifications. Table 3 presents the outcomes of coefficient identification amidst metering errors, encompassing scenarios with diverse added discrepancies. Employing the k-kNN algorithm anchored in line topology, the complex coefficients associated with each CT are analyzed, and their metering error conditions are identified. Fig. 6 shows the confusion matrix, which encapsulates the results of the identification process.
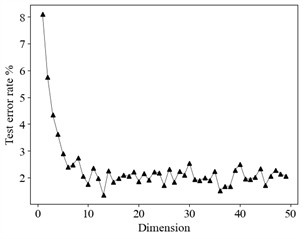
Analysis of Fig. 6 and Table 3 demonstrates that the coefficients of the multivariate linear equations, derived from the CT measurement data, effectively indicate the metering error status of the CTs. As illustrated in Fig. 7(a), as the ratio error increases, the associated complex coefficient decreases proportionately. Moreover, Fig. 6(b) indicates that, alongside the augmentation in coefficient dimensionality, the rate of misidentification progressively declines; however, any enhancement in identification accuracy becomes negligible at a dimension of 10. Therefore, the CT coefficients are divided into intervals of duration 10 for the purpose of identification. Employing the k-kNN algorithm, the coefficients from distinct time spans for each CT are subjected to identification. According to the confusion matrix relating to composite error identification, it is noteworthy that the F1 Score attains an impressive level of 96.3 %, and when the ratio discrepancy is as small as 0.1 %, the F1 Score remains high at 93.1 %. This substantiates the validity of the identification methodology proposed herein.
Fig. 6CT coefficient changes and identification performance
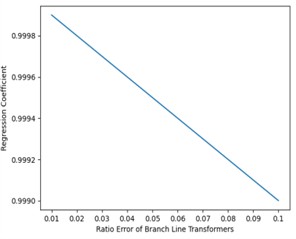
a) Variation of the branch ratio difference and the coefficient change
b) Effect of coefficient dimension on the test error rate
c) Identification result confusion matrix
Table 3k-kNN algorithm identification metrics
Manual differential addition | Ac | Pr | Re | F1 Score |
0.1 % | 93.7 % | 92.2 % | 94.0 % | 93.1 % |
0.2 % | 98.42 % | 98.1 % | 99.0 % | 98.5 % |
0.3 % | 99.3 % | 99.0 % | 100 % | 99.5 % |
Mixed error | 95.0 % | 96.7 % | 97.2 % | 96.3 % |
4.6. Analysis of the effectiveness of algorithm improvement
To substantiate the efficacy of the enhanced algorithm, CT recognition models were separately constructed employing the proposed k-kNN, conventional kNN, an SVM, and the long short-term memory (LSTM) methodology. Using the current of phase A as an example, the metrics of Ac, Pr, Re, and the F1 Score are listed in Table 4.
Fig. 7 illustrates the impact of dimensionality on the test error rate. One of the most significant features of k-kNN is its ability to achieve high classification accuracy at relatively low dimensions. At a dimension of 10, the test error rate reaches its lowest point at 2.5 %. As the dimensionality increases, the test error rates for all classification methods decrease, but beyond a certain dimension, the impact on classification performance becomes marginal. Thus, the coefficients are segmented into vectors of length 10 for identification purposes. The classification accuracies achieved under different identification algorithms are presented in Table 4. Compared with the original kNN identification model, the proposed k-kNN recognition model produces enhancements of 12.0 % in the F1 Score, 13.3 % in accuracy, and 12.0 % in recall. This suggests that, in contrast to conventional distance measurement methods, introducing a kernel function effectively enhances the recognition accuracy. Furthermore, compared with the other recognition algorithms, the proposed method scores highly on all evaluation metrics, demonstrating the superiority of k-kNN.
Fig. 7Impact of dimensionality on the test error rate
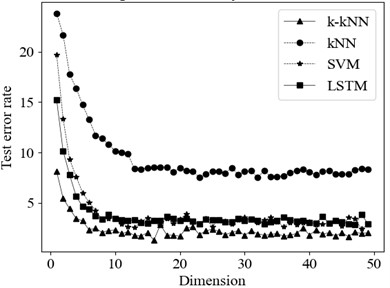
Table 4Identification metrics of different models
Model | Ac | Pr | Re | F1 Score |
k-kNN | 93.3 % | 95.0 % | 96.9 % | 95.9 % |
kNN | 80.0 % | 83.0 % | 84.9 % | 83.9 % |
SVM | 81.7 % | 85.0 % | 85.0 % | 85.0 % |
LSTM | 80.7 % | 84.0 % | 85.9 % | 84.9 % |
5. Engineering application
To validate the efficacy of the proposed miscalibrated CT identification methodology under real-world operational scenarios, the error states of CTs deployed in the field were assessed. The location of application was a designated feeder line and its associated consumer at a particular 110-kV substation situated in Hubei, China. The topological map of the primary connections for this feeder line is illustrated in Fig. 8.
Fig. 8Applied line schematic
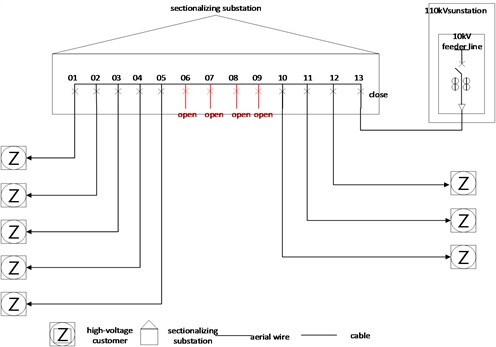
The outgoing line and eight user feeders are equipped with two sets of CTs, one being a traditional electromagnetic 0.05-grade CT and the other set being electronic 0.2-grade CTs. Based on the proposed identification method, the error state of the electronically coupled instrument transformers (ECTs) is analyzed, with the comparison results between electromagnetic CTs and ECTs serving as a reference for validation. The data collection interval is set at 1 s, and miscalibration identification was applied to the CTs for a period of one month. The identification results obtained from 80 experiments on the verification CTs using the proposed method are presented in Table 5.
Table 5Application recognition metrics
Ac | Pr | Re | F1 Score | ||
93.3 % | 95.0 % | 96.9 % | 95.9 % | ||
Set state | |||||
Total identification attempts | Normal | Miscalibration | |||
80 | 60 | 20 | |||
Identification state | |||||
Total identification attempts | Normal | Miscalibration | |||
80 | 62 | 18 | |||
Table 5 provides the detailed identification results from the engineering application, indicating that the overall identification metrics for all CT units are above 93 %. This demonstrates that the proposed k-kNN method is applicable for identifying miscalibrated CTs in distribution networks within an engineering context.
6. Conclusions
Integrating the analysis of the physical characteristics of currents in distribution networks, this paper has proposed a k-kNN-based miscalibrated CT identification method for distribution networks rooted in line topology. Without requiring a standard CT, it overcomes the limitations of conventional methods that require periodic power interruption for inspections. Initially, an MLRM was constructed based on the physical features of specific line currents, using secondary measurement data from CTs. Through the complex coefficients, this model indirectly reflects the metering error characteristics of CTs, mitigating the impact of inherent signal fluctuations on the identification outcomes. Employing a kernel function, the distance measurement in kNN was elevated from a low-dimensional space to a higher-dimensional one, enhancing the precision of kNN identification. Subsequently, the coefficients corresponding to different time periods for each CT were identified through the k-kNN algorithm, enabling the identification of miscalibrated CTs in distribution networks. Experimental and engineering application results demonstrate that when the CT ratio error exceeds 0.2 %, the F1 Score of the identification method proposed in this paper consistently exceeds 93 %, marking a preliminary realization of an exploratory approach for identifying miscalibrated CTs in distribution networks.
Although the proposed method performs well in laboratory and practical applications, there is still room for improvement in terms of real-time monitoring and rapid response, especially in large-scale distribution networks. Real-time data processing and quick identification are critical requirements in practical applications. Developing a real-time monitoring system to achieve continuous monitoring and rapid response of the status of CTs in distribution networks is essential. Combining IoT technology and edge computing can enable real-time data collection and processing, thereby enhancing the real-time performance and intelligence level of the system.
References
-
S. Key, C.-S. Ko, K.-J. Song, and S.-R. Nam, “Fast detection of current transformer saturation using stacked denoising autoencoders,” Energies, Vol. 16, No. 3, p. 1528, Feb. 2023, https://doi.org/10.3390/en16031528
-
C. Lu et al., “Split-core magnetoelectric current sensor and wireless current measurement application,” Measurement, Vol. 188, p. 110527, Jan. 2022, https://doi.org/10.1016/j.measurement.2021.110527
-
S. Wang et al., “Error state prediction of capacitor voltage transformer based on TimesNet and gate control unit,” in Journal of Physics: Conference Series, Vol. 2728, No. 1, p. 012063, Mar. 2024, https://doi.org/10.1088/1742-6596/2728/1/012063
-
X. Zhao and H. Wei, “Error evaluation method of capacitive voltage transformer based on improved principal component analysis,” Journal of Physics: Conference Series, Vol. 2625, No. 1, p. 012041, Oct. 2023, https://doi.org/10.1088/1742-6596/2625/1/012041
-
Y. Liang, A. He, J. Yuan, T. Wu, and Z. Jiao, “An accurate fault location method for distribution lines based on data fusion of outcomes from multiple algorithms,” International Journal of Electrical Power and Energy Systems, Vol. 153, p. 109290, Nov. 2023, https://doi.org/10.1016/j.ijepes.2023.109290
-
X. X. Fu et al., “Sudden fault diagnosis method of electronic transformer in digital substation based on wavelet transform,” (in Chinese), Power System Technology, Vol. 34, pp. 181–185, 2010, https://doi.org/10.13335/j.1000-3673.pst.2010.07.023.(in
-
X. Yang, “Research on fault diagnosis method of electronic transformer based on wavelet-fractal theory,” (in Chinese), Master’s thesis, Chongqing University, Chongqing, 2012.
-
M. Demetgul, K. Yildiz, S. Taskin, I. N. Tansel, and O. Yazicioglu, “Fault diagnosis on material handling system using feature selection and data mining techniques,” Measurement, Vol. 55, pp. 15–24, Sep. 2014, https://doi.org/10.1016/j.measurement.2014.04.037
-
E. N. H., “Fault diagnosis of electronic transformer based on wavelet neural network,” (in Chinese), Master’s thesis, Chongqing University, Chongqing, 2010.
-
W. Tao et al., “Research and application of fault diagnosis technology of active electronic transformer,” (in Chinese), Power System Protection and Control, Vol. 43, No. 18, 2015.
-
Q. Zhang, H. Cheng, H. Li, and W. Wei, “Multi-parameter degradation assessment model and method for error of digital electric energy measurement system,” Power System Technology, Vol. 39, No. 11, pp. 3202–3207, 2015, https://doi.org/10.13335/j.1000-3673.pst.2015.11.028
-
Z. Lai et al., “Leakage fault location of users with abnormal wiring based on residual current monitoring in serving zone of distribution transformer,” (in Chinese), Proceedings of the CSEE, 2023, https://doi.org/10.13334/j.0258-8013.pcsee.221924
-
X. Feng, B. Li, and S. Su, “Leakage location of wiring error of low-voltage user based on complex multiple regression,” (in Chinese), in Proceedings of the CSEE, Jul. 2024.
-
Z. Wang, X. He, H. Shen, S. Fan, and Y. Zeng, “Multi-source information fusion to identify water supply pipe leakage based on SVM and VMD,” Information Processing and Management, Vol. 59, No. 2, p. 102819, Mar. 2022, https://doi.org/10.1016/j.ipm.2021.102819
-
W. Huang et al., “Railway dangerous goods transportation system risk identification: comparisons among SVM, PSO-SVM, GA-SVM and GS-SVM,” Applied Soft Computing, Vol. 109, p. 107541, Sep. 2021, https://doi.org/10.1016/j.asoc.2021.107541
-
J. Kang, X. Han, J. Song, Z. Niu, and X. Li, “The identification of children with autism spectrum disorder by SVM approach on EEG and eye-tracking data,” Computers in Biology and Medicine, Vol. 120, p. 103722, May 2020, https://doi.org/10.1016/j.compbiomed.2020.103722
-
Z. Li et al., “Online monitoring method of voltage transformer based on K-nearest neighbor algorithm,” Power System Technology, 2024.
-
K. Yıldız, A. Buldu, and M. Demetgul, “A thermal-based defect classification method in textile fabrics with K-nearest neighbor algorithm,” Journal of Industrial Textiles, Vol. 45, No. 5, pp. 780–795, Oct. 2014, https://doi.org/10.1177/1528083714555777
-
C. Liu, S. Zhang, and Z. Wang, “Condition monitoring of wind turbine gearbox based on improved KNN regression,” (in Chinese), China Testing, Vol. 47, No. 1, pp. 153–159, 2021, https://doi.org/10.19805/j.cnki.jcspe.2023.06.013
-
L. Shi et al., “Identification of running status of renewable energy power generation unit based on improved KNN,” (in Chinese), Electric Power Automation Equipment, Vol. 44, No. 5, pp. 65–72, 2024, https://doi.org/10.16081/j.epae.202311009
-
K. Jia, J. Wang, and Y. Lin, “Research on suppression of LED nonlinearity by KNN cascade equalizer based on rough set improvement,” Journal of Beijing University of Posts and Telecom, Vol. 46, No. 5, pp. 15–21, 2023.
-
D.-W. Xu, Y.-D. Wang, L.-M. Jia, H.-J. Li, and G.-J. Zhang, “Real-time road traffic states measurement based on Kernel-KNN matching of regional traffic attractors,” Measurement, Vol. 94, pp. 862–872, Dec. 2016, https://doi.org/10.1016/j.measurement.2016.08.038
-
S.-H. Liu, J.-Y. Zhang, J. Xu, and H.-E. Jia, “k-kNN: Kernel k-nearest neighbor algorithm based on information energy metric,” (in Chinese), Acta Automatica Sinica, Vol. 36, No. 12, pp. 1681–1688, May 2011, https://doi.org/10.3724/sp.j.1004.2010.01681
-
J. V. Davis, B. Kulis, P. Jain, S. Sra, and I. S. Dhillon, “Information-theoretic metric learning,” in ICML ’07 and ILP ’07: The 24th Annual International Conference on Machine Learning Held in Conjunction with the 2007 International Conference on Inductive Logic Programming, pp. 209–216, Jun. 2007, https://doi.org/10.1145/1273496.1273523
-
J. Opitz, “A Closer Look at classification evaluation metrics and a critical reflection of common evaluation practice,” Transactions of the Association for Computational Linguistics, Vol. 12, pp. 820–836, Jun. 2024, https://doi.org/10.1162/tacl_a_00675
About this article

The authors have not disclosed any funding.
The datasets generated during and/or analyzed during the current study are available from the corresponding author on reasonable request.
Huiqin Xie was responsible for the overall conception of the research topic and revised the paper. Xiujuan Zeng wrote the initial draft of the paper. Tong Liu, Wei Wu, and Yiyi Peng were responsible for collecting information and writing programs for the paper.
The authors declare that they have no conflict of interest.
